Biomedical monitoring system using LabVIEW FPGA Souhir CHABCHOUB 1, Sofienne MANSOURI 2, Ridha BEN SALAH 3 1,2
University of Tunis El-Manar, ISTMT, Laboratory of Biophysics and Medical Technologies, 1006 Tunis, Tunisia 3 Salman Bin Abdulaziz University & College of Applied Medical Sciences, Saudi Arabia
[email protected] 1
[email protected] 2
[email protected] 3
Abstract—The purpose for researchers in medical electronics field, in signal processing and information field is to provide powerful and low-cost systems to help doctors to make his specific spots. In this paper, a biomedical monitoring system is proposed based on LabVIEW FPGA. This monitoring system has the advantage to acquire and analyze several physiological signals. The Electrocardiogram (ECG), Electroencephalogram (EEG) and Electromyogram (EMG) signals are recorded from respectively the heart, the brain and the muscle. Then, each signal is amplified, filtered and displayed on the computer. The designed system can be used to determine and monitor some physiological parameters. This system is designed using a National Instrument data acquisition device. The signals processing, the display as well as the user interface are managed by the Laboratory Virtual Instrument Engineering Workbench (LabVIEW) with the specialized module LabVIEW FPGA. The field programmable gate arrays (FPGA) configuration has not been made by Verilog Hardware Description Language (VHDL) but rather by a graphic programming with the LabVIEW FPGA. The programming by LabVIEW saves a lot of time and can be easily verified in the case of a bug. This system allows the determination of some physiological parameters and can be used as a powerful vital signs monitor. Keywords— ECG; EEG; EMG; LabVIEW; FPGA
I. INTRODUCTION Generally, doctors and nurses prefer to use a multiparametric, powerful, accurate, and easy to use system. The vital monitoring systems available in the market can record one type of signal, such as the ECG monitors [1], the EEG monitors [2], the EMG monitors [3], etc. There were also some monitoring systems which can record several signals, such as the ECG, CO2, SPO2 signals [4, 5]. Thus, we cannot find a powerful system that allows monitoring all types of physiological signals. The great number of the biomedical monitoring systems in hospitals can cause the cluttering and congestion in the patients’ rooms. The developments of medical electronics and computer engineering have provided several methods to improve the quality of available systems. But such methods are still limited, incomplete and unused in clinical routine. There were several proposed monitoring systems in the literature
[6-12]. In [6], a real-time ECG monitoring system is designed and developed based on FPGA. In [7], the authors designed an EEG acquisition system based on FPGA memory architecture. An FPGA design and implementation of an ECG biomedical embedded system is presented in [8]. A system is developed to acquire both the ECG and the EMG signals [9] using in ALTERA FPGA card [10]. In [11], the authors proposed a system which will monitor the human heartbeat and EEG signals using the FPGA technology and the LabVIEW platform. In [12], the authors presented the design and the implementation of a two channels recording system and its adaptation to an FPGA based acquisition system. These two channels are the ECG and the Intraventricular Pressure. In this study, a new and powerful biomedical monitoring system is proposed. Our biomedical monitoring system can be used, firstly, to acquire ECG, EEG and EMG signals. And more, it can analyse signals, determine some physiological parameters and activate an alarm if one of these parameters is abnormal. Our monitor is conceived around a design bench of National Instruments and a programming language LabVIEW with the LabVIEW FPGA module. The paper is organized as follows. Section II explains the background. Section III presents the proposed system and the implementation methodology. The results are presented in section IV. Section V summarizes the conclusion. II. BACKGROUND A. Presentation of the Signals The electrocardiogram (ECG) measures the heart’s electrical activity through electrodes placed on the limbs or chest. The ECG signal is composed of several successive waves which are the P wave, the QRS complex and the T wave. These waves are used to determine cardiovascular parameters such as heart rate and respiratory rate. The electroencephalogram (EEG) measures the electrical activity of the brain through electrodes placed on the scalp. The location of the electrodes is standardized by an international nomenclature system called 10/20. The EEG signal contains several kinds of waves such as alpha wave,
978-1-4673-6636-6/15/$31.00 ©2015 IEEE
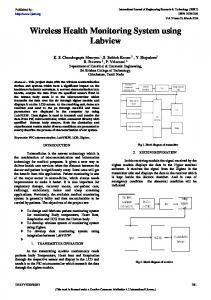
beta, gamma and theta waves and each brain wave has different frequencies [13]. The electromyography (EMG) measures the electrical activity of muscles through electrodes placed on the muscle to explore. The EMG signal has a random amplitude. It’s close to zero if the muscle is inactive, and of higher amplitude if the muscle is contracted. From this signal, the root mean square (RMS) and the spectrum can be determined and therefore the phenomenon of muscular fatigue can be studied [14]. B. LabVIEW LabVIEW (Laboratory Virtual Instrument Engineering Workbench), as a programming language, is a powerful tool that can be used to help achieve the goals. LabVIEW is a graphically base programming language developed by National Instruments. Its graphical nature makes it ideal for test and measurement, automation, instrument control, data acquisition and data analysis application [15]. C. FPGA The Field Programmable Gate Arrays FPGAs are digital integrated circuits that contain a matrix of configurable logic blocks connected via programmable interconnects. Design engineers can configure such devices to perform an enormous variety of tasks. Some FPGA as may only be programmed a single time, while others may be reprogrammed over and over again [16]. Systems based on FPGAs provide fives advantages over conventional implementations: the performance, time to market, cost, reliability, and long-term maintenance. FPGAs can be used for control, signal processing, digital communication, health monitoring, custom timing and triggering. The major manufacturers of FPGAs are Xilinx and Altera, Atmel, Actel, etc. III. SYSTEM IMPLEMENTATION A. System Overview Fig.1 shows the block diagram of the biomedical monitoring system. This system is conceived around a design bench of National Instruments constituted by a PXI-7841R card, a NI PXI-1033 chassis, a NI SCB-68 shielded connecting block and a graphical programming language LabVIEW [17].
Fig. 1. Block diagram of the biomedical monitoring system.
The input of the system is a shielded connection block, the SCB-68. The SCB-68 is connected to the FPGA board
(PXI-7841R). The FPGA board is placed in the NI PXI-1033 chassis by a high performance shielded cable. The system is managed by the LabVIEW software. The use of programmable devices (FPGA) and hardware design LabVIEW enable to expedite prototyping of our system. The NI PXI-1033 is a chassis with an integrated MXIExpress controller. In this chassis, the FPGA board is installed; the PC communication is done with the PCI Express PCIe-8361 card with a rate of 110MB / s. The chassis offers a protection to the FPGA board against dust, shock, and moisture. The core of the FPGA NI PXI-7841R board is an FPGA target, the Xilinx Virtex-5 LX30. This intelligent data acquisition card includes an FPGA target connected to the Inputs / Outputs and with interface bus, an analog/digital and digital/analog converters, and an instrumentation amplifier. The NI SCB-68 is a shielded connection block with terminal screws for in easy Input/ Output connections. The SCB-68 block is connected to the FPGA board by a highperformance shielded cable. This cable is specifically designed for very good signal integrity. The signal processing, the display and the user interface are managed by the LabVIEW Professional Development System; version: 8.6 with the specialized module LabVIEW FPGA [18]. Typically, FPGAs are programmed using software development tools such as VHDL and Verilog, which require overcoming a very steep learning curve. The NI LabVIEW FPGA Module extends the LabVIEW to target FPGAs on NI Reconfigurable I/O hardware. Therefore, scientists and engineers take advantage of the performance and flexibility of FPGAs without needing to learn the low-level design tools [17]. LabVIEW programming saves a lot of time and can be easily verified in the case of a bug. The compilation of FPGAs using LabVIEW FPGA module is presented as follows: •
Step 1: Converting the graphical code LabVIEW to VHDL.
•
Step 2: Creation of “bitstream (a series of bytes)” using the Xilinx compile tools.
•
Step 3: Loading the “bitstream” on the FPGA.
B. Processing Signal In this study, we propose to design a multiparametric biomedical system enable to acquire ECG, EEG, and EMG signal from respectively, the heart, brain and muscle. The ECG, EEG and EMG signals are acquired, treated and analyzed with LabVIEW software using the FPGA technology. Fig.2 illustrates the different steps of processing signals. These steps are presented as follows: •
Step 1: The acquiring module to acquire the ECG, EEG, and EMG signals.
•
Step 2: The pre-processing module to filter and amplify the signals.
•
Step 3: The treatment module including the determination of some physiological parameters.
(a)
(b)
Fig. 3. A typical example of the ECG signal: (a) before and (b) after filtering steps.
Typically, the ECG signal is affected by respiratory artifacts that can perturb the R peaks detection and the measure of heart rate. Therefore, a step of baseline correction is performed using a median filter. Fig.4 shows an example of the ECG baseline correction.
Fig. 2. Block diagram of the processing signals.
In the first step, the acquisition module is designed. This module includes two Virtual Instrument (VI); the VI FPGA interface and the VI Host interface. The VI FPGA presents the program to be downloaded in the FPGA target. The VI Host presents the part of the program managed by the computer. The output of the VI Host is connected to a stage of linearization that allows to display the signal amplitude in volts. The FPGA can generate a maximum voltage of 10V. The quantification is performed on 16 bits [19], thus linearization formula is:
(a)
(b)
(c) (1)
Then, we have saved and run the FPGA VI. The graphical programming is transformed to VHDL code, and next the Xilinx tools will transform this VHDL code in “Bitstream” file. This operation lasted about 13 minutes. The generated signal will be transferred to the connection block, the “SCB-68”. In the second step, the pre-processing module is designed. This module includes two stages: filtering and amplification [20, 21]. Generally, all physiological signals have low amplitude, thus a stage of amplification must be added. An amplification factor of 1000, 10000 and 5000 is set for respectively the ECG signal, the EEG signal and the EMG signal. For filtering, we used a notch filter to eliminate the interference of 50 Hz and a band pass filter centered in the frequency of each physiological signal (0.05-100 Hz for ECG, 1-70 Hz for EEG and 20-500 Hz for EMG). Fig.3 shows an example of ECG signal of healthy subject after and before filtering procedure.
Fig. 4. Correction of the ECG baseline: (a) original ECG signal affected with respiratory artifacts, (b) the detected baseline, (c) the filtered ECG signal.
Finally, the physiological parameters are extracted and analyzed. We can determine, from ECG signal, cardiovascular parameters such as the heart rate and the respiratory rate. The Determination of the heart rate is performed by detecting the QRS complex. The QRS complex detection algorithm is inspired from the method of Pan & Tompkins [22]. The Pan & Tompkins algorithm includes a series of band pass filters and operators that performs derivative, squaring, integration and adaptative thresholding operations. The different steps of the algorithm are illustrated in Fig.5. To determine the respiratory rate, we increased the threshold of QRS complex detection's using the same algorithm (Pan& Tompkins). Then, we tried to draw the respiratory curve by evolution of R peaks’ amplitudes according to their respective positions. If each of these parameters is abnormal, an audio-visual alarm is activated.
(a)
Fig. 5. Algorithm of the QRS detection using the Pan &Tompkins method
The EEG signal contains several kinds of waves, such as alpha wave, beta, gamma and theta waves. Each wave has a frequency band different from the others waves. For our system, we propose a separation between the alpha and beta waves by a simple filtering operation. This separation allows facilitating the diagnosis for the neurologists [23]. Fig.6 shows the separation results between alpha and beta waves. For EMG signal analysis, a temporal and a frequency representation is performed. In the temporal representation, we (1) rectified, (2) smoothed the EMG signal to reduce high frequency noise and (3) we determined the root mean square RMS. In the frequency representation, an FFT was applied to obtain the EMG spectrum. These processes help the doctors to diagnose the phenomenon of muscular fatigue [24]. Fig.7 presents the temporal and frequency analyses of a typical EMG signal.
(c)
IV. RESULTS The graphical language LabVIEW was transformed into VHDL, then into BitStream. This operation lasted approximately 13 minutes. When the configuration is finished, a report is issued mentioning the cost in hardware terms of the implementation on the FPGA target. The accuracy of the system has been validated by several measurements performed on twenty healthy subjects. Noted that the heart rate (HR) values for each subject has been compared with the values of heart rate obtained with an ECG monitor, we concluded that the difference between the two systems does not exceed 3 beats/ minute. Fig.8 shows the front face of the designed interface. This interface acquire and display the ECG, EEG, EMG signals. The real- time signal, the heart rate and the respiratory rate are displayed in the ECG interface. If the values of the heart rate or the respiratory rate exceed the limits, an audio-visual alarms are triggered. In EEG interface, the signal, the alpha and beta waves are displayed separately. In EMG interface, the spectrum and RMS evolution are determined. The designed interface facilitates well the diagnosis for doctors, especially cardiologists and neurologists.
(a)
(b)
(b)
Fig. 7. Treatment of EMG signal. (a) The original EMG signal, (b) The EMG spectrum, (c)The RMS determination.
(c)
Fig. 6. Separation results between alpha and beta waves in the EEG signal of a healthy subject with open and closed eyes. (a) The original signal, (b) The beta wave, (c) The alpha wave.
Our interface can archived all information concerning patients, such as the name and surname, date of birth, file number, date and time of the exam. We have, also, buttons that manage printing and saving of data. This system can be used to monitor a large number of patients in the same room of the hospital.
[7]
[8]
[9]
[10]
[11] Fig. 8. Biomedical monitoring system, the ECG interface.
[12]
This biomedical system obeys several requirements of the IEC 62353 norm concerning to the electrical security and specially for the insulation resistance and leakage current. The security tests were carried out using the electrical safety analyzer, the "Rigel 28".
[13]
Our proposed system is also suitable for integration of other types of signals. We can include the bioimpedance signal, the phonocardiogram, the electro-oculogram… Finally, we can replace the wired connection by a Bluetooth. V. CONCLUSION In this paper, we have proposed a new and powerful biomedical monitoring system using LabVIEW FPGA. This system is conceived with a National Instruments bench whose core is a Xilinx FPGA target programmed with the LabVIEW FPGA module. The complexity, the slowness, and the risk of error in programming VHDL has been bypassed with programming in G language through LabVIEW FPGA module. It is a very successful tool that allows accelerating any type of design. REFERENCES [1] [2] [3] [4] [5] [6]
G Aspel ASCARD Green datascheet, www.distrimed.com The Mitsar EEG 201 and 202 models, www.dimachki.com PS850 system datascheet, www.biometricsltd.com Mindray datasheet, www.medicalexpo.com M9500 Patient Monitor, user’s Manual, www.blt.com.cn Yongming Yang, Xiaobo Huang, Xinghuo Yu, “Real-Time ECG Monitoring System Based on FPGA”, The 33rd Annual Conference of the IEEE Industrial Electronics Society (IECON), Taipei, Taiwan, Nov. 5-8, 2007.
[14]
[15] [16] [17] [18] [19]
[20]
[21]
[22]
[23]
[24]
K.Vijayalakshmi , S. Ramachandran, M. Chandrasekaran, “ FPGA Based Reconfigurable Memory Interface Design for EEG Data Acquisition”, IOSR Journal of VLSI and Signal Processing, Volume 4, Issue 6, PP 47-55, Nov - Dec. 2014. Nur Sabrina Risman, Siti Norhayati Md Yassin, Chen Wei Sia, Yuan Wen Hau, and Nazrul Anuar Nayan, “FPGA Design and Implementation of Electrocardiogram Biomedical Embedded System”, IEEE Conference on Biomedical Engineering and Sciences, Miri, Sarawak, Malaysia, 8-10 December 2014. Fauzani.N Jamaluddin, Siti A. Ahmad, Samsul Bahari Mohd Noor, Wan Zuha Wan Hasan, “Flexible Bio-signals Channels Acquisition System for ECG and EMG Application”, Research and Development (SCOReD) IEEE Conference, 16-17 Dec. 2014. R. Soto-Camacho, M. A. Vargas, S. Vergara, F. Reyes, A. Palomino, M. Vargas, “Design of an Acquisition System for bioelectric signals (heart) using an embedded system in FPGA platform”, Devices, Circuits and Systems (ICCDCS) IEEE Conference,2-4 April 2014. Sabeetha Begum.M, Kumarnath.J, “LABVIEW Based Module For Bio Signals Monitoring”, International Journal of Computer Science and Mobile Computing, Vol.3 Issue.2, pg. 423-431, February- 2014. L. P. Córdoba, M. A. G. López, C. B. Goy and M. C. Herrera, “Design and Evaluation of Pressure and Eelectrocardiographic Modules Embedded in a Cardiac Hemodynamic Monitor”, IEEE Latin America Transactions, VOL. 11, NO. 1, FEB. 2013. S. Mantri, V. Dukare, S. Yeole, D. Patil, V. Wadhai, “A Survey: Fundamental of EEG, International Journal of Advance Research in Computer Science and Management Studies”, Volume 1, Issue 4, September 2013. Ruchika, Shalini Dhingra, “An Explanatory Study of the Parameters to Be Measured From EMG Signal”, International Journal Of Engineering And Computer Science, Volume 2 Issue 1 No. 207-213, Jan 2013. R. Bitter, T. Mohiuddin, M. Nawracki,”LabVIEW: Advanced Programming Techniques”,second edition, 2007. Clive Maxfield, “The design warrior’s guide to FPGA”, 2004. http://www.ni.com/products/f/ Massimo Lanzoni, “LabVIEW FPGA Module”, A tutorial using Xilinx Spartan 3 Spartan 3-E Dev Kit, 5/17/2011. S.Mansouri, H. Mahjoubi, R. Ben Salah, “Design of a peripheral bioimpedance prototype with an FPGA Virtex-5 LX30”, IRBM 31, NO.280–288, 2010. D.P. Morales, A. García, E. Castillo, M.A. Carvajal, J. Banqueri, A.J. Palma, “Flexible ECG acquisition system based on analog and digital reconfigurable devices”, Sensors and Actuators A: Physical, Volume 165, Issue 2, February 2011. Jingpeng Wang, Liqiong Tang, John E Bronlund, “Surface EMG Signal Amplification and Filtering”, International Journal of Computer Applications, Volume 82 – No1, November 2013. J. Pan and W. J. Tompkins, “A real-time QRS detection algorithm”, IEEE Transaction On Biomedical Engineering, vol. BME-32, NO.3, March 1985. Mamatha M.N, Dr S. Ramachandran, Dr M.Chandrasekaran, “Smart Sensor Design Analysis in Brain Machine Interface using Labview”, International Journal of Computer Applications, Volume 17– No.2, March 2011. J. Wang, L. Tang, J.E. Bronlund, “Surface EMG Signal Amplification and Filtering”, International Journal of Computer Applications, Volume 82 – No1, November 2013.