BioScout: A Life-Science Query Monitoring System Anastasios Kementsietsidis IBM T.J. Watson Research Center
[email protected]
Frank Neven
Dieter Van de Craen
Hasselt University and Transnational Univ. of Limburg
Hasselt University and Transnational Univ. of Limburg
[email protected] [email protected]
ABSTRACT
gid 4763 4771 7682 1145
Scientific data are available through an increasing number of heterogeneous, independently evolving, sources. Although the sources themselves are independently evolving, the data stored in them are not. There exist inherent and intricate relationships between the distributed data-sets and scientists are routinely required to write distributed queries in this setting. Being nonexperts in computer science, the scientists are faced with two major challenges: (i) How to express such distributed queries. This is a non-trivial task, even if we assume that scientists are familiar with query languages like SQL. Such queries can get arbitrarily complex as more sources are considered; (ii) How to efficiently evaluate such distributed queries. An efficient evaluation must account for batches of hundreds (or even thousands) of submitted queries and must optimize all of them as a whole. In this demo, we focus on the biological domain for illustration purposes (our solutions are applicable to other scientific domains) and we present a system, called BioScout, that offers solutions in both of the above challenges. In more detail, we demonstrate the following functionality: (i) in BioScout, scientists draw their queries graphically, resulting in a query graph. The scientist is unaware of the query language used or of any optimization issues. Given the query graph, the system is able to generate, as a first step, an optimal query plan for the submitted query; (ii) BioScout uses four different strategies to combine the optimal query plans of individual queries to generate a global query plan for all the submitted queries. In the demo, we illustrate graphically how each of the four strategies works.
gname organism NF1 Human NF2 Human Pp2r3a Mouse Zfp295 Mouse (a) Genbank
pid pname species P2135 N-min HM O0066 N-tosis HM P3524 Merlin HM Q3UM7 Riken MS Q9Z17 Ph/tase MS (b) SwissProt
gid pid 4763 P2135 4763 O0066 1145 Q3UM7 (c) Map. table from Genbank to SwissProt
Figure 1: Sample instances and mapping table use them in research, scientists are routinely required to manually write queries that combine data from a number of such sources (e.g. see [20]). This process is often tedious and time consuming, as scientists are often non-experts in database technology or query languages. Even worse, due to the continuous evolution of the data, scientists are obliged to repeat their queries over time to retrieve the most fresh data. The objective of this work, and this demo, is to present solutions that lessen the burden of the scientists by facilitating both the specification of queries and by optimizing their (continuous) evaluation. To this end, we demonstrate a user-friendly distributed-query monitoring system, called BioScout, that relieves scientists (in this particular scenario, biologists) from repeating their queries over time. In the BioScout-system biologists can visually create distributed queries as graphs. These queries are then periodically evaluated by the system and the biologists are informed when new results are found. As an example of a usage scenario, we look at the following query from the biological domain: Q =get the human genes that influence breast cancer and that translate to proteins related to breast cancer with as function GTPase activator (≈GO:0005096). To answer this query, the biologist must combine data from multiple sources, since different sources specialize in different aspects of the domain. In this example, four sources are required: Genbank [5] which specializes in genes, OMIM [21] which specializes in diseases with a genetic component, SwissProt [2] in proteins, and Go [1] in functional descriptions of proteins (among other things). We assume here that the sources are relational and Figures 1(a) and (b) show sample instances for the Genbank and SwissProt sources. Since the sources are heterogeneous some sort of integration is necessary so that we can tell, for example, which gene in Genbank is associated with which protein in SwissProt, or which protein in SwissProt is associated with which functional description in Go. Mapping
1. INTRODUCTION From new laboratory processes and sensors, to particle accelerators and arrays of telescopes, there have been rapid advancements in technology which led to an abundance of scientific data [10]. Such technology however, is not limited to a selected few. Therefore, not only there is an abundance of data, but also there is an increasing number of independently evolving (heterogeneous) sources that are storing these data. To make sense of these data and
Permission to make digital or hard copies of all or part of this work for personal or classroom use is granted without fee provided that copies are not made or distributed for profit or commercial advantage and that copies bear this notice and the full citation on the first page. To copy otherwise, to republish, to post on servers or to redistribute to lists, requires prior specific permission and/or a fee. EDBT’08, March 25–30, 2008, Nantes, France. Copyright 2008 ACM 978-1-59593-926-5/08/0003 ...$5.00.
730
Genbank (gid =out,organism=‘Homo sapiens’)
m1
the optimal query plan for this query is computed. Optimization here does not minimize evaluation times. After submitting (often large batches of) queries, scientists are usually willing to wait even a whole day for the answers. Instead, given that queries are distributed, optimization here focuses mainly on minimizing the communication cost (similar in spirit to [3, 4]) that results from the potentially high query volume. BioScout uses a branch-and-bound algorithm to compute the optimal plan of a single query [15]. The novelty of the algorithm is primarily its cost-model used for the graph query plans. Unlike existing algorithms whose costmodels rely on maintaining detailed statistics, the BioScout algorithm is tailored to work on distributed, heterogeneous environments where such statistics are often not available and where each source often has to make local decisions without having access to a global view of the system. The optimal plan of a single query is also represented as a graph. The size and shape of the evaluation graph is often different from that of the query graph. Nodes that appear only once on the query graph sometimes have more than one occurrences in the evaluation graph (since during query evaluation, the same node might be visited multiple times) [15]. Where BioScout really stands out from the related work in the area is in its ability to combine the optimal plans of multiple queries in order to come up with a unique global optimal plan. Indeed, while multi-query optimization has been studied in the literature (although, to a lesser extent than single-query optimization), the existing works only consider the optimization of a few tens of queries (at best). The contribution of BioScout is the introduction of multi-query optimization algorithms that scale to hundreds, or thousands, of queries [15]. This ability to scale is essential for the scientific settings considered here and, to the best of our knowledge, this is the first work in the area of multi-query optimization which scales to such large numbers of queries. As part of our theoretical study in [15], we have shown that the problem of multi-query optimization is in general NP-hard. Therefore, in the demonstration we present four different heuristic algorithms for multi-query optimization that all exhibit the desirable scalability property. In a nutshell, our heuristic algorithms attempt to identify common sub-graphs belonging to the optimal plans of individual queries. These common sub-graphs are used as a basis to combine the plans of the individual queries into a single, global, optimal query plan. In the demonstration, we present these four heuristics and for each one of them we also illustrate, in a step-wise fashion, how individual optimal query plans are combined to generate a single global optimal query plan.
m2 SwissProt ()
m3 OMIM (descr. contains ‘breast cancer’) m4
Go (goid =‘GO : 0005096’)
Figure 2: Example Query.
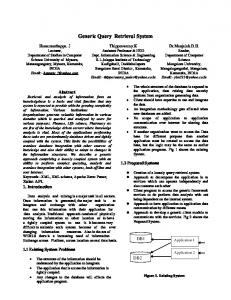
Figure 3: Visual Query Creation tables [14] have been used in practice to record such associations between biological sources. So, in each source, along with its base relation, a set of mapping tables exists, associating its local data to those in remote sources. Figure 1(c) shows a sample mapping table that associates gene identifiers with the identifiers of proteins they encode for. Going back to query Q, how would a biologist express it given our relational setting? Assuming that the biologist knows SQL, she would need to write the following query: select Genbank.gid from Genbank, SwissProt, Go, OMIM, m1 , m2 , m3 , m4 where Genbank.organism = “Human” and Go.goid = “GO:0005096” and OMIM.description like “%breast cancer%” and Go.goid = m4 .goid and m4 .pid = SwissProt.pid and SwissProt.pid = m3 .pid and m3 .mimid = OMIM.mimid and SwissProt.pid = m2 .pid and m2 .gid = Genbank.gid and OMIM.mimid = m1 .mimid and m1 .gid = Genbank.gid
where, m1 to m4 refers to four mapping tables with m1 associating gid’s in Genbank to mimid’s in OMIM; m2 gid’s in Genbank to pid’s in SwissProt; m3 associating pid’s in SwissProt to mimid’s in OMIM; and m4 associating pid’s in SwissProt to goid’s in Go. Clearly, for a non-expert writing such a query is both non-trivial and error-prone. BioScout offers a graphical user interface in which such queries can be visually expressed. To see how this can be achieved, notice that query Q can be represented as a graph. Intuitively, nodes in this graph represent sources that participate in the query. Edges in the graph represent mapping tables used to join the corresponding nodes (sources). Figure 2 shows the query graph for query Q. The node marked by a black circle indicates an output node, i.e., the node generating the query result. In our example, this is the Genbank node. The implemented interface, shown in Figure 3, provides to the scientist the ability to draw a query graph, like the one shown in Figure 2. The scientist is unaware of both the query language syntax and, as we will explain in what follows, the query evaluation plan. On the technical side, our work makes the following contributions. Once a query (graph) is submitted into BioScout,
2.
RELATED WORK
Distributed query processing has taken center stage since the early days of database systems [17] and the interest is still strong in this area [27]. From the huge literature, most related to ours are the works on the optimization of semijoins [3, 4], where the objective is also to minimize communication cost among participating sources. In this line of work, [8] only considers chain queries while we consider the more general class of full-reducer tree queries [30]. For this latter class, a number of optimization algorithms have been proposed [23, among others] but they all focus on single-query optimization, while we also consider multi-query optimization. More recently, Stocket et al. [27] considered generic semi-join optimization techniques. However, the proposed
731
techniques target a particular class of distributed clientserver systems in which clients communicate with servers while servers cannot communicate between themselves. Our work, on the other hand, is complimentary since it considers exactly these settings in which inter-server communication is possible. The difference in the two systems is essential since it influences the optimized query plans considered. Furthermore, we also consider multi-query optimization. From a theoretical standpoint, the problem of optimizing full-reducer tree queries was shown to be NP-hard in [30] w.r.t. a cost-model based on (semi)-join-selectivities. Here, we consider a more conservative cost model motivated by [27], and consider the complexity both for single- and multiquery optimization. In publish-subscribe systems, multi-query optimization was only considered in the context of boolean queries. In NiagaraCQ [7], the plans of multiple queries are grouped together if they have common expression signatures, i.e., their plans have common syntactic characteristics. In the same line of work, Diao et al. [9] group the evaluation of multiple queries by grouping their corresponding NFAs into a single NFA. As such, the focus there is on optimizing query evaluation by exploiting common path expressions among queries. Our work differs from these works since (a) we consider nonboolean queries; and (b) apart from syntactic similarities, our algorithms also take into account the communication cost while computing and merging different plans. In [24], queries (and their plans) are represented as ANDOR DAGs [25] and a family of optimization algorithms is presented to (a) group multiple query DAGs into a single one, by exploiting common query sub-expressions, and (b) determine which common sub-expressions to materialize to reduce the cumulative query evaluation cost (in terms of time). The proposed algorithms are effective for a relatively small number of chain queries and some of the underlying optimization principles there can be found in our work. However, we consider a much larger number of more general queries and focus on minimizing the communication cost. Multi-query optimization is also considered in [28], in the context of sensor networks, but only for aggregation queries, while the techniques in [26] for multi-query optimization are expensive and cannot scale to a large number of queries, as [7] also points out. In scientific databases, SkyQuery [20] offers subscription of queries over a federation of astronomy databases. The SkyQuery optimizer focuses on minimizing communication cost through a simple strategy that uses performance queries and asks each database for its estimate of data for a given query. Then, databases are ordered in decreasing order of selectivity - the one with least data is the first to execute etc. Currently, SkyQuery does not support more complex (nonchain) plans or multi-query optimization. Another prototype, PubCrawler [13] supports query subscription over biological databases. The only optimization available there is that the results of multiple queries are combined so that records common in the answer of several queries are only reported once. However, this occurs only at the reporting stage, after the queries have been executed. In our work, we detect such query overlaps before the actual query execution. In [22], a system is proposed to monitor biological data. The queries are similar to ours but their setting is a centralized one where every source communicates only with a central source. Furthermore, it is not the amount of data transfer
U
Q
s
u
e
e
r
r
I
y
n
P
l
t
a
e
r
f
n
a
c
e
u
B
i
l
d
e
r
r
l
d
e
u
y e
o
L
i
n
k
s
t
o
M
L
a
Q
u
e
r
y
E
v
a
u
l
a
t
o
r
o
t
h
e
r
k
t
r
u
o
p
e
e
r
s
o
S
c
i
o
P
e
e
r
D
B
I
n
t
e
r
f
a
c
t
w
N
e
e
B
L
o
c
D
C
a
a
a
c
e
s
t
h
l
M
a
a
T
e
p
a
p
b
i
l
n
e
g
s
d
S
t
a
t
i
s
t
i
c
s
r
R
u
l
t
s
e
P
e
Figure 4: A BioScout peer source that is minimized but the total number of different database accesses. XSEQM [29] is a monitoring system for sequence data and focuses on alignment queries which are entirely different from our tree queries. Optimization of life science queries in the work of [6] focuses on single queries where the largest set of answers, following alternate paths through the graph connecting the sources, has to be computed at the lowest cost. Data integration systems for the life sciences, like Aladin [19], BioFuice [16], or DiscoveryLink [11] focus on the seamless integration of data from heterogeneous sources and on the optimization of single-queries. As such, they do not consider scalable multi-query optimization like we do.
3.
DEMONSTRATION
The demonstration of BioScout shows (i) how the system can be used by biologists, namely, the visual creation of queries and the consulting of the results of their submitted queries (ii) a visual simulation of the working of the four different heuristic algorithms that compute an optimal plan for a set of queries. The whole system is written in the Java programming language.
3.1
System Architecture
BioScout is a distributed system that currently consists of a relatively small number of peer sources, namely, six peers. Each peer source corresponds to a different scientific (biological, in our case) database (see next section for a description of the characteristics of these databases). Figure 4 shows in more detail the architecture of each peer source which consists of two parts. The first part corresponds to the actual database, where the scientific data, mapping tables, and cached query results are stored. The second part of the peer source, namely, the BioScout-layer consists of five different modules, each responsible for a specific task. The UI-module provides the user with an interface where queries can be submitted graphically while the returned answers to the queries are also shown graphically. After a query is entered, the QueryPlan Builder builds the evaluation plan for the query and merges it with the global plan that evaluates all queries currently submitted to the system. The actual evaluation of queries is handled by the Query Evaluator module which interacts with the Network module and DB Interface module.
3.2
Experimental Data Sets
Figure 5 shows the statistics for the real databases used in our experiments. Specifically, we show the sizes of the
732
Database Size Genbank 11658789 SwissProt 417832 Go 21610 PubMed 329214 Enzyme 4698 OMIM 17850 (a) Database sizes
Mapping Table Size Genbank → Enzyme 79667 OMIM → Genbank 382177 PubMed → Genbank 4449547 Go → SwissProt 499351 SwissProt → Genbank 666700 OMIM → PubMed 109650 (b) Mapping table sizes
Mapping Table LHS ids RHS ids Genbank → Enzyme 17796 2520 OMIM → Genbank 11588 182844 PubMed → Genbank 267903 3841010 Go → SwissProt 9024 143131 SwissProt → Genbank 435734 262542 OMIM → PubMed 13571 87934 (c) Mapping table statistics
Avg. fan-out 4.47 32.98 16.60 55.33 1.53 8.08
Figure 6: Results Page
Figure 5: Database statistics databases along with the sizes of some mapping tables, in terms of number of tuples. Notice that database sizes vary from a few thousands to millions of tuples and the same is true for mapping tables. In the figure, we also show the number of distinct ids in the left and right-hand side attribute of each reported mapping table, along with the average fan-out. These statistics are important since they are used, internally, by our algorithms for the estimation of communication costs. Notice that the tables are not complete, i.e., not all tuples from one database are mapped to those of another. For example, from the eleven million Genbank gid’s, only seventeen thousand are associated with enzymes. Also the fan-out of tables varies widely from values close to one, to values close to 55.
Figure 7: Visual Query Viewer detail, the user is provided with the list of submitted queries. The user selects the subset of queries for which she wants to generate an optimal plan and then she selects the algorithm to use to generate it. Then the system presents a window with the optimal plan. If a user wants to submit a very large batch of queries into the system, using the graphical interface might not be the fastest way. To speed-up the submission of such large batches, we allow the user to specify the query graph using a text-based representation. We consider GraphXML [12] as a suitable candidate to describe our query graphs, due to its simplicity. The following example shows the GraphXML representation of the query graph in Figure 2.
3.3 Demonstrated Functionality The demonstration consists of two parts. The first part handles the creation of queries through the visual interface and the listing of queries and results, while the second part shows the working of four different strategies the optimizer can apply to combine single query plans to a global plan. Figure 3 shows the BioScout query creator interface. The interface is similar to a simple graph editor. It provides the scientist with the ability to draw a query graph and submit this query into the system. A node is created by selecting a source and specifying the desired selection conditions. Figure 3 shows the creation of an OMIM node with the condition that the mimid must be GO:0005096. Linking sources through mapping tables is done by clicking and then dragging from one node to the other node. During the demo, we show how nodes are created and modified, edges can be added and deleted, and how the output node can be selected or changed. All registered queries are evaluated periodically. When new results our found for a query, the owner is notified. The new and past results of queries can be consulted in the query results page. An example of such a page is shown in Figure 6. It list all the queries submitted by the user and their results grouped by date. Our system also offers a query viewer, shown in Figure 7. The query viewer allows the user to review/edit queries that already have been submitted into the system. A user can simply select a query identifier and a window appears that shows (a) the query graph for the selected query and (b) the optimal plan for evaluating this query. The interface also provides the ability to generate an optimal plan for any subset of queries that is submitted into the system. In more
gid =out,organism=“Homo sapiens” descr. contains “breast cancer” goid =“GO:0005096”
The user can submit a file containing the description of all the queries in the batch. Once the queries are submitted, they can be viewed/edited through the interface, as if they have been submitted graphically. As discussed in Section 1 we have developed four algorithms that, given a set of queries, leverage pre-computed optimal plans of single queries and combine them to compute a global plan for the whole query set. The approaches range from a purely structural algorithm that intelligently merges all similar (sub-)queries (e.g., a query occurs as a
733
In EDBT, p. 811–828, 2006. [7] J. Chen, D. J. DeWitt, F. Tian, and Y. Wang. Niagaracq: A scalable continuous query system for internet databases. In SIGMOD, p. 379–390, 2000. [8] D. Chiu, P. A. Bernstein, and Y.-C. Ho. Optimizing chain queries in a distributed database system. SIAM J. Comput., 13(1):116–134, 1984. [9] Y. Diao et al. Path sharing and predicate evaluation for high-performance xml filtering. TODS, 28(4):467–516, 2003. [10] J. Gray. Where the rubber meets the sky: The semantic gap between data producers and data consumers. In SSDBM, page 3, 2004. [11] L. M. Haas et al.Discoverylink: A system for integrated access to life sciences data sources. IBM Systems Journal, 40(2):489–511, 2001. [12] I. Herman and M. S. Marshall. GraphXML - An XML-Based Graph Description Format In Graph Drawing, p. 52–62, 2000. [13] K. Hokamp and K. Wolfe. What’s new in the library? What’s new in GenBank? Let PubCrawler tell you. Trends in Genetics, 15(11):471–472, 1999. [14] A. Kementsietsidis, M. Arenas, and R. Miller. Mapping data in peer-to-peer systems: Semantics and algorithmic issues. In SIGMOD, p. 325–336, 2003. [15] A. Kementsietsidis, F. Neven, and D. Van de Craen. Scalable Distributed-query Optimization in Scientific Environments. Submitted for publication, 2007. [16] T. Kirsten and E. Rahm. BioFuice: mapping-based data integration in bioinformatics. In DILS, p. 124–135, 2006. [17] D. Kossmann. The state of the art in distributed query processing. ACM Comput. Surv., 32(4):422–469, 2000. [18] C. Lee, C. Grasso, and M. F. Sharlow. Multiple sequence alignment using partial order graphs. Bioinformatics, 18(3):452–464, 2002. [19] U. Leser and F. Naumann. (Almost) Hands-Off Information Integration for the Life Sciences. In CIDR, p. 131–143, 2005. [20] T. Malik, A. S. Szalay, T. Budavari, and A. Thakar. Skyquery: A web service approach to federate databases. In CIDR, 2003. [21] D. Mount. Bioinformatics: Sequence and Genome Analysis. Cold Spring Harbor Laboratory Press, 2001. [22] F. Neven and D. Van de Craen. Optimizing monitoring queries over distributed data. In EDBT, p. 829–846, 2006. [23] S. Pramanik and D. Vineyard. Optimizing join queries in distributed databases. IEEE Trans. Software Eng., 14(9):1319–1326, 1988. [24] P. Roy, S. Seshadri, S. Sudarshan, and S. Bhobe. Efficient and extensible algorithms for multi query optimization. In SIGMOD, p. 249–260, 2000.
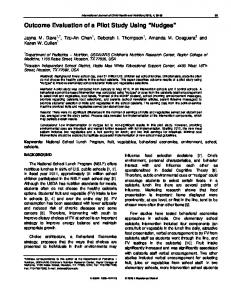
Figure 8: Global query evaluation plan subquery of another query), to a complex alignment algorithm that uses the semantics of selection atoms to compute a score for the alignment. In our system, we visually show for each of the algorithms how they build up the global plan starting from the same set of query plans. As an example, Figure 8 shows a possible alignment of a single-query plan with an existing global plan. An edge from a node nQ in the single-query plan to a node nG in the global plan (shown in red) indicates that node nQ will be mapped to node nG in the global plan. Therefore, each node in the global plan represents a set of single-query plan nodes (all referring to the same source). There are two types of edges in the global plan, namely, edges between nodes that refer to different sources (shown in black) and edges between nodes that refer to the same source (shown in grey). The black edges represent the combined transfer of data. For example consider the SwissProt node nSwissProt in the global plan to which G the SwissProt node in the single-query plan is mapped. The node has, among others, an edge to the OMIM node at the next level. During the evaluation of the global plan, all the results of all the single-query SwissProt nodes mapped to nSwissProt that need to be send to the OMIM source will be G combined before transmission to OMIM. We note that a result that might be necessary for the evaluation of multiple single-queries will be sent only once, resulting in savings in transmission costs. Also, note that as the OMIM node in the query plan is mapped to a node that is processed later during the evaluation, the result of the SwissProt node in the query plan must be propagated to this node. The process of propagating results between nodes that refer to the same source is represented by the grey edges.
[25] N. Roussopoulos. View indexing in relational databases. TODS, 7(2):258–290, 1982. [26] T. Sellis. Multiple query optimization. TODS, 13(1):23–52, 1988. [27] K. Stocker, D. Kossmann, R. Braumandl, and A. Kemper. Integrating semi-join-reducers into state of the art query processors. In ICDE , p. 575–584, 2001. [28] N. Trigoni, Y. Yao, A. J. Demers, J. Gehrke, and R. Rajaraman. Multi-query optimization for sensor networks. In DCOSS, p. 307–321, 2005. [29] D. Van de Craen, F. Neven, and K. Koch. An extensible light-weight xml-based monitoring system for sequence databases. In DILS, p. 280–296, 2006. [30] C. Wang and M. Chen. On the complexity of distributed query optimization. IEEE Trans. on Knowledge and Data Engineering, 8(4):650–662, 1996.
4. REFERENCES [1] M. Ashburner et al. Gene Ontology: tool for the unification of biology. Nature Genetics, 25(1):25–29, 2000. [2] A. Bairoch and R. Apweiler. The SWISS-PROT protein sequence data bank and its new supplement TREMBL. Nucleic Acids Research, 24(1):21–25, 1996. [3] P. A. Bernstein and Dah-Ming W. Chiu. Using semi-joins to solve relational queries. J. ACM, 28(1):25–40, 1981. [4] P. A. Bernstein, et al. Query processing in a system for distributed databases (SDD-1). TODS, 6(4):602–625, 1981. [5] H.S. Bilofsky et al. The GenBank Genetic Sequence Databank. Nucleic Acids Research, 14:1–4, 1986. [6] J. Bleiholder, S. Khuller, F. Naumann, L. Raschid, and Y. Wu. Query planning in the presence of overlapping sources.
734