BioSystems 97 (2009) 134–139
Contents lists available at ScienceDirect
BioSystems journal homepage: www.elsevier.com/locate/biosystems
Logical modelling of regulatory networks with GINsim 2.3 A. Naldi a , D. Berenguier a , A. Fauré a , F. Lopez a , D. Thieffry a,b,∗ , C. Chaouiya a,c,∗ a
TAGC - INSERM U928 - Université de la Méditerranée, Campus de Luminy, Case 929, F-13288 Marseille Cedex 9, France CONTRAINTES project, INRIA Paris-Rocquencourt, Domaine de Voluceau, Rocquencourt, BP 105, 78153 Le Chesnay, France c Instituto Gulbenkian de Ciência, Rua da Quinta Grande, P-2780-156 Oeiras, Portugal b
a r t i c l e
i n f o
Article history: Received 9 February 2009 Received in revised form 22 April 2009 Accepted 25 April 2009 Keywords: Regulatory networks Logical modelling Dynamical simulation Computational systems biology
a b s t r a c t Many important problems in cell biology require the consideration of dense nonlinear interactions between functional modules. The requirement of computer simulation for the understanding of cellular processes is now widely accepted, and a variety of modelling frameworks have been designed to meet this need. Here, we present a novel public release of the Gene Interaction Network simulation suite (GINsim), a software designed for the qualitative modelling and analysis of regulatory networks. The main functionalities of GINsim are illustrated through the analysis of a logical model for the core network controlling the fission yeast cell cycle. The last public release of GINsim (version 2.3), as well as development versions, can be downloaded from the dedicated website (http://gin.univ-mrs.fr/GINsim/), which further includes a model library, along with detailed tutorial and user manual. © 2009 Elsevier Ireland Ltd. All rights reserved.
1. Introduction Discrete (logical) formal methods provide a suitable framework to integrate heterogeneous molecular data into rigorous dynamical models, which can be used as a basis for the development of more quantitative models (e.g. using differential or stochastic equations). During the last decade, logical modelling has been applied to various types of biological regulatory systems, including flower morphogenesis (Mendoza et al., 1999), Drosophila embryonic development (González et al., 2008; Sánchez et al., 2008; Chaves et al., 2005), cell cycle control (Fauré et al., 2006; Sahin et al., 2009; Irons, 2009; Abou-Jaoudé et al., 2009), immune responses (Stark et al., 2007 and references therein), in particular T lymphocyte activation and differentiation (Mendoza, 2006; Saez-Rodriguez et al., 2007). In brief, the logical approach considered here involves the delineation of: • the crucial regulatory components and their different ranges of activity; • the main interactions and associated activity ranges; • the logical rules directing the activity of each network component, depending on incoming interactions; • the relevant time constraints underlying specific dynamical behaviours.
The dynamics of such models are naturally described by state transition graphs. Further details on this logical formalism can be found in Thomas et al. (1995) and Chaouiya et al. (2003). Although generally considered sound and well adapted to the qualitative modelling of complex biological regulatory networks, this approach is still scarcely used by biologists because of the lack of accessible and efficient computational tools. The development of the Gene Interaction Network simulation suite (GINsim) aims at filling this gap by providing a user-friendly logical modelling software, based on the intuitive notion of regulatory graph. GINsim encompasses three main components: • a graphical user interface; • a simulation core (construction of state transition graphs); • a graph analysis toolbox. Developed in Java, GINsim is based on public graph libraries, JGraph and JGraphT, and is designed in a modular way to ease extensions and collaborative developments. A previous paper presented an earlier version of the software (González et al., 2006). Since then, GINsim has considerably evolved and this software application note aims at describing the most notable characteristics of the new public release, GINsim 2.3. For a more detailed presentation, we refer to the tutorial or to the user manual, both available along with the current stable and development versions of GINsim. 2. Logical Model Definition
∗ Corresponding authors. E-mail addresses:
[email protected] (D. Thieffry),
[email protected] (C. Chaouiya). 0303-2647/$ – see front matter © 2009 Elsevier Ireland Ltd. All rights reserved. doi:10.1016/j.biosystems.2009.04.008
The GINsim main window comprises the usual file management, edition and visualisation tools. Clickable icons and menus provide
A. Naldi et al. / BioSystems 97 (2009) 134–139
a friendly access to the functionalities enabling the definition of a regulatory graph (node and arrow drawing, cutting and pasting, etc.). Part of these functionalities is similar to those of most simple drawing tools. For each node of a regulatory graph, the user specifies the range of discrete activity levels (the associated variable takes its values in this range) and the logical parameters (defining the target levels of activity related to sets of incoming interactions). By default, logical parameters and variables are considered Booleans, but can be progressively refined by the modeller as his understanding of the logical formalism and of the properties of the model under development increases. Logical parameters are easily defined by selecting interactions and associating them with discrete values. For each interaction, an interval specifies the range of values for which this interaction is operating (by default, the interval is set to the whole range of activity of the source node, except zero). Graphical settings of nodes and interactions can be modified. GINsim also provides means to store textual information supporting a given model, either at the level of the whole regulatory graph, or at the level of each of its elements (nodes or interactions). Models are stored in a specific XML file format, GINML, but can also be exported into various formats, including PNG (image), SVG,
135
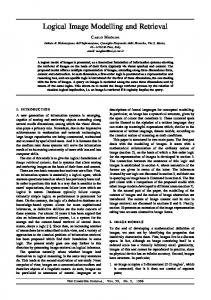
Graphviz and BioLayout (graphs), as well as Cytoscape (xgmml) formats. Thanks to the many plugins available for Cytoscape (e.g. BiNoM, which handles CellDesigner, BioPAX and SBML formats (Zinovyev et al., 2008)), regulatory and state transition graphs defined with GINsim can now be converted into virtually any relevant format, thereby enabling the combination of various software tools with complementary functionalities. Finally, this novel public release encompasses the export of logical models towards Petri nets, following the procedure described by Chaouiya et al. (2008). Fig. 1 shows an example of a regulatory graph corresponding to the core oscillator controlling the fission yeast cell cycle, derived from the Boolean model published by Davidich and Bornholdt (2008). The two Boolean components representing the different levels of activity of Cdc2/Cdc13 have been replaced by a unique ternary component. In addition, the loops originally placed on Start, SK, PP, and Slp1 nodes have been removed, as they do not represent true auto-regulations. Finally, the logical rules governing the behaviours of these components have been reformulated to fit Thomas’ framework (Thomas et al., 1995; Chaouiya et al., 2003)(for a complete listing of these rules, see the corresponding entry in the model repository).
Fig. 1. Main GINsim window displaying the regulatory graph for the fission yeast cell-cycle control as derived from Davidich and Bornholdt (2008). The lower panel shows the parameters attached to the selected node (Cdc2 13): maximal level (here 2), basal value (0), five incoming interactions (bottom right), and the logical parameters (bottom center), i.e. target values for combinations of incoming interactions (those which are not listed lead, by default, to value 0).
136
A. Naldi et al. / BioSystems 97 (2009) 134–139
Fig. 2. GINsim windows showing a State Transition Graph (STG, cf. right panel) resulting from a simulation of the model of Fig. 1 using priority classes (lower priorities for the decreases of Start, SK, Slp1 and PP). A path can be interactively selected in the STG and the active nodes of the model are coloured according to the selected state (left panel).
3. Simulation and Analysis On the basis of the definition of a regulatory graph and of the associated logical parameters, GINsim computes the temporal evolution of the system, which is represented in terms of a State Transition Graph (STG). In this graph, each node represents a state (giving the discrete level of each regulatory component), and arrows represent spontaneous transitions (see the sample of simulation results provided in Fig. 2). Briefly, performing a simulation implies: • the definition of a single initial state, or set of initial states, through the specification of initial value(s) for each variable; • the selection of an updating assumption: the classical synchronous or asynchronous modes, or yet mixed modes, relying on the definition of priority classes (Fauré et al., 2006); • the selection of perturbations (mutant conditions), defined as the blocking of the values of a (set of) variable(s) within a restricted interval (e.g. the definition of a gene knockdown amounts to block its level to zero); • optionally, the specification of a maximal depth or graph size, or yet of a graph construction strategy (depth or breadth first). It is possible to define a series of simulation settings (initial conditions, perturbations, updating policies) and store them together with the model. More precisely, GINsim creates a compressed archive containing both the model and the simulation settings. Once a STG has been computed, the user can select a relevant trajectory and export it into a gnuplot file that enables the generation of time plots. Moreover, graph tools are available to analyse and inspect STGs (cf. Fig. 3).
Since logical models and simulations rely on graph definitions implemented using standard Java graph libraries, existing graph analysis libraries or original algorithms can be easily integrated in GINsim, taking advantage of its modular architecture. In this respect, the current release encompasses tools to: • identify stable states (terminal nodes in the STG), which can be displayed in a separated panel; • compute the strongly connected components of regulatory graphs or of STGs, which can then be displayed and further analysed; • search paths (shortest path between user-defined states); • visualise state transitions interactively, either within a STG or on the underlying regulatory graph; an automatic colouring of nodes and arrows facilitates stepwise explorations of network dynamics, as well as their recording and further automatic display. The computation, let-alone the visualisation, of STGs is often intractable, as their sizes grow exponentially with the number of model components. In this respect, GINsim 2.3 enables an efficient computation of all stable states, without constructing the STG (Naldi et al., 2007). The application of this method to the model presented in Fig. 1 leads to the identification of a single stable state, corresponding to the G1 state found by Davidich and Bornholdt, with only Ste9, Rum1 and Wee1/Mick1 activated. This means that the other 11 spurious stable states obtained by these authors have been eliminated. Using a synchronous updating, sustained activation of Start leads to SK activation and then to inhibition of Ste9 and Rum1, launching a sequence of state transitions matching that defined by Davidich and Bornholdt, as well as available kinetic data (see Model Documentation for more details about the configuration of the logical
A. Naldi et al. / BioSystems 97 (2009) 134–139
137
Fig. 3. Graph of the Strongly Connected Components (SCCs) of a STG obtained in the same conditions used for Fig. 2 but considering an additional initial state where Slp1 is also present (the initial state considered in Fig. 2 is greyed out). This graph provides a more compact representation of the complex dynamics by hiding oscillations. In such graphs, attractors (stable states or complex attractors) appear as terminal nodes. Here, the 57 states STG of Fig. 2 has a single complex attractor encompassing 56 states (listed in the lower panel). The additional initial state leads to the same attractor, through some transient states.
simulation). If the Start component is permanently activated, the model gives rise to sustained oscillations. At this point, the logical approach further enables a systematic analysis of the dynamical roles of the regulatory circuits embedded in the network, depending on the values of input nodes (Thomas et al., 1995). GINsim 2.3 implements algorithms enabling the decomposition of complex regulatory networks into elementary circuits, as well as the analysis of their functionality contexts (see Naldi et al., 2007 for details on the method). Turning back to the model presented in Fig. 1, these algorithms lead to the identification of nine regulatory circuits. As shown in Fig. 4, the feedback circuit analysis emphasizes the dynamical roles of four of these circuits (each involving two components): • a negative circuit: Cdc2 13/Slp1; • three positive circuits: Cdc2 13/Rum1, Cdc2 13/Cdc25.
Cdc2 13/Ste9,
and
From a dynamical point of view, the negative circuit enables the generation of oscillations, whereas the positive circuits may contribute to amplify them and to ensure irreversibility of transitions between cell phases. In GINsim, for each circuit, the analysis of its functionality further computes its sign together with the constraints on the values
of the components acting on this circuit that enable the corresponding dynamical property. For example, the negative circuit is functional only in the absence of both Ste9 and Rum1. In other words, in the presence of one of these factors, the system cannot exhibit sustained oscillations. This would be the case, for example, in a mutant with constitutive activity of one of these factors. Finally, GINsim 2.3 provides straightforward means to simulate various kinds of mutants or perturbations and to check their dynamical effects. For example, Fig. 5 illustrates the definition of a mutant with constitutive Ste9 activity. For initial conditions with both Start and Ste9 blocked at value 1, the STG is devoid of any cycle. The simulation of a mutant with constitutive Rum1 activity leads to a similar result. 4. Discussion and Prospects GINsim provides an intuitive and versatile environment to define qualitative models for biological regulatory networks and to probe their dynamical properties. In summary, the new release presented here provides improved user interfaces and performances for both model definition and analyses. It implements new exports facilities, a simulation mode using priority classes and the possibility to store simulation parameters as well as mutant specifications
138
A. Naldi et al. / BioSystems 97 (2009) 134–139
Fig. 4. The circuit functionality tool enables the search of all elementary circuits matching some criteria (length, components, cf. dialog box on the left) in a model. The functionality contexts of the corresponding circuits are then computed, enabling the classification of circuits as positive and negative. The application of this tool to the model of Fig. 1 identified 9 circuits, among which 4 are found functional (cf. right panel), the functionality context of the selected circuit is displayed at the bottom.
along with a model. Original algorithms have been implemented to identify all potential stable states and to analyse regulatory circuit functionality. As the use of the logical modelling spreads into the systems biology community, various softwares become available, e.g. DDLab (Wuensche, 1998), CellNetAnalyzer (Klamt et al., 2007), SQUAD
(Cara et al., 2007), ChemChains (Helikar et al., 2008), BooleanNet (Albert et al., 2008). In this context, the main assets of GINsim are the support of multilevel modelling and of various updating schemes (synchronous and asynchronous modes, as well as mixed or intermediate modes) and, above all, an original and powerful regulatory circuit analysis tool.
Fig. 5. GINsim enables the definition of simple or multiple perturbations (mutants) along with a model. Such perturbations are defined using the dialog box shown on the left. The left part of the dialog box lists the defined perturbations, while the right part enables the edition of the selected one, here a constitutive expression of Ste9. The window on the left shows the STG obtained with this perturbation, all other parameters (updating, initial state) being the same as in Fig. 2.
A. Naldi et al. / BioSystems 97 (2009) 134–139
Unlike DDLab (Wuensche, 1998), GINsim does not handle Random Boolean Networks, but rather parametrised multi-level models, generally analysed under an asynchronous updating. Hence, statistics on the attractors and their bassins of attraction would rely on distinct data in our context. To quantify the trajectories leading to given attractors, we are currently considering the implementation of a compact, hierarchical, representation of state transition graphs, which should greatly ease such analyses. It is worth noting that GINsim is constantly updated as new requirements emerge and novel algorithms are defined. Current developments mainly aim at easing the definition and analysis of larger models, including: • • • • •
a parser to support more compact logical rules; model composition tools; model reduction by “hiding” components; automation of graph comparison and merging; additional import and export facilities, to enable model exchanges with tools such as Gene Network Analyser (GNA) (de Jong et al., 2003), model checkers (NuMSV), or yet logical and constraints programming environments; • compact representation of the dynamics, enabling to identify parts of the phase space leading to each attractors; • scripting facilities allowing to define and launch series of simulations. The issue of model export is particularly relevant for the modeller willing to apply the logical framework as an initial step to build more quantitative models. However, the reference Systems Biology Modelling Language (SBML) does not yet offer a straightforward format to encode qualitative models. To solve this problem, we are presently engaged in an international collaborative effort aiming at defining an extension dedicated to qualitative models in the context of the development of SBML Level 3. Acknowledgements A.N. has been supported by PhD grant from the French Ministry of Research and Technology. This project was further supported by research grants from the EU FP6 (DIAMONDS STREP) and FP7 (APOSYS large scale project) programs, and by the Belgian Science Policy Office (IAP BioMaGNet). References Abou-Jaoudé, W., Ouattara, D.A., Kaufman, M., 2009. From structure to dynamics: frequency tuning in the p53-mdm2 network I. Logical approach. J. Theor. Biol. 258, 561–577.
139
Albert, I., Thakar, J., Li, S., Zhang, R., Albert, R., 2008. Boolean network simulations for life scientists. Source Code Biol. Med. 3, 16. Cara, A.D., Garg, A., Micheli, G.D., Xenarios, I., Mendoza, L., 2007. Dynamic simulation of regulatory networks using squad. BMC Bioinform. 8, 462. Chaouiya, C., Remy, E., Mossé, B., Thieffry, D., 2003. Qualitative analysis of regulatory graphs: a computational tool based on a discrete formal framework. Lect. Notes Control Inform. Sci. (LNCIS) 294, 119–126. Chaouiya, C., Remy, E., Thieffry, D., 2008. Petri net modelling of biological regulatory networks. J. Discrete Algorithms 6, 165–177. Chaves, M., Albert, R., Sontag, E.D., 2005. Robustness and fragility of boolean models for genetic regulatory networks. J. Theor. Biol. 235, 431–449. Davidich, M., Bornholdt, S., 2008. Boolean network model predicts cell cycle sequence of fission yeast. PLoS ONE 3, e1672. de Jong, H., Geiselmann, J., Hernandez, C., Page, M., 2003. Genetic network analyzer: qualitative simulation of genetic regulatory networks. Bioinformatics 19, 336–344. Fauré, A., Naldi, A., Chaouiya, C., Thieffry, D., 2006. Dynamical analysis of a generic boolean model for the control of the mammalian cell cycle. Bioinformatics 22, 124–131. González, A., Chaouiya, C., Thieffry, D., 2006. Dynamical analysis of the regulatory network defining the dorsal-ventral boundary of the drosophila wing imaginal disk. Genetics 174, 1625–1634. González, A., Chaouiya, C., Thieffry, D., 2008. Logical modelling of the role of the hh pathway in the patterning of the drosophila wing disc. Bioinformatics 24, i234–i240. Helikar, T., Konvalina, J., Heidel, J., Rogers, J.A., 2008. Emergent decision-making in biological signal transduction networks. Proc. Natl. Acad. Sci. U.S.A. 105, 1913–1918. Irons, D.J., 2009. Logical analysis of the budding yeast cell cycle. J. Theor. Biol. 257 (4), 543–559. Klamt, S., Saez-Rodriguez, J., Gilles, E.D., 2007. Structural and functional analysis of cellular networks with CellNetAnalyser. BMC Syst. Biol. 1, 2. Mendoza, L., 2006. A network model for the control of the differentiation process in Th cells. Biosystems 84, 101–114. Mendoza, L., Thieffry, D., Alvarez-Buylla, E., 1999. Genetic control of flower morphogenesis in arabidopsis thaliana: a logical analysis. Bioinformatics 15, 593–606. Naldi, A., Thieffry, D., Chaouiya, C., 2007. Decision diagrams for the representation of logical models of regulatory networks. Lecture Notes Comput. Sci. (LNCS) 4695, 233–247. Saez-Rodriguez, J., Simeoni, L., Lindquist, J.A., Hemenway, R., Bommhardt, U., Arndt, B., Haus, U.-U., Weismantel, R., Gilles, E.D., Klamt, S., Schraven, B., 2007. A logical model provides insights into T cell receptor signaling. PLoS Comput. Biol. 3, e163. Sahin, O., Fröhlich, H., Löbke, C., Korf, U., Burmester, S., Majety, M., Mattern, J., Schupp, I., Chaouiya, C., Thieffry, D., Poustka, A., Wiemann, S., Beissbarth, T., Arlt, D., 2009. Modeling ERBB receptor-regulated G1/S transition to find novel targets for de novo trastuzumab resistance. BMC Syst. Biol. 3, 1. Sánchez, L., Chaouiya, C., Thieffry, D., 2008. Segmenting the fly embryo: logical analysis of the role of the segment polarity cross-regulatory module. Int. J. Dev. Biol. 52, 1059–1075. Stark, J., Chan, C., George, A.J.T., 2007. Oscillations in the immune system. Immunol. Rev. 216, 213–231. Thomas, R., Thieffry, D., Kaufman, M., 1995. Dynamical behaviour of biological regulatory networks-i. biological role of feedback loops and practical use of the concept of the loop-characteristic state. Bull. Math. Biol. 57, 247–276. Wuensche, A., 1998. Genomic regulation modeled as a network with basins of attraction. Pac. Symp. Biocomput., 89–102. Zinovyev, A., Viara, E., Calzone, L., Barillot, E., 2008. Binom: a Cytoscape plugin for manipulating and analyzing biological networks. Bioinformatics 24, 876–877.