0021-972X/07/$15.00/0 Printed in U.S.A.
The Journal of Clinical Endocrinology & Metabolism 92(8):2960 –2964 Copyright © 2007 by The Endocrine Society doi: 10.1210/jc.2007-0434
Blood Glucose Control by a Model Predictive Control Algorithm with Variable Sampling Rate Versus a Routine Glucose Management Protocol in Cardiac Surgery Patients: A Randomized Controlled Trial Roman Hovorka, Jaromir Kremen, Jan Blaha, Michal Matias, Katerina Anderlova, Lenka Bosanska, Tomas Roubicek, Malgorzata E. Wilinska, Ludovic J. Chassin, Stepan Svacina, and Martin Haluzik Department of Paediatrics (R.H., M.E.W., L.J.C.), University of Cambridge, Cambridge CB2 1TT, United Kingdom; and 3rd Department of Medicine (J.K., K.A., L.B., T.R., S.S., M.H.), Department of Anesthesia (J.B., M.M.), Resuscitation and Intensive Medicine, 1st Faculty of Medicine, Charles University and General University Hospital, 128 08, Prague 2, Czech Republic Context: Elevated blood glucose levels occur frequently in the critically ill. Tight glucose control by intensive insulin treatment markedly improves clinical outcome.
ized for eMPC and 30 for RMP treatment. Blood glucose was measured in 1- to 4-h intervals as requested by each algorithm during surgery and postoperatively over 24 h.
Objective and Design: This is a randomized controlled trial comparing blood glucose control by a laptop-based model predictive control algorithm with a variable sampling rate [enhanced model predictive control (eMPC); version 1.04.03] against a routine glucose management protocol (RMP) during the peri- and postoperative periods.
Main Outcome Measures: Mean blood glucose, percentage of time in target range, and hypoglycemia events were used.
Setting: The study was performed at the Department of Cardiac Surgery, University Hospital. Patients: A total of 60 elective cardiac surgery patients were included in the study. Interventions: Elective cardiac surgery and treatment with continuous insulin infusion (eMPC) or continuous insulin infusion combined with iv insulin boluses (RMP) to maintain euglycemia (target range 4.4 – 6.1 mmol/liter) were performed. There were 30 patients random-
E
LEVATED BLOOD GLUCOSE levels are commonly observed in the critically ill (1–3). This phenomenon denoted “diabetes of injury” presents indiscriminately in diabetic and nondiabetic critically ill patients, and has distinct pathophysiology from type 1 or 2 diabetes (4). The main cause of hyperglycemia in the critically ill is the release of counterregulatory stress hormones (catecholamines, cortisol, glucagon, GH) and proinflammatory cytokines that interfere with the insulin signaling cascade at the postreceptor level (5, 6). Hyperglycemia in critically ill patients has many undesirable effects, such as increased oxidative stress (7–9), increased infectious complications (10), impaired cardiovascular function (11, 12), prothrombogenic effect, endothelial dysfunction (13–15), ischemic renal injury, and others (16). First Published Online June 5, 2007 Abbreviations: BMI, Body mass index; eMPC, enhanced model predictive control; ICU, intensive care unit; MPC, model predictive control; RMP, routine glucose management protocol. JCEM is published monthly by The Endocrine Society (http://www. endo-society.org), the foremost professional society serving the endocrine community.
Results: Mean blood glucose was 6.2 ⫾ 1.1 mmol/liter in the eMPC vs. 7.2 ⫾ 1.1 mmol/liter in the RMP group (P ⬍ 0.05); percentage of time in the target range was 60.4 ⫾ 22.8% for the eMPC vs. 27.5 ⫾ 16.2% for the RMP group (P ⬍ 0.05). No severe hypoglycemia (blood glucose ⬍ 2.9 mmol/liter) occurred during the study. Mean insulin infusion rate was 4.7 ⫾ 3.3 IU/h in the eMPC vs. 2.6 ⫾ 1.7 IU/h in the RMP group (P ⬍ 0.05). Mean sampling interval was 1.5 ⫾ 0.3 h in the eMPC vs. 2.1 ⫾ 0.2 h in the RMP group (P ⬍ 0.05). Conclusions: Compared with RMP, the eMPC algorithm was more effective and comparably safe in maintaining euglycemia in cardiac surgery patients. (J Clin Endocrinol Metab 92: 2960 –2964, 2007)
Numerous clinical studies have demonstrated that tight glycemic control by intensive insulin therapy improves clinical outcome by decreasing the risk of complications in critically ill patients (17). In a prospective randomized trial in Leuven, post-cardiac surgery patients were treated either by a conventional or intensive insulin regimen (18). Tight glucose control (4.4 – 6.1 mmol/liter) reduced in-hospital mortality and decreased organ system dysfunction compared with the conventional group that had moderate hyperglycemia (6.1–11.1 mmol/liter). In a mixed adult medicalsurgical population, the implementation of an intensive glucose management protocol decreased mortality, morbidity, and the length of intensive care unit (ICU) stay (19). Another study performed in Leuven at the medical ICU failed to show significant influence of glucose control on overall mortality. However, morbidity was significantly reduced by the prevention of newly acquired kidney injury, accelerated weaning from the mechanical ventilation, and accelerated discharge from the ICU and hospital (20). Large-scale clinical studies together with other indicative data demonstrated tight glucose control to be an important
2960
Hovorka et al. • ICU Glucose Control by Computer Algorithm
J Clin Endocrinol Metab, August 2007, 92(8):2960 –2964
prerequisite of improved survival and reduced morbidity in the critically ill. However, tight glucose control is not easy to achieve. It is based on the combination of a continuous iv insulin infusion and frequent blood glucose measurements, potentially increasing the workload of the nursing staff. Importantly, tight glucose control significantly increases the risk of hypoglycemia, potentially harming the patients. Therefore, the implementation of tight glucose control in the ICU requires not only safe and efficacious glucose management protocols but also appropriate education of health care professionals. Numerous glucose management protocols have been developed to achieve tight glycemic control, including computer-based algorithms (21–25). Within the European Commission Closed Loop Insulin Infusion in Critically Ill Patients project, which aims to develop an automated system for blood glucose control in critically ill patients, we developed a computer algorithm for tight glucose control [model predictive control (MPC)] and compared it with standard glucose management protocols in three different European cardiovascular centers (26). Our study demonstrated that the MPC algorithm (version 1.01.05; Dr. Roman Hovorka, Department of Pediatrics, University of Cambridge, Cambridge, UK) was safe and effective to maintain tight glucose control. The major disadvantage of the original algorithm was the need for hourly blood glucose measurements. In the present study, we performed a randomized study to compare an updated version of the algorithm with variable sam-
2961
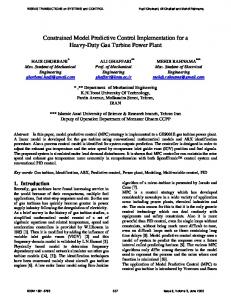
pling [enhanced model predictive control (eMPC); version 1.04.03; Dr. Roman Hovorka, Department of Pediatrics, University of Cambridge, Cambridge, UK) and the standard protocol at the postoperative cardiac surgery ICU, Department of Cardiac Surgery, General University Hospital, Prague. Subjects and Methods Study design and subjects The study was designed as a single-center nonblinded randomized trial. A total of 60 adult patients [43 men and 17 women; mean age 68 ⫾ 10 yr; mean body mass index (BMI) 27.2 ⫾ 4.6 kg/m2; 27 patients with type 2 diabetes mellitus) admitted for major elective cardiac surgery (51 patients with aortocoronary bypass, nine with valvular plastic) participated in the study. There were 30 patients randomized for treatment by the computer algorithm with variable sampling (eMPC) and 30 using the standard glucose management protocol developed at the Department of Cardiovascular Surgery, General University Hospital, Prague (Fig. 1). A total of 13 patients from the eMPC and 14 from the standard protocol group had a history of diabetes; on admission, six of 13 patients in the eMPC group and seven of 14 patients in the standard group were treated by peroral antidiabetic drugs (glimepiride, metformin, or both). The remaining patients with diabetes were treated by insulin. The mean duration of the surgery was 5.6 ⫾ 1.3 h. Characteristics of both groups are shown in Table 1. The study consisted of two parts: a screening visit performed 1 d before the surgery, and a treatment visit that coincided with the start of surgery and continued for up to 24 h at the ICU. A written informed consent was signed by all participants before being enrolled in the study. The study was approved by the Human Ethical Review Committee, 1st Faculty of Medicine and General University Hospital, Prague, Czech
BASIC STARTING DOSAGE: Blood glucose
Bolus iv. insulin (IU)
Starting insulin infusion rate (ml/h)
6.5 – 7.9
0
1
8 – 9.9
5
1
10 – 12.9
7
2
13 – 15.9
10
3
16 – 19.9
13
4
20 or more
15
5
2 hours after start of insulin infusion check glucose; if:
FIG. 1. The standard glucose management algorithm.
Blood glucose
INTERVENTION
Check glycemia in 1 hour
Stop insulin, give G40% 40 ml iv.- call for ICU doctor! Insulin at 1 ml/h with glycemia over 6mmol/l 3.6 – 4.5 Stop insulin and call ICU doctor! 1 hour 4.6 – 5.0 Decrease by 1 ml/h 2 hour Keep the same rate, if glycemia is stable in the 2 following 2 hour 5.1 – 5.9 measurements, the next glucose level could be checked in 4 hours 6.0 – 6.9 Increase rate by 0,5 ml/h 2 hour 7.0 – 7.9 Increase rate by 1 ml/h 2 hour 8.0 – 9.9 Increase rate by 2 ml/h 2 hour 10.0 –12.9 Bolus 5 IU, increase rate by 3 ml/h 1 hour 13.0 –15.9 Bolus 5 IU, increase rate by 4 ml/h 1 hour 16.0 –19.9 Bolus 10 IU, increase rate by 5 ml/h 1 hour >20.0 Bolus 15 IU, increase rate by 5 ml/h 1 hour If blood glucose drops by more than 8 mmol/l between 2 adjacent measurements decrease rate by half and call the ICU doctor < 3.5
2962
J Clin Endocrinol Metab, August 2007, 92(8):2960 –2964
Hovorka et al. • ICU Glucose Control by Computer Algorithm
TABLE 1. The clinical characteristics of patients participating in the study
No. of patients Age (yr) BMI (kg/m2) Duration of surgery (h) No. of subjects with diabetes Baseline blood glucose (mmol/liter)
eMPC
Standard
30 67 ⫾ 11 27.1 ⫾ 4.7 5.2 ⫾ 1.1 13 6.98 ⫾ 2.79
30 69 ⫾ 9 27.3 ⫾ 4.7 5.9 ⫾ 1.4 14 7.01 ⫾ 2.43
Unless stated otherwise, values are the mean ⫾ SD. No significant differences between the groups were found among parameters. Republic, and was performed in accordance with the guidelines proposed in the Declaration of Helsinki. Exclusion criteria were defined as: insulin allergy, mental incapacity, and language barrier.
Patients’ examination and blood sampling An anthropometric examination of the patients was part of the screening visit performed 1 d before the surgery. All subjects were measured and weighted, and BMI was calculated. A blood sample was taken for routine laboratory examination. Diabetes history, and information about concomitant illnesses and medication were collected. During the treatment part of the study, the blood samples were withdrawn from the arterial line and measured on an ABL 700 analyzer (Radiometer Medical A/S, Copenhagen, Denmark). The first sample was taken before the start of the surgery (time 0). Patients were randomized to the eMPC or standard protocol treatment, regardless of the preoperative blood glucose level. No threshold glucose level was defined as an inclusion criterion. Subsequent samples were taken as requested by the eMPC or standard protocol. The insulin treatment started at the beginning of the surgery and continued until the end of the study. In the eMPC group, the insulin infusion started based on the advice of the eMPC; in the standard protocol group, insulin administration started when blood glucose was more than 9 mmol/liter. Insulin was given iv through a central venous catheter using a 50-ml syringe and standard infusion pumps. The standard concentration was 50 IU Actrapid HM (Novo Nordisk, Baegsvard, Denmark) in 50 ml 0.9% NaCl. A continuous iv infusion of 10% glucose solution was administered during whole study in all patients (5–7 g/h according to an institutional protocol). No additional nutrition was administered.
MPC and routine glucose management protocol The eMPC algorithm used in this study has been described in detail previously (27, 28). Briefly, the eMPC includes a model of the glucoregulatory system. The model adapts itself to the input-output relationship observed during tight glucose control, i.e. an incoming glucose measurement is used by the model to update model parameters such as insulin sensitivity, considering previously given insulin, and parenteral and enteral glucose. Compared with the original MPC controller developed for the treatment of type 1 diabetes and using sc insulin delivery (27, 28), the eMPC for the treatment of the critically ill is simplified because insulin is delivered iv, and a submodel describing insulin absorption from the sc depot is not needed. However, the higher intersubject and temporal variability in insulin sensitivity and insulin needs among the critically ill compared with subjects with type 1 diabetes makes the delivery of an appropriate insulin dose challenging. Once individualized to a critically ill subject, the eMPC uses the glucoregulatory model to determine the optimum insulin infusion rate that is expected achieve the target glucose concentration. This is achieved by numerical optimization using simulated experiments with the individualized glucoregulatory model. The output of this optimization is a sequence of insulin infusion rates that are expected, based on model predictions, to result in the target glucose concentration over a period of 4 h. The first insulin infusion rate is displayed to the user and recommended for the delivery. The determination of the time-to-next glucose sample uses prediction accuracy. Through an internal procedure, the eMPC estimates how accurately it is able to predict glucose concentration. The extent of
accuracy will differ over time because the unexplained variability in glucose concentration varies due to, for example, temporal variations in insulin sensitivity. The estimated prediction accuracy is used by the eMPC to plot a prediction envelope. This is a funnel-like prediction shape indicating a range of possible glucose concentrations at each time point in the future. Once the prediction funnel crosses a border indicating nonacceptable bounds, this might be a level indicating a risk of hypoglycemia or unacceptable hyperglycemia, the eMPC suggests a sample to be taken. Glucose concentration, insulin dosage, and carbohydrate intake are the input variables for the eMPC. The insulin infusion rate and the time of the next glucose sample are the outputs. The eMPC was implemented on a laptop computer. The target range for blood glucose levels, as defined by the study protocol, was 4.4 – 6.1 mmol/liter, which has reduced mortality and morbidity in post-cardiac surgery patients (18). The percentage of time in the target range was calculated as the number of values in the target range in each patient divided by the number of measurements multiplied by 100. The standard algorithm is described in detail in Fig. 1. Severe hypoglycemia was defined as blood glucose less than 2.9 mmol/liter.
Statistical analysis The statistical analysis was performed using SigmaStat (Jandel Scientific, San Rafael, CA). The results are expressed as mean ⫾ sd. Differences between the standard and eMPC groups were evaluated using the t test or Mann-Whitney U rank sum test as appropriate.
Results
Table 1 shows characteristics of the standard glucose management protocol and eMPC groups. The groups did not significantly differ with respect to age, BMI, duration of surgery, number of patients with previously diagnosed diabetes, or baseline blood glucose. Blood glucose control characteristics, blood glucose and insulin infusion rate profiles, and percentage time in predefined ranges of both groups are shown in Tables 2 and 3, and Figs. 2 and 3, respectively. Mean blood glucose throughout the entire study, at the operating theater, and at the ICU was significantly lower in the eMPC vs. standard glucose management protocol group (Table 2). On the contrary, the mean insulin infusion rate and the total insulin dose were significantly higher in the eMPC vs. standard glucose management protocol group. The mean sampling interval was significantly shorter in the eMPC vs. standard glucose management protocol group (Table 2). The percentage time in the target range (4.4 – 6.1 mmol/ liter) and less than the target range was significantly higher in the eMPC vs. standard glucose management protocol TABLE 2. The mean blood glucose, insulin infusion rate, total insulin dose, and sampling interval during the entire study, at the operating theater, and at the ICU in patients treated by the standard glucose management protocol or the eMPC algorithm (mean ⫾ SD)
Blood glucose: entire study (mmol/ liter) Blood glucose at operating theater (mmol/liter) Blood glucose at ICU (mmol/liter) Average insulin rate (IU/h) Total insulin dose (IU/24 h) Average sampling interval (h) a
Standard
eMPC
7.2 ⫾ 1.1
6.2 ⫾ 1.1a
7.1 ⫾ 1.2
6.6 ⫾ 1.8a
7.3 ⫾ 1.3 2.6 ⫾ 1.7 69 ⫾ 45 2.1 ⫾ 0.2
6.0 ⫾ 1.0a 4.7 ⫾ 3.3a 111 ⫾ 67a 1.5 ⫾ 0.3a
P ⬍ 0.01 eMPC vs. the standard glucose management protocol.
Hovorka et al. • ICU Glucose Control by Computer Algorithm
J Clin Endocrinol Metab, August 2007, 92(8):2960 –2964
2963
TABLE 3. Blood glucose control expressed as time in the predefined glucose range (4.4 – 6.1 mmol/liter) in patients treated by the standard glucose management protocol or the eMPC algorithm
Time in target range (h) Time in target range (%) Time above target range (h) Time under target range (h) No. of severe hypoglycemia (⬍2.9 mmol/liter)
Standard
eMPC
6.6 ⫾ 3.9 27.5 ⫾ 16.2 16.7 ⫾ 4.1 0.6 ⫾ 1.5 0
14.5 ⫾ 5.5a 60.4 ⫾ 22.8a 7.4 ⫾ 4.7a 1.9 ⫾ 1.7a 0
Unless stated otherwise, values are the mean ⫾ SD. P ⬍ 0.01 eMPC vs. the standard glucose management protocol.
a
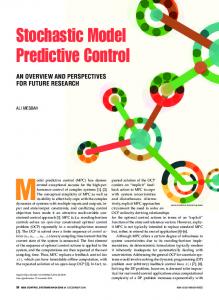
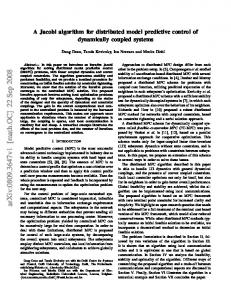
group (Table 3). The percentage time more than the target range was significantly lower in the eMPC vs. standard glucose management protocol group. No severe hypoglycemia defined as blood glucose lower than 2.9 mmol/liter was observed during the study. Hourly profiles of mean blood glucose values and insulin infusion rates are displayed in Figs. 2 and 3, respectively. Discussion
The present study demonstrates that a laptop-based eMPC algorithm can safely and effectively control blood glucose levels in patients during and after elective cardiac surgery. A major limitation of the previous version of the MPC was the need for hourly blood glucose measurements (29). It was argued that frequent blood sampling may have biased the overall results toward the eMPC relative to the standard protocol. Furthermore, hourly blood glucose sampling puts an additional burden on the nursing staff because it is more frequent than that prescribed by standard treatment protocols in most ICUs and is difficult to achieve under outside-
FIG. 2. The blood glucose profiles in patients treated by the standard glucose management protocol (RMP) or the eMPC algorithm (expressed as mean ⫾ SEM; n ⫽ 30 per group). Black horizontal lines in the graph show the 4.4 – 6.1 mmol/liter blood glucose target range. The table shows the number of glucose values used for calculation in each hour.
FIG. 3. The insulin infusion rate in patients treated by the standard glucose management protocol or the eMPC algorithm (expressed as mean ⫾ SEM; n ⫽ 30 per group).
study conditions. To address this criticism, we modified the MPC sampling pattern to allow a less frequent blood glucose sampling. The eMPC evaluates how well it can predict glucose excursions and increases the sampling interval once its predictions have become more accurate. This usually means that a more frequent sampling pattern is established during highly dynamic conditions such as during the surgery or the early part of a stay at the ICU when postoperative stress and treatment procedures may induce considerable variability in insulin sensitivity and, thus, limit the ability of the MPC to make accurate predictions of glucose excursions. Using information about the prediction accuracy, the mean sampling interval in the eMPC group increased from hourly to 1.5 ⫾ 0.3 h, which was still significantly more frequent than in the standard glucose management protocol group (1.5 ⫾ 0.3 h in the eMPC vs. 2.1 ⫾ 0.2 h in the standard group; P ⬍ 0.05). Compared with our earlier report (26), the present study used the eMPC during and after the surgery, used a 10% dextrose infusion in both treatment groups, and adopted a single-center study design. The additional modifications of the eMPC algorithm resulted in establishing a tighter glucose control compared with the original version with hourly blood glucose sampling. The original MPC gave a mean blood glucose level of 6.5 ⫾ 0.1 mmol/liter and the percentage of time in the target range of 54.8 ⫾ 8.8% (26). The present eMPC resulted in the mean blood glucose level of 6.2 ⫾ 1.1 mmol/liter and the percentage in the target range of 60.4 ⫾ 22.8%. The new eMPC algorithm was also more effective in establishing the target blood glucose range. The time-to-target was 10.3 ⫾ 0.9 h using the original MPC vs. 6.5 ⫾ 4.1 h with the currently tested eMPC. Another important finding of the present study was that both the standard glucose management protocol and the eMPC were safe with respect to the incidence of severe hypoglycemia. No severe hypoglycemia occurred in the eMPC
2964
J Clin Endocrinol Metab, August 2007, 92(8):2960 –2964
or standard glucose management protocol group. The fear of hypoglycemia represents a major barrier for the implementation of tight glucose control in ICUs. The benefit vs. harm analysis balancing the tight glucose control against the danger of complications of hypoglycemia is a hotly discussed topic in the critical care community (30). In conclusion, our study demonstrated that a computer algorithm with variable sampling (eMPC) was more effective in achieving tight glucose control in post-cardiac surgery patients than the standard protocol. The use of the algorithm on a laptop or its implementation in a stand-alone infusion system promises the achievement of tight glucose control in the critically ill. Acknowledgments
Hovorka et al. • ICU Glucose Control by Computer Algorithm
13. 14. 15.
16. 17. 18. 19.
Received March 2, 2007. Accepted May 25, 2007. Address all correspondence and requests for reprints to: Martin Haluzik, M.D., Ph.D., Third Department of Medicine, First Faculty of Medicine, Charles University, U Nemocnice 1, 128 08, Prague 2, Czech Republic. E-mail:
[email protected]. This work was supported by European Commission funded project Closed Loop Insulin Infusion for Critically Ill Patients and by the project of Ministry of Education, Youth and Sports no. 0021620814 (to M.H.). Disclosure Statement: J.K., J.B., M.M., K.A., L.B., T.R., M.E.W., L.J.C., S.S., and M.H. have nothing to declare. R.H. received consulting fees from Disetronic and lecture fees from Abbott Diabetes Care.
20.
References
24.
1. Mizock BA 1995 Alterations in carbohydrate metabolism during stress: a review of the literature. Am J Med 98:75– 84 2. Johan Groeneveld AB, Beishuizen A, Visser FC 2002 Insulin: a wonder drug in the critically ill? Crit Care 6:102–105 3. Furnary AP, Wu Y, Bookin SO 2004 Effect of hyperglycemia and continuous intravenous insulin infusions on outcomes of cardiac surgical procedures: the Portland Diabetic Project. Endocr Pract 10(Suppl 2):21–33 4. Van den Berghe G 2004 How does blood glucose control with insulin save lives in intensive care? J Clin Invest 114:1187–1195 5. McCowen KC, Malhotra A, Bistrian BR 2001 Stress-induced hyperglycemia. Crit Care Clin 17:107–124 6. Grimble RF 2002 Inflammatory status and insulin resistance. Curr Opin Clin Nutr Metab Care 5:551–559 7. Mechanick JI 2006 Metabolic mechanisms of stress hyperglycemia. JPEN J Parenter Enteral Nutr 30:157–163 8. Marik PE, Raghavan M 2004 Stress-hyperglycemia, insulin and immunomodulation in sepsis. Intensive Care Med 30:748 –756 9. Aulak KS, Koeck T, Crabb JW, Stuehr DJ 2004 Dynamics of protein nitration in cells and mitochondria. Am J Physiol Heart Circ Physiol 286:H30 –H38 10. Butler SO, Btaiche IF, Alaniz C 2005 Relationship between hyperglycemia and infection in critically ill patients. Pharmacotherapy 25:963–976 11. Marfella R, Nappo F, De Angelis L, Paolisso G, Tagliamonte MR, Giugliano D 2000 Hemodynamic effects of acute hyperglycemia in type 2 diabetic patients. Diabetes Care 23:658 – 663 12. Marfella R, Nappo F, De Angelis L, Siniscalchi M, Rossi F, Giugliano D 2000
25.
21. 22.
23.
26.
27.
28.
29.
30.
The effect of acute hyperglycaemia on QTc duration in healthy man. Diabetologia 43:571–575 Beckman JA, Goldfine AB, Gordon MB, Creager MA 2001 Ascorbate restores endothelium-dependent vasodilation impaired by acute hyperglycemia in humans. Circulation 103:1618 –1623 Williams SB, Goldfine AB, Timimi FK, Ting HH, Roddy MA, Simonson DC, Creager MA 1998 Acute hyperglycemia attenuates endothelium-dependent vasodilation in humans in vivo. Circulation 97:1695–1701 Title LM, Cummings PM, Giddens K, Nassar BA 2000 Oral glucose loading acutely attenuates endothelium-dependent vasodilation in healthy adults without diabetes: an effect prevented by vitamins C and E. J Am Coll Cardiol 36:2185–2191 Van den Berghe G 2002 Neuroendocrine pathobiology of chronic critical illness. Crit Care Clin 18:509 –528 Pittas AG, Siegel RD, Lau J 2004 Insulin therapy for critically ill hospitalized patients: a meta-analysis of randomized controlled trials. Arch Intern Med 164:2005–2011 van den Berghe G, Wouters P, Weekers F, Verwaest C, Bruyninckx F, Schetz M, Vlasselaers D, Ferdinande P, Lauwers P, Bouillon R 2001 Intensive insulin therapy in the critically ill patients. N Engl J Med 345:1359 –1367 Krinsley JS 2004 Effect of an intensive glucose management protocol on the mortality of critically ill adult patients. Mayo Clin Proc 79:992–1000 Van den Berghe G, Wilmer A, Hermans G, Meersseman W, Wouters PJ, Milants I, Van Wijngaerden E, Bobbaers H, Bouillon R 2006 Intensive insulin therapy in the medical ICU. N Engl J Med 354:449 – 461 Goldberg PA, Siegel MD, Sherwin RS, Halickman JI, Lee M, Bailey VA, Lee SL, Dziura JD, Inzucchi SE 2004 Implementation of a safe and effective insulin infusion protocol in a medical intensive care unit. Diabetes Care 27:461– 467 Scott JF, Robinson GM, French JM, O’Connell JE, Alberti KG, Gray CS 1999 Glucose potassium insulin infusions in the treatment of acute stroke patients with mild to moderate hyperglycemia: the Glucose Insulin in Stroke Trial (GIST). Stroke 30:793–799 Lonergan T, Le Compte A, Willacy M, Chase JG, Shaw GM, Wong XW, Lotz T, Lin J, Hann CE 2006 A simple insulin-nutrition protocol for tight glycemic control in critical illness: development and protocol comparison. Diabetes Technol Ther 8:191–206 Boulkina LS, Braithwaite SS 2007 Practical aspects of intensive insulinization in the intensive care unit. Curr Opin Clin Nutr Metab Care 10:197–205 De Block C, Manuel YKB, Van Gaal L, Rogiers P 2006 Intensive insulin therapy in the intensive care unit: assessment by continuous glucose monitoring. Diabetes Care 29:1750 –1756 Plank J, Blaha J, Cordingley J, Wilinska ME, Chassin LJ, Morgan C, Squire S, Haluzik M, Kremen J, Svacina S, Toller W, Plasnik A, Ellmerer M, Hovorka R, Pieber TR 2006 Multicentric, randomized, controlled trial to evaluate blood glucose control by the model predictive control algorithm versus routine glucose management protocols in intensive care unit patients. Diabetes Care 29:271–276 Hovorka R, Canonico V, Chassin LJ, Haueter U, Massi-Benedetti M, Orsini Federici M, Pieber TR, Schaller HC, Schaupp L, Vering T, Wilinska ME 2004 Nonlinear model predictive control of glucose concentration in subjects with type 1 diabetes. Physiol Meas 25:905–920 Hovorka R, Chassin LJ, Wilinska ME, Canonico V, Akwi JA, Federici MO, Massi-Benedetti M, Hutzli I, Zaugg C, Kaufmann H, Both M, Vering T, Schaller HC, Schaupp L, Bodenlenz M, Pieber TR 2004 Closing the loop: the adicol experience. Diabetes Technol Ther 6:307–318 Plank J, Blaha J, Cordingley J, Wilinska ME, Chassin LJ, Morgan C, Squire S, Haluzik M, Kremen J, Svacina S, Toller W, Plasnik A, Ellmerer M, Hovorka R, Pieber TR 2006 Multicentric, randomized, controlled trial to evaluate blood glucose control by the model predictive control algorithm versus routine glucose management protocols in intensive care unit patients: Response to Ligtenberg et al. Diabetes Care 29:1987–1988 Van den Berghe G 2006 First do no harm . . . hypoglycemia or hyperglycemia? Crit Care Med 34:2843–2844
JCEM is published monthly by The Endocrine Society (http://www.endo-society.org), the foremost professional society serving the endocrine community.