BMC Bioinformatics
BioMed Central
Open Access
Research article
Pol II promoter prediction using characteristic 4-mer motifs: a machine learning approach Firoz Anwar1, Syed Murtuza Baker*1, Taskeed Jabid1, Md Mehedi Hasan2, Mohammad Shoyaib3, Haseena Khan4 and Ray Walshe*5 Address: 1Department of Computer Science and Engineering, East West University, Bangladesh, 2Department of Genetic Engineering and Biotechnology, University of Dhaka, Bangladesh, 3Institute of Information Technology, University of Dhaka, Bangladesh, 4Department of Biochemistry and Molecular Biology, University of Dhaka, Bangladesh and 5Biocomputation Research Group, Dublin City University, Ireland Email: Firoz Anwar -
[email protected]; Syed Murtuza Baker* -
[email protected]; Taskeed Jabid -
[email protected]; Md Mehedi Hasan -
[email protected]; Mohammad Shoyaib -
[email protected]; Haseena Khan -
[email protected]; Ray Walshe* -
[email protected] * Corresponding authors
Published: 4 October 2008 BMC Bioinformatics 2008, 9:414
doi:10.1186/1471-2105-9-414
Received: 7 January 2008 Accepted: 4 October 2008
This article is available from: http://www.biomedcentral.com/1471-2105/9/414 © 2008 Anwar et al; licensee BioMed Central Ltd. This is an Open Access article distributed under the terms of the Creative Commons Attribution License (http://creativecommons.org/licenses/by/2.0), which permits unrestricted use, distribution, and reproduction in any medium, provided the original work is properly cited.
Abstract Background: Eukaryotic promoter prediction using computational analysis techniques is one of the most difficult jobs in computational genomics that is essential for constructing and understanding genetic regulatory networks. The increased availability of sequence data for various eukaryotic organisms in recent years has necessitated for better tools and techniques for the prediction and analysis of promoters in eukaryotic sequences. Many promoter prediction methods and tools have been developed to date but they have yet to provide acceptable predictive performance. One obvious criteria to improve on current methods is to devise a better system for selecting appropriate features of promoters that distinguish them from non-promoters. Secondly improved performance can be achieved by enhancing the predictive ability of the machine learning algorithms used. Results: In this paper, a novel approach is presented in which 128 4-mer motifs in conjunction with a non-linear machine-learning algorithm utilising a Support Vector Machine (SVM) are used to distinguish between promoter and non-promoter DNA sequences. By applying this approach to plant, Drosophila, human, mouse and rat sequences, the classification model has showed 7-fold cross-validation percentage accuracies of 83.81%, 94.82%, 91.25%, 90.77% and 82.35% respectively. The high sensitivity and specificity value of 0.86 and 0.90 for plant; 0.96 and 0.92 for Drosophila; 0.88 and 0.92 for human; 0.78 and 0.84 for mouse and 0.82 and 0.80 for rat demonstrate that this technique is less prone to false positive results and exhibits better performance than many other tools. Moreover, this model successfully identifies location of promoter using TATA weight matrix. Conclusion: The high sensitivity and specificity indicate that 4-mer frequencies in conjunction with supervised machine-learning methods can be beneficial in the identification of RNA pol II promoters comparative to other methods. This approach can be extended to identify promoters in sequences for other eukaryotic genomes.
Page 1 of 8 (page number not for citation purposes)
BMC Bioinformatics 2008, 9:414
1 Background A promoter is a signal element on a DNA molecule that specifies a controlling region of a gene where RNA polymerase binds to initiate the transcription of the gene. RNA polymerase II (RNA pol II) in eukaryotic cell binds the promoter signals of all protein-coding sequences. As there is no common collective occurrence of these signals it is extremely difficult to predict the promoter efficiently using an arbitrary or small set of predetermined signals. The approach adopted in this research considers a much larger set of signals that are not mutually exclusive and increases the success rate of finding a promoter in a given sequence significantly. A number of methods for the prediction of promoters, TSS (Transcription Start Signals) and TF (Transcription Factor) binding sites in eukaryotic DNA sequence presently exist [1,2]. Although contemporary algorithms have improved on predictive ability, a lot more research is required to achieve satisfactory levels of performance. Many generalpurpose promoter prediction implementations can typically recognize only ~50% of the promoters with a false positive (FP) rate of ~1 per 700–1000 bp [2]. A stepwise strategy method CorePromoter based on localization of functional promoter and TSS region was suggested by Zhang. [3] The use of Markov chain models in promoter prediction tools by Ohler et al. [4] improved the results slightly but they identified the same 50% of promoters from the dataset analyzed by Fickett and Hatzigeorgiou [2], while having a false positive prediction rate of 1/849 bp. Later Ohler [5] improved the result by incorporating some prominent motifs such as TATA, DRE, INR, DPE, MTE [6] to discriminate promoter and non-promoter using Hidden Markov Model. Also, another promoter identification program, Promoter 2.0, designed by Knudsen [7] applied a combination of neural networks and genetic algorithms. Promoter 2.0 was experienced on recognizing promoters in the complete Adenovirus genome (35,937 bp). The program predicted some known promoter sites such as TATA box, cap site, CCAAT box and GC box on the positive strand and 30 false promoters. Pandey et. al. [8] analyzed plant promoters in terms of their structural and sequence dependent properties like curvature and periodicity. Promoters with TATA box and without TATA box have also been analyzed in this regard. Since completion of the sequencing of the human genome, the efficiency of promoter prediction tools became critical and still poses a major challenge. PromoterInspector program [9] was the first software tool used to identify the promoters in human chromosome 22. This method identifies ~50% of known promoters as genomic regions up to 1 kb in length by discriminating them from the exon, intron and 3'-untranslated region (3'-UTR) sequences. Davuluri et al. proposed FirstEF program
http://www.biomedcentral.com/1471-2105/9/414
which included a decision tree based on structural and compositional discriminating features such as CpG islands, promoter regioins and first splice-donor sites [10]. In 2002, Bajic et al. [11] reported the Dragon Promoter Finder (DBF) program [12], which used sensors for three functional regions: promoters, exons and introns. Their findings claimed that DBF has higher accuracy than three other promoter finding programs which they had investigated namely: NNPP 2.1 [13-15] Promoter2.0 [7,16]and PromoterInspector [17]. Also in 2002, Down and Hubbard [18] reported a novel hybrid machine-learning method capable of predicting > 50% of human TSS with a specificity of > 70%. Xiao et. al. [19] predicted Pol II promoter sequence by cooperating Transcription Factor Binding Site (TFB) with the promoter sequence. They have identified that nearly 71% of the promoter sequences contain transcription factor with known cooperation. Rajeev et. al. [20] proposed another promoter identification tool where they identified the promoter sequence from non promoter sequence using non linear time series descriptor using non linear machine learning algorithm, such as SVM. Their approach showed 87% accuracy in 10 fold cross-validation test with an independent test having accuracy of near 85% in identifying promoter and nonpromoter. Yet another promoter prediction tool, TSSPTCM has been trained and adapted for plants [21]. In the test set of TATA promoters, the program correctly predicted TSS for 35 out of 40 (87.5%) genes. For 25 TATAless promoters, TSSs were predicted for 21 out of 25 (84%) genes, including 14 cases of 5 bp distance between annotated and predicted TSSs. A different approach was undertook by Gershenzon and Ioshikhes, besides identifying core promoter elements in Human they tried to demonstrate the synergistic effect of the combination of several core promoter elements for the initiation of the transcription [22]. While Jin et al. later in their study revealed a three-way synergistic effect using a degree of conservation between orthologous mouse and human sequence [23]. The proposed method in this paper demonstrates that with the aid of PromMachine- a machine-learning tool, promoters are distinguished from the non-promoter sequences on the basis of abundance of some characteristic 4-mer motifs. The PromMachine is trained with 128 distinguishing 4-mers that can discriminate between promoter and non promoter. Using this knowledge the machine-learning tool can efficiently decide whether a given sequence contains a promoter or not. With high sensitivity, specificity and accuracy the proposed approach shows high efficiency in promoter prediction in eukaryotic genomic sequences. Being applicable for any reasonable length (251 bp length of a promoter is considered to be a reasonable length) of given sequences
Page 2 of 8 (page number not for citation purposes)
BMC Bioinformatics 2008, 9:414
http://www.biomedcentral.com/1471-2105/9/414
this approach can become a dynamic tool for finding promoters of other eukaryotes.
achieved, which demonstrates the high performance of the proposed model for correctly identifying a promoter as a promoter and a non-promoter as a non-promoter. Also it demonstrates that, the model is less prone to false positive and false negative. Besides sensitivity and specificity, a number of other statistical procedures such as correlation coefficient (Corr.), false positive rate (FPR), false negative rate (FNR), positive predictive value (PPV), negative predictive value (NPV), positive likelihood (PL) and negative likelihood (NL) are also calculated for each of the species. The FPR values for each species show that the proportions of negative instances that are erroneously reported as being positive are low.
2 Results and discussion 2.1 Prediction Accuracy Different statistical measures have been used to analyze the performance of the proposed model. In order to test the prediction accuracy, 50 known promoter sequences from each species i.e. human, mouse, plant, rat and Drosophila as well as 50 known non-promoter sequences for each of those five species are initially taken for the test. Then taking one species at a time i.e. 50 known promoter and 50 known non-promoter for that species, the previously trained model is applied and tested upon these test data. It is to be mentioned that these test dataset are completely independent from the training set. In most of the case the model correctly predicts the promoters and nonpromoter in these test data. Sensitivity and specificity are two widely used techniques for performance evaluation, which are defined as following, where TP is true positive, FN is false negative, FP is false positive and TN is truly negative.
Sensitivity = TP/(TP + FN)
(1)
Specificity = TN/(FP + TN)
(2)
The PPV values in Table 1 shows that about 80% times a promoter is correctly identified as promoter in rat, whereas this accuracy increased to 83% in mouse, 89% in plant and 92% for both Drosophila and human. However, because the PPV depends on the prevalence of the dataset, a same proportion of positive and negative data are taken for the test. The likelihood ratios are also calculated, as it is independent of the prevalence (Table 1). Cross validation is another statistical process for estimating the predictive accuracy of a classifier on data. In this process, the whole dataset i.e. both positive and negative data for a given species is partitioned into subsets in such a way that the analysis is made on one subset while all the other subsets are used for training. To analyze the performance of some other n-mers; first, 3, 4 and 5-mers are generated and tested against the same dataset. A cross-validation accuracy of 81.78%, 83.81% and 83.27% are
The results of sensitivity and specificity for all the species are recorded in Table 1. As it can be seen from Table 1 a sensitivity of 86% and specificity of 90% for plant; 96% and 92% for Drosophila; 88% and 92% for human; 78% and 84% for mouse and finally 82% and 80% for rat are
Table 1: Predictive accuracy calculation of the proposed model using different statistical measures
Predicted Sequences
TP
FP
FN
TN
Sn
Sp
Corr.
FPR
FNR
PPV
NPV
PL
NL
Plant Promoter
43
Nil
7
Nil
0.86
0.90
0.761
0.10
0.14
0.89
0.86
8.60
0.15
Plant CDS/Non-Promoter
Nil
5
Nil
45
Drosophila Promoter
48
Nil
2
Nil
0.96
0.92
0.881
0.08
0.04
0.92
0.95
12
0.04
Drosophila CDS/Non-Promoter
Nil
4
Nil
46
Human Promoter
44
Nil
6
Nil
0.88
0.92
0.801
0.08
0.12
0.92
0.88
11
0.13
Human CDS/Non-Promoter
Nil
4
Nil
46
Mouse Promoter
39
Nil
11
Nil
0.78
0.84
0.621
0.16
0.22
0.83
0.79
4.87
0.26
Mouse CDS/Non-Promoter
Nil
8
Nil
42
Rat Promoter
41
Nil
9
Nil
0.82
0.80
0.620
0.20
0.18
0.80
0.81
4.10
0.22
Rat CDS/Non-Promoter
Nil
10
Nil
40
Page 3 of 8 (page number not for citation purposes)
BMC Bioinformatics 2008, 9:414
http://www.biomedcentral.com/1471-2105/9/414
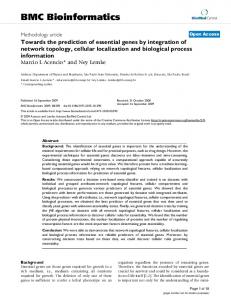
obtained, which justifies the use of 4-mer motif for proposed promoter prediction methodology. A differential hexamer technique was used earlier by Hutchinson for identifying vertebrate promoter; on 29 test sequences he correctly distinguished 18 promoters as true positive whereas 11 were false positive, which gave him a Sensitivity of 62.1%. The result improved up to 71.4% when only sequences of length above 10,000 were considered [24]. Also Chan and Kibler have used 6-mer distribution for identifying cis-regulatory motifs in Drosophila and obtained a Sensitivity and Specificity of 38.68%, 93.77%, and the PPV was 36.05% [25], which is significantly improved upon by the method proposed in this paper (Table 1). This supports the significance of 4-mer distribution used here compared to other n-mers. The rational of 4-mer giving better results is, for lower or higher mers the frequency distribution of the feature set are not descriptive enough for the SVM classifier to distinguish promoters from the non-promoters. Moreover a significant overrepresentation of 4-mer motif such as ATAA, TATA or TCAG was confirmed earlier by Ohler et al. [26], it may also speculate the justification of 4-mer performing better than some other n-mers. When the model presented in the paper is trained with the 128 discriminating 4-mer features of a given species and tested; the results from the model are promising. A 7-fold cross validation for all five species displays accuracy of 83.81%, 94.82%, 91.25%, 90.77% and 82.35% for plant, Drosophila, human, mouse and rat respectively (Table 2). The high-percentage of correct value, correlation coefficient for this proposed model clearly indicates that calculated frequencies of 4-mer sequences are capable of discriminating with high accuracy between promoter and non-promoter regions. The top five 4-mers which are most frequent in the promoter dataset of all five species are listed in Table 3. A union of these motifs across the species results in a total of 18 motifs all together. The positional distributions of these 18 motifs for each of the five species are shown in Figure 1. Although measuring the conservation of these 4-mer motifs across different species is outside the scope of this research but positional conserveness of the 18 motifs in each five species i.e. where in the sequence dataset for a given species these 18 motifs mostly exists, can be observed from the figures presented. Table 2: Cross validation accuracy
Algorithm Applied to
7-Fold Cross Validation Accuracy
Plant Drosophila Human Mouse Rat
83.81% 94.82% 91.25% 90.77% 82.35%
Table 3: Top five 4-mer motifs in different species arranged in order, highest on the top
Rank
Drosophila
Human
Mouse
Plant
Rat
1 2 3 4 5
TTTT AAAA ATTT AAAT AATT
GCGG GGCG GGGG GGGC GCCC
AAAA GGGG CAGG CCAG GGGC
AAAA TTTT AAAT TATA ATAT
GGAG GGGG AGAG CAGG CAGC
Also the top 10 discriminating features (motifs) between plant promoter and plant non-promoter are listed in Table 4. In addition, the proposed method identifies the location of the TATA box using TATA weighted matrix [27]. For this a sliding window technique is used with a window size of 12 and cutoff score of the matrix is selected as 7.16. Each time the window is shifted by 1 bp across the sequences. The windows with a TATA box score exceeding the cutoff score are accepted as TATA Box. This indicates the possible location of promoter. As TATA box is usually located 25 base pairs upstream to the transcription start site (TSS), using this information TSS can also be identified in the TATA Box containing promoter sequences. 2.2 Comparison with existing methods Similarity based methods such as BLAST is normally the first choice to distinguish between two different set of data. But no significant distinguishable features are identified using promoter-promoter, non-promoter – nonpromoter and promoter-non-promoter BLAST search. To date various algorithms and methods are used for promoter prediction. Using these algorithms, some widely used promoter prediction tools have been developed, e.g. Soft Berry, Dragon Promoter Finder, Neural Network Promoter Prediction, Promoter 2.0 Prediction Server and Promoter Scan.
Table 4: The top 10 most discriminating 4-mer sequences found within promoter and non-promoter region for plant
Rank
Frequency Difference
4-mer
1 2 3 4 5 6 7 8 9 10
564 438 435 431 407 373 324 312 302 302
TATA ATAT AAAA ATAA TAAA GAAG TTTT ATAA AGAA GGAA
Page 4 of 8 (page number not for citation purposes)
BMC Bioinformatics 2008, 9:414
http://www.biomedcentral.com/1471-2105/9/414
0.7
AAAA
0.6 0.5 0.4 0.3 0.2 0.1 0 -200
-170
-140
-110
-80
-50
-20
10
40
A
0.6
GCGG
0.5 0.4 0.3 0.2 0.1 0 -200
-170
-140
-110
-80
-50
-20
10
40
10
40
B
0.7
TATA
0.6 0.5 0.4 0.3 0.2 0.1 0 -200
-170
-140
-110
-80
-50
-20
C
1.2
TATA
1 0.8 0.6 0.4 0.2 0 -200
-170
-140
-110
-80
-50
-20
10
40
D 0.7
TATA
0.6 0.5 0.4 0.3 0.2 0.1 0 -200
-170
-140
-110
-80
-50
-20
10
40
AAAA AAAT AATT AGAA AGAG ATAT ATTT CAGC CAGG CCAG GCCC GCGG GGAG GGCG GGGC GGGG TATA TTTT
E
Figure Top 18 motifs 1 distribution along with position in Drosophila (A), Human (B), Mouse (C), Plant (D) and Rat (E) Top 18 motifs distribution along with position in Drosophila (A), Human (B), Mouse (C), Plant (D) and Rat (E).
Page 5 of 8 (page number not for citation purposes)
BMC Bioinformatics 2008, 9:414
http://www.biomedcentral.com/1471-2105/9/414
However, the model proposed here demonstrates even better performance than these tools. The results shown in Table 5 clearly indicate that the prediction accuracy of the model is much higher in comparison to other tools. There are a number of key features in this model which contribute to the improved performance such as the use of larger sets (128) of discriminating features between promoters and non promoters and the utilisation of the supervised learning system- SVM. Other prominent promoter prediction tools use either a statistical approach or Neural Network such as SoftBerry (TSSP). However, SVM has outperformed both of these approaches in pattern matching and supervised learning. Also most of the afore-mentioned approaches are limited in the number of features used as the promoter signals such as TATA box or Initiator etc. In contrast, the model described in this paper, uses SVM to detect a greater set of signals than previously attempted to date to decide whether a sequence is a promoter or non promoter. The additional features developed in the course of this research show that a significant increase in promoter prediction can be achieved using this method.
in this paper is not likely to vary much using other database, cause the proposed method does not rely on the identification of the TATA box for discriminating promoters from non-promoters. Incorporating comparative genomics certainly can extend the method. It would reduce the false discovery rate further, as at a moderate phylogenetic distance the functional elements are known to be more conserved for orthologous gene [23,29]. Nevertheless, it is suggested that the approach proposed here would be a extremely useful and an efficient tool to meet the demands of the molecular biologists.
4 Methods 4.1 Promoter Sequence Database To accomplish the task of RNA polymerase II promoter prediction, the plant promoter dataset is taken from PlantProm database [27]. A total of 305 entries of plant promoter sequence are obtained from PlantProm DB. Also to make the model applicable to predict promoters in Drosophila, human, mouse and rat, a number of 1922, 1863, 190 and 119 promoter sequences respectively are collected from EPD (Eukaryotic Promoter Database) [30,31]. These data are used for training the proposed model and tested against mutually exclusive data from the same data source. Sequence segments from -200 to +51 relative to TSS are considered from the EPD for the experiment. On the other hand -200 to +51 segments are taken from PlantProm DB.
3 Conclusion The successful prediction of promoters with high accuracy using frequency distribution of 4-mer sequences shows that this novel method has significant merit as an approach for successful eukaryotic promoter prediction. The principal objective of this work was to develop an efficient tool that can discriminate between promoter and non-promoter in an unknown sequence with high accuracy. The high accuracy of promoter prediction in plant, human, Drosophila, mouse and rat (Table 2) using our approach has validated the use of frequency distribution of 4-mers in discrimination between promoter and non promoter regions in eukaryotic sequences. However, though the approach is very efficient in predicting the presence of promoter in a given sequence, it cannot locate the position of the TSS when TATA box is not present. This challenge should be resolved in future if other signals can be characterized for specific position in the sequence. The improvement of identification of all TSS site will be considered in future using various published databases such as MPromDB, TRED, DBTSS etc. Though the EPD is known to have a TATA bias [23,28], the result presented
4.2 Non-Promoter Sequence Database The non-promoter sequences are extracted from Unigene database that belongs to EMBL. CDSs are the best non promoter sequence because it contain no promoter sequences and so for every organism specific model an equal number of CDSs are usaed in the training process as the non promoter sequence. 4.3 Support Vector Machine SVM, a supervised machine-learning technique has been used for discriminating between promoter and non-promoter sequences. SVM classifiers solve multi-class classification problems using the structural minimization principle. Given a training set in a vector space, SVMs can find the best decision hyper plane, which separates two classes. The quality of the decision hyper plane depends
Table 5: Comparison of accuracy against existing methods [** = Infinity]
Program Used
NNP Threshold(0.8)
SoftBerry (TSSP)
ProScan Vers. 1.7
Dragan Promotor Finder Vers. 1.4
Promotor 2.0 Pred. Server
Prom-Machine
SENSITIVITY % SPECIFICITY % Correlation CoEff.
68 76 0.44
88 90 0.78
0 100 **
12 100 0.25
0 78 **
86 90 0.77
Page 6 of 8 (page number not for citation purposes)
BMC Bioinformatics 2008, 9:414
http://www.biomedcentral.com/1471-2105/9/414
on the difference margin between the two hyperplanes defined by the SVM [32]. For a typical learning task P(X, y) = P(y|X)P(X), an inductive SVM learner aims to build a decision function. Here Xi ∈ X are objects of the training set and yi ∈ {-1, 1} are their known classes. fn: X → {-1,1} based on a training set S which is fn = fn(Strain) where Strain = (X1, y1), (X2, y2),..., (Xn, yn). It is necessary to select a kernel function and the regularization parameter in each Binary Classifier and in this instance, the Radial Basis Function (RBF) [32] is selected as the kernel function. Because the RBF kernel nonlinearly maps samples into a higher dimensional space, it can handle cases where the relations are non linear. The SVM classification problem can be formulated in terms of a convex quadratic optimization problem as
⎡ Max ⎢ ⎢ ⎣
N
∑ i =1
αi −
1 − 2
⎤ α iα j y i y j K ( x i , x j ) ⎥ ⎥ i , j =1 ⎦ N
∑
4.4 Procedure 4.4.1 Selection of features Taking all four nucleotides (A, T, C and G) a 44 = 256 different 4-mers combinations are generated. In order to select most discriminating features the frequency of each of these features are calculated. In this procedure the fij and fnij are calculated, where fij is the frequency of each ith 4-mer motif (i = 1...256) in jth known promoter sequence and fnij is the frequency of each ith 4-mer in jth known non-promoter sequence. Then this fij and fnij are used for calculating Pi and NPi for which the equation is given below. n
∑f j =1
ij
∑ fn
(5)
ij
j =1
Where, Pi is the summation of frequencies in n promoter sequences for each ith 4-mer (i = 1...256) and NPi is the summation of frequencies in n non-promoter sequences for each ith 4-mer. The absolute difference between the numbers of occurrences of all 256 possible combinations of 4-mers in known promoter and non-promoter sequences are calculated using Diffi = |Pi - NPi |, where Diffi is the absolute difference of the occurrence of ith 4-mer between known promoter and non promoter. The value of these 256 Diffi are then sorted in descending order and the top 128 4-mers for which the Diffi is maximum are selected as features of the proposed model. All the selected n known promoter and n known non-promoter sequence are of length 251 bp. A single strand search of 251 bp window has been conducted during the frequency calculation.
(3)
In the above equation N is the total number of input vectors, αi is any real value that maximizes the function, xi is any real number as the input vectors and yi be their corresponding target class, which is either -1 or 1 in binary classifier. LIBSVM – a library for SVM developed by ChihChung Chang and Chih-Jen Lin http:// www.csie.ntu.edu.tw/~cjlin/libsvm/ is used to train in a supervised manner on a collection of promoter and nonpromoter training sequences. The model developed from this training set is then used to predict the promoter sequences from a test sequence.
Pi =
n
NPi =
(4)
4.4.2 Training with SVM The frequency fij of the top 128 4-mer motifs are used to find the promoter (or non-promoter) in a given sequence. Here i range from 1 to 128 and j range from 1 to n. A scaling factor is introduced to bring the numerical value of fij in between 0 and 1 using equation 4.
d ij =
f ij − min( f1, f 2 ,..., f128 )
(6)
max( f1… f128 )
Here, the numerical value of dij ranges from 0 to 1. Here, the value dij is the scaled value of ith 4-mer in jth sequence. A complete set of dij values of all the promoter and non-promoter sequences is then used to train the SVM for a given species. Libsvm [33], which is an efficient software for SVM classification and regression, is trained with the frequency patterns of the 128 characteristic 4-mer motifs in known promoters and non-promoters. A model is then built that can be used to distinguish between promoter and non promoter in test sequences. 4.4.3 Testing To substantiate the machine-learning model, Jackknife [34] validation could be the ideal process. Jackknife is a method that creates a series of statistics from a single data set by generating that statistic repeatedly on the data set leaving one data value out each time which produces a mean estimate of the parameter and a standard deviation of the estimates of the parameter. This validation method is time consuming. So to speed up the process, a 7-fold
Page 7 of 8 (page number not for citation purposes)
BMC Bioinformatics 2008, 9:414
cross-validation is performed where the whole dataset is divided into 7 random parts and 7 iterations are performed to predict the accuracy. In every iteration 6 parts are used for training and the other part is used for testing. In the following iteration the other 6 parts are used for training and the remaining part is used for testing.
http://www.biomedcentral.com/1471-2105/9/414
20. 21. 22.
Authors' contributions FA was responsible for implementation and reviewing the research and manuscript. SMB was responsible for coding, implementation and manuscript preparation. TJ was responsible for implementation, coding and testing. MMH was responsible for biological information analysis and interpretation. MS proposed the idea for the research and generated the project specification. HK reviewed the research manuscript and inspired overall analysis. RW reviewed the research manuscript, revised previous versions, edited and formatted the final document.
23. 24. 25. 26. 27. 28.
References 1. 2. 3. 4. 5. 6. 7. 8. 9.
10. 11. 12. 13.
14. 15. 16. 17.
18. 19.
Bucher P: Weight rr matrix description of four eukaryotic RNA polymerase II promoter elements derived from 502 unrelated promoter sequences. J Mol Biol 1990, 212:563-578. Fickett JW, Hatzigeorgiou AC: Eukaryotic promoter recognition. Genome Res 1997, 7:861-878. Zhang MQ: Identification of Human Gene Core Promoters in Silico. Genome Research 1998, 8:319-326. Ohler U, Harbeck S, Niemann H, Noth E, Reese M: Interpolated Markov chains for eukaryotic promoter recognition. Bioinformatics 1999, 15:362-369. Uwe O: Identification of core promoter modules in Drosophila and their application in accurate transcription start site prediction. Nucleic Acids Res 2006, 34:5943-5950. Chin YL, Santoso B, Boulay T, Dong E, Ohler U, Kadonaga JT: The MTE, a new core promoter element for transcription by RNA polymerase II. Genes and Dev 2004, 18:1606-1617. Knudsen S: Promoter 2.0: for recognition of Pol II promoter sequences. Biotechnologies 1999, 15:356-361. Pandey SP, Krishnamachari A: Computational analysis of plant RNA Pol-II promoters. Bio Systems 2006, 83:38-50. Scherf M, Klingenhoff A, Frech K, Qu TK, Schneider R, Grote K, Frisch M, Gailus-Durner V, Seidel A, Brack-Werner R, Werner T: First pass annotation of promoters of human chromosome 22. Genome Res 2001, 11:333-340. Davuluri VR, Grosse I, Zhang MQ: Computational identification of promoters and first exons in the human genome. Nature Genetics 2001, 29:412-417. Bajic VB, Seah SH, Chong A, Zhang G, Koh JLY, Brusic V: Dragon promoter finder: recognition of vertebrate RNA polymerase II promoters. Bioinformatics 2002, 18:198-199. Dragon Promoter Finder 1.5. . Reese M, Harris NL, Eeckman FH: Large scale sequencing specific neural networks for promoter and splice site recognition. In Biocomputing Proceedings of the 1996 Pacific Symposium Edited by: Hunter L, Klein T. World Scientific Co; 1996. NNP 2.2 [http://www.fruitfly.org/seq_tools/promoter.html] Reese MG: Application of a time-delay neural network to promoter annotation in the Drosophila melanogaster genome. Computers and Chemistry 2001, 26:51-56. Prom 2 [http://www.cbs.dtu.dk/services/Promoter/] Scherf M, Klingenhoff A, Werner T: Highly specific localization of promoter regions in large genomic sequences by PromoterInspector: a novel context analysis approach. J Mol Biol 2000, 297:599-606. Down TA, Hubbard TJ: Computational detection and location of transcription start sites in mammalian genomic DNA. Genome Res 2002, 12:458-461. Xiao-Tu M, Min-Ping Q, Hai-Xu T: Predicting Polymerase II Core Promoters by Cooperating Transcription Factor Binding
29. 30. 31. 32. 33. 34.
Sites in Eukaryotic Genes. Acta Biochimica et Biophysica Sinica 2004, 36:250-258. Rajeev G, Pankaj S: Human pol II promoter prediction: time series descriptors and machine learning. Nucleic Acids Res 2005, 33:1332-1336. Shahmuradov IA, Solovyev VV, Gammerman1 AJ: Plant promoter prediction with confidence estimation. Nucleic Acids Research 2005, 33:1069-1076. Gershenzon N, Ioshikhes I: Synergy of human Pol II core promoter elements revealed by statistical sequence analysis. Bioinformatics 2005, 21:1295-1300. Jin V, Singer G, Davuluri R: Genome-wide Analysis of Core Promoters from Conserved Human and Mouse Orthologous Pairs. BMC Bioinformatics 2006, 7:114. Hutchinson G: The prediction of vertebrate promoter regions using differential hexamer frequency analysis. Bioinformatics 1996, 12(5):391-398. Chan B, Kibler D: Using hexamers to predict cis-regulatory motifs in Drosophila. BMC Bioinformatics 2005, 6:262. Ohler U, Liao G, Niemann H, Rubin G: Computational analysis of core promoters in the Drosophila genome. Genome Biol 2002, 3:1-12. Shahmuradov I, Gammerman A, Hancock JM, Bramley PM, Solovyev VV: PlantProm: a database of plant promoter sequences. Nucleic Acids Res 2003, 31:114-117. Zhang M: A discrimination study of human core-promoters. Pac Symp Biocomput 1998:307-309. Hardison R: Comparative Genomics. PLoS Biol 2003, 1:E58. EPD [http://www.epd.isb-sib.ch/] Schmid C, Perier R, Praz V, Bucher P: EPD in its twentieth year: towards complete promoter coverage of selected model organisms. Nucleic Acids Res 2006, 34:D82-D85. Boser BE, Guyon IM, Vapnik VN: A training algorithm for optimal margin classifiers. In Proceedings of the 5th Annual ACM Workshop on Computational Learning Theory ACM Press; 1992:144-152. Chih-Wei H, Chih-Chung C, Chih-Jen L: A Practical Guide to Support Vector Classification National Taiwan University; 2004. Bradley E, Gail G: A Leisurely Look at the Bootstrap, the Jackknife, and Cross-Validation. The American Statistician 1983, 37(1):36-48.
Publish with Bio Med Central and every scientist can read your work free of charge "BioMed Central will be the most significant development for disseminating the results of biomedical researc h in our lifetime." Sir Paul Nurse, Cancer Research UK
Your research papers will be: available free of charge to the entire biomedical community peer reviewed and published immediately upon acceptance cited in PubMed and archived on PubMed Central yours — you keep the copyright
BioMedcentral
Submit your manuscript here: http://www.biomedcentral.com/info/publishing_adv.asp
Page 8 of 8 (page number not for citation purposes)