BMC Bioinformatics
BioMed Central
Open Access
Research article
Information-based methods for predicting gene function from systematic gene knock-downs Matthew T Weirauch1, Christopher K Wong1, Alexandra B Byrne2 and Joshua M Stuart*1 Address: 1Department of Biomolecular Engineering, 1156 High Street, Mail Stop: SOE2, University of California, Santa Cruz, CA 95064, USA and 2Department of Molecular Genetics, The Terrence Donnelly Centre for Cellular and Biomolecular Research, 160 College St., University of Toronto, Toronto, ON, M5S 3E1, Canada Email: Matthew T Weirauch -
[email protected]; Christopher K Wong -
[email protected]; Alexandra B Byrne -
[email protected]; Joshua M Stuart* -
[email protected] * Corresponding author
Published: 29 October 2008 BMC Bioinformatics 2008, 9:463
doi:10.1186/1471-2105-9-463
Received: 10 June 2008 Accepted: 29 October 2008
This article is available from: http://www.biomedcentral.com/1471-2105/9/463 © 2008 Weirauch et al; licensee BioMed Central Ltd. This is an Open Access article distributed under the terms of the Creative Commons Attribution License (http://creativecommons.org/licenses/by/2.0), which permits unrestricted use, distribution, and reproduction in any medium, provided the original work is properly cited.
Abstract Background: The rapid annotation of genes on a genome-wide scale is now possible for several organisms using high-throughput RNA interference assays to knock down the expression of a specific gene. To date, dozens of RNA interference phenotypes have been recorded for the nematode Caenorhabditis elegans. Although previous studies have demonstrated the merit of using knock-down phenotypes to predict gene function, it is unclear how the data can be used most effectively. An open question is how to optimally make use of phenotypic observations, possibly in combination with other functional genomics datasets, to identify genes that share a common role. Results: We compared several methods for detecting gene-gene functional similarity from phenotypic knock-down profiles. We found that information-based measures, which explicitly incorporate a phenotype's genomic frequency when calculating gene-gene similarity, outperform non-information-based methods. We report the presence of newly predicted modules identified from an integrated functional network containing phenotypic congruency links derived from an information-based measure. One such module is a set of genes predicted to play a role in regulating body morphology based on their multiply-supported interactions with members of the TGF-β signaling pathway. Conclusion: Information-based metrics significantly improve the comparison of phenotypic knock-down profiles, based upon their ability to enhance gene function prediction and identify novel functional modules.
Background The observable downstream effect of perturbing gene expression offers clues about a gene's normal operations in the cell. The discovery of RNA interference (RNAi) in Caenorhabditis elegans provides an efficient method for gene knock-down [1]. Multiple efforts have systematically
knocked down large numbers of genes in C. elegans and scored the consequences of their disruptions using a controlled vocabulary of predefined phenotypic descriptors (reviewed in [2,3]). Descriptors record, for example, whether a gene knock-down causes embryonic lethality,
Page 1 of 21 (page number not for citation purposes)
BMC Bioinformatics 2008, 9:463
results in uncoordinated motor control, produces altered genital structures, or gives rise to sterile worms. Genes that participate in a common cellular function often yield similar phenotypic effects when knocked down [4-6]. The presence or absence of a set of predefined phenotypes constitutes the phenotypic signature of a gene, a vector of binary values that can be used to compare the observed phenotypes of one gene's knock-down to another's [7]. Large genetic networks have been constructed for both C. elegans [8-10] and Saccharomyces cerevisiae [11,12] in which genes are connected if they have highly similar (congruent) phenotypic signatures. Previous methods have also clustered genes based on the congruency of knock-down phenotypes [7,13]. Genes have been grouped together based on sharing a single phenotype [14,15], by visually screening for highly similar phenotypic signatures [16], by counting the number of shared phenotypes [17], by measuring the correlation of phenotypic signatures [9], and by constructing consensus phenotype profiles [18]. Some of these methods take advantage of a potential benefit of genome-wide studies: while experimenters often focus on recording the presence of specific phenotypes, the absence of phenotypes may also provide useful information for elucidating co-functional groups of genes. Although previous studies have used a variety of approaches to measure phenotypic congruency, to our knowledge a detailed evaluation of con-
http://www.biomedcentral.com/1471-2105/9/463
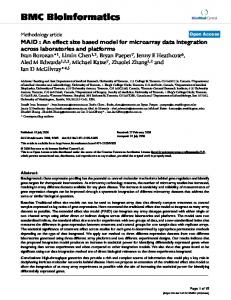
gruency metrics has not been performed. The optimal way to compare the knock-down phenotypes of genes remains an open question. To motivate our discussion, consider the four pairs of phenotypic signatures collected from the current C. elegans dataset shown in Figure 1. According to the literature, gene pairs A and D contain genes that are known to be functionally related, while B and C contain genes which are unrelated. RNAi of A's two ribosomal genes produces identical sets of phenotypic observations, which is expected for genes encoding subunits of the same protein complex. Likewise, RNAi silencing of B's unrelated genes – snr-1, the small nuclear RNA involved in pre-mRNA splicing and clr-1, a regulator of FGF signaling – produces dissimilar phenotypes. In these two cases, the similarity (or dissimilarity) of phenotypic signatures reflects the similarity (or dissimilarity) of the corresponding genes' functions. On the other hand, there are also cases in the C. elegans dataset where the similarity of two phenotypic signatures may not correlate with the functions of their genes. For example, RNAi of C's unrelated genes, his-48, an H2B histone, and sqv-4, a UDP-glucose 6-dehydrogenase, has thus far resulted solely in 'Embryonic Lethality' (Emb), a common phenotype observed in roughly half of all knockdowns. In this case, although the phenotypic signatures of
Figure Four possible 1 associations between phenotypic congruency and shared gene function Four possible associations between phenotypic congruency and shared gene function. Boxes indicate that a phenotype (column) was observed to be either present (dark box) or absent (light box) upon knock-down of a gene (row) using RNA interference. Genes are grouped into four different pairs: A, B, C, and D. Pairs A and C contain genes with identical signatures; pairs A and D contain genes with related function. Phenotypes are ordered from left to right by decreasing frequency (indicated as inverted bars in the bar graph), calculated across genes with at least one phenotype.
Page 2 of 21 (page number not for citation purposes)
BMC Bioinformatics 2008, 9:463
http://www.biomedcentral.com/1471-2105/9/463
the genes are identical, the similarity might be purely coincidental. Conversely, the phenotypic signatures for D's two related cuticle collagen-encoding genes are considerably different. However, knock-down of both genes produces two relatively rare phenotypes, 'Dumpy' (Dpy) and 'Roller' (Rol), a combined result that is unlikely to occur by chance. The above examples illustrate that the incorporation of phenotype background frequencies can potentially help interpret gene functional similarity from phenotypic congruency. False-positives (such as pair C) might be reduced by down-weighting common phenotypes, and true-positives (such as pair D) might be increased by up-weighting rare phenotypes. In this paper, we systematically evaluate 19 standard metrics for measuring phenotype congruency. The metrics include well known vector-based similarity and distance measures, such as Pearson correlation and Euclidean distance. We focus on comparing information-based metrics, those that incorporate phenotypic frequency across the genome, to non-information-based metrics. We provide evidence that information-based metrics outperform non information-based metrics for comparing genes based on phenotype congruency. The top-scoring informationbased metric rewards genes for shared present phenotypes (both knock-downs result in the phenotype) and absent phenotypes (neither knock-down results in the phenotype), while factoring in the background frequencies of both types of matches. We use the top-scoring measure to identify new functional gene modules in an integrated functional network. We conclude that information-based approaches show promise for integrating genome-wide phenotype data with other functional genomic data
sources for both gene annotation and revealing new frontiers of genetic networks.
Results RNA interference knock-down phenotype data We collected data from three high-throughput RNA interference screens [19-21]. Synonymous phenotypes were merged to unite the data from these different sets (see Methods). In total, we collected data measuring the presence or absence of 34 different phenotypes under the knock-down of each of 2,376 C. elegans genes (Table 1). This dataset has approximate genome-wide coverage, as the majority of C. elegans knock-downs (about 16,000 genes) have no discernable phenotype. Thus, it is important to note that the results of comparing phenotype metrics apply only to the minority of genes that produce at least one recordable RNAi phenotype. Phenotypic signatures were recorded in a G × V binary matrix (G = 2,376, V = 34), K, where Kgv was set to one if phenotype v was observed under the knock-down of gene g and was set to zero otherwise. The full matrix of compiled RNAi phenotypes is available as Additional Data File 1.
There are several sources of noise in the data, and we expect the false-negative rate to be high, mostly due to the inherent limitations of RNAi. For example, many neuronal genes are known to be refractory to RNAi. A false-negative may also occur when one phenotype excludes the observation of a second phenotype. For example, embryonic lethality could preclude observing adult phenotypes such as uncoordinated motor control. As another example, a false-positive may occur when a knock-down produces an off-target effect. To compare across congruency metrics, a complete data matrix was constructed by replacing missing values with zeros. We expect this preprocess-
Table 1: The 34 phenotypes collected from high-throughput RNA interference screens.
Full Name Embryonic lethal Slow post-embryonic growth Larval arrest Uncoordinated Sterile Protruding vulva Lethal Sterile progeny Reduced brood size Body morphological defects Sick Ruptured Dumpy Clear Egg-laying defect Thin Small
Short Name
Freq.
Full Name
EMB GRO LVA UNC STE PVL LET STP RBS BMD SCK RUP DPY CLR EGL THIN SMA
0.52 0.43 0.37 0.33 0.26 0.18 0.17 0.14 0.13 0.10 0.093 0.080 0.077 0.074 0.056 0.040 0.037
Paralyzed Patchy appearance Sluggish appearance Long Adult lethal Molting defect Blistering of cuticle Pale High incidence of males Oocytes Roller Multivulva Kinker Unique phenotype Vulvaless Hyperactive Social
Short Name
Freq.
PRL PCH SLU LON ADL MLT BLI PALE HIM OOC ROL MUV KNK UNIQ VUL HYA SOC
0.037 0.035 0.030 0.026 0.025 0.016 0.016 0.0093 0.0072 0.0072 0.0063 0.0059 0.0013 0.0013 0.0013 0.0008 0.0004
Page 3 of 21 (page number not for citation purposes)
BMC Bioinformatics 2008, 9:463
http://www.biomedcentral.com/1471-2105/9/463
ing step to introduce a negligible amount of additional noise to the data, as the false-negative rate is likely to be much greater than the false-positive rate. The prevalence of a phenotype, or the frequency that it is recorded for knock-downs of genes in the genome, may provide important clues for predicting gene function. Differences in phenotype prevalence may reflect technical differences (some phenotypes may be more readily detectable), biological differences (some phenotypes may result from the inhibition of several different pathways), or a combination of both. Some phenotypes are observed for hundreds of knock-downs, while others are recorded for only a few (Table 1, Additional Data File 2). Other factors, such as the mutual correlations of phenotypes with one another, might also have influence on their use in predicting gene function. As each phenotype congruency metric will incorporate (or ignore) these sources of information to varying degrees, it is not obvious which metric is optimal for comparing genes based on their phenotypic profiles. Evaluation of phenotype congruency metrics A good congruency metric should assign high values to functionally-related gene pairs, while assigning low values to gene pairs which are not likely to have similar function.
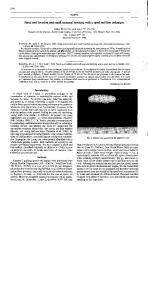
We calculated the phenotypic congruency between all gene pairs using 19 different metrics (Table 2), yielding a total of 2,821,500 pairwise congruency scores for each metric. We evaluated each metric based on its ability to capture associations between genes belonging to the same functional group. We used a collection of functional categories as an estimate of gene functional groups (see Methods). Category assignments created from mutant phenotype data were excluded to avoid circularity in our evaluation. We evaluated the functional coherence of each metric at the level of individual gene-gene links and at the level of gene neighborhoods. Functional coherence of metric links We first evaluated each metric by measuring how often two genes with congruent phenotypic signatures were functionally related. For a given metric, we linked two genes if their congruency score was above a threshold. We then calculated the precision of each metric for each threshold (see Methods). Overall, most metrics performed better than what would be obtained by sampling gene pairs randomly (dashed line labeled "Background" in Figure 2a). However, methods which give equal or greater weight to shared absent phenotypes (compared to shared present phenotypes) performed worse than random guessing at more stringent thresholds. For example,
Table 2: 19 metrics evaluated for their ability to identify functionally-related genes from knock-down phenotypes. See methods for mathematical definitions of each metric.
Metric
Typea
MatchPresent MatchAbsent Match Pearson Correlation Coefficient (PCC) Uncentered Pearson Correlation (UPC) UPC 2+ Mutual Information (MI)
P A P, A P, A P, A P, A P, A
Description
Counts the number of matching present phenotypes. Counts the number of matching absent phenotypes. Counts the number of matching present and absent phenotypes. Vector correlation coefficient. Same as PCC, with vector means set to 0. Used for network construction in [9]. Same as UPC, restricting to gene pairs sharing two or more phenotypes. Measures the degree to which knowledge about one gene's phenotypes reduces the entropy of another's. Euclidean Distance P, A The "straight line" distance between two vectors. Jaccard Index P, A The number of matching present phenotypes divided by the number of phenotypes present in either gene. Frequency Dot Product (FDP) P, F Scales the number of matching present phenotypes by the frequency of each phenotype. Normalized FDP (nFDP) P, F Same as FDP, but normalized by the lengths of the phenotypic signature vectors. Residual FDP (rFDP) P, F Same as FDP, scaled by a score obtained by drawing random phenotypes from a Poisson distribution. Symmetric FDP (sFDP) P, A, F Same as FDP, but rewards for matching absent phenotypes as well as matching present phenotypes. The PhenoBlast Metric P, A, F Ranking system used by PhenoBlast (Gunsalus et al. 2004). First ranks gene pairs by MatchPresent, then by MatchAbsent, then by a metric similar to FDP. Agreement Score (AGREE) P, A, F Scales the number of matching present and absent phenotypes by their frequencies across all genes [8]. Weighted MatchPresent (wMatchPresent) P, C Same as MatchPresent, but incorporates weights. Pairwise FDP (pFDP) P, F, C Weights by present phenotype background pairwise co-occurences. Weighted FDP (wFDP) P, F, C Same as FDP, but incorporates weights. Weighted AGREE (wAGREE) P, A, F, C Same as AGREE, but incorporates weights. a:
The metric type indicates whether the metric rewards for shared present phenotypes (P), rewards for shared absent phenotypes (A), factors in frequencies of phenotypes across all genes (F), and/or factors in pairwise co-occurrence of phenotypes across all genes (C).
Page 4 of 21 (page number not for citation purposes)
BMC Bioinformatics 2008, 9:463
http://www.biomedcentral.com/1471-2105/9/463
A.
B.
Figure 2 of metrics A. Gene network precision Evaluation Evaluation of metrics A. Gene network precision. The precision of the top-scoring gene pairs is shown for each evaluated metric (see Methods). A. Gene pair precision (y-axis) is plotted against the number of top-scoring gene pairs for the given metric (x-axis). Metrics discussed in the text are displayed as bold lines. The dashed line indicates the background precision of all gene pairs in the dataset. B. Gene neighborhood functional coherence. The 25 most similar genes to each query gene were identified using each evaluated metric. The precision of these 25 gene pairs was calculated using the evaluation set. Shown is the number of query genes with high precisions (> 0.25) for information-based (black bars) and non information-based metrics (gray bars).
Page 5 of 21 (page number not for citation purposes)
BMC Bioinformatics 2008, 9:463
MatchAbsent (which rewards solely for shared absent phenotypes), Match (which rewards for shared present and absent phenotypes), PCC (Pearson Correlation), and UPC (Uncentered Pearson Correlation) all perform worse than random for networks containing 30,000 or fewer links. These results indicate that, although some information might be conveyed, shared absent phenotypes are likely to be less informative than shared present phenotypes. Information-theoretic metrics, led by the Agreement Score (AGREE, see Methods), consistently outperformed the other metrics at most levels of network size, where network size was measured either as the number of links (Figure 2a) or as the number of genes (Additional Data File 3a). For example, when considering the top 10,000 scoring gene pairs of each metric, AGREE resulted in gene pairs with a precision of 0.16, which is significantly higher than previously published methods such as The PhenoBlast Metric (0.14, P < 10-3, proportions test) and UPC (0.07, P < 10-5). An evaluation of the same metrics in Saccharomyces cerevisae using genome-wide phenotype data downloaded from the Saccharomyces Genome Database [22] produced similar results (see Additional Data File 3b). As in worm, the information-based metrics connect yeast genes more likely to share functional relatedness compared to correlation, Euclidean distance, and counting based metrics. The metric with the second-best performance was The PhenoBlast Metric [17], which first ranks genes around a query gene using the MatchPresent metric, then ranks ties using the MatchAbsent metric, and any remaining ties by an information-based metric similar to the Frequency Dot Product (FDP). It is likely that The PhenoBlast Metric's ability to improve upon the MatchPresent metric is due to its incorporation of phenotype background frequencies into the tiebreaking step of its scoring scheme. Conversely, the UPC metric [9] performed poorly. As indicated by the location of the peak of the UPC line, the highest UPC precision was not obtained at the highest UPC value. This might be due to UPC linking perfectly correlated genes that share only a single frequent phenotype. Functional coherence of metric neighborhoods The functional coherence of gene pairs may be influenced by noise in the phenotype data. In order to obtain another, possibly more robust estimate of coherence than what is obtained from individual links, the functional coherence of gene neighborhoods was also assessed. Gene neighborhoods were induced for each metric by using each gene in the dataset as a query and identifying the 25 most similar genes. For each metric, we then plotted the number of gene neighborhoods with high precision (> 0.25, Figure 2b). Most metrics resulted in a similar number of high-precision neighborhoods. The AGREE
http://www.biomedcentral.com/1471-2105/9/463
metric resulted in the second highest number (317 neighborhoods), which is eight fewer than the similar Weighted AGREE metric. Similar results were obtained when using neighborhoods of different sizes, and when comparing the mean precision across query genes instead of the number of high precision genes (Additional Data File 3c). AGREE performed substantially better than The PhenoBlast Metric (278 neighborhoods), which is implemented in an online utility for the identification of gene neighborhoods with phenotypic signatures similar to a query gene [17]. Bootstrap estimates indicate that AGREE significantly outperformed The PhenoBlast Metric (P < 0.05, see Methods), suggesting that PhenoBlast's ranking algorithm might be improved by using the AGREE metric instead of its current approach. Investigation of the advantages of information-based metrics Information-based metrics reward gene pairs for sharing both present and absent phenotypes while factoring in their background frequencies. To understand why these metrics produced higher functional coherence, we identified example gene pairs where the information-based measures produced high similarity while the correlationbased approach produced low similarity, and vice versa.
Gene pairs illustrating each case are shown in Figure 1. Consider again the functionally-unrelated gene pair his-48 and sqv-4 (Figure 1c), which share only the frequentlyoccurring 'Embryonic lethal' phenotype. This pair receives a poor AGREE score (rank 517,524 out of 2,821,500 total gene pairs), while it receives the best possible UPC score. This illustrates that the incorporation of background frequencies may help to reduce false positive gene pair associations. Conversely, the phenotypic signatures of sqt-3 and dpy-17, two related collagen-associated genes, have several mismatches (Figure 1d). Nevertheless, the AGREE metric ranks the pair in the 99th percentile (4,336 out of 2,701,650 total pairs), because the genes share two relatively rare phenotypes: 'Dumpy' (Dpy) and 'Roller' (Rol). In contrast, this gene pair is assigned a poor rank by UPC (831,561). This second example demonstrates that the incorporation of phenotype background frequencies can help in the identification of true-positives. Thus, the combination of reducing false-positives by down-weighting frequent phenotype coincidence and reducing false-negatives by up-weighting shared rarely occurring phenotypes may contribute to the ability of information-based methods to identify functionally similar gene pairs. The differences in performance of the various metrics may be due to their use of properties of the phenotypes which vary in their ability to predict shared gene function. Different metrics may make either explicit or implicit use of such properties in their ability to connect functionallyrelated genes. To gain insights into what makes one metric
Page 6 of 21 (page number not for citation purposes)
BMC Bioinformatics 2008, 9:463
better than another, we considered three properties and found that the frequency of shared function between two genes 1) increases with increasing number of shared present phenotypes; 2) increases with increasing number of shared rare present phenotypes; and 3) is unaffected by correlations between phenotypes (see Additional Data File 4). Network topology comparison Based on its high performance relative to the other information-based metrics, we chose the AGREE metric to help provide novel insights into the systems biology of C. elegans. We compared a phenotype congruency network constructed using the AGREE metric (ANET) to a network constructed with a previously published method. In a recent study, Gunsalus and colleagues demonstrated the utility of combining phenotype congruency with other high-throughput data for the identification of 'molecular machines' [9]. The authors constructed a UPC-induced phenotype congruency network (UNET) by linking gene pairs with UPC values of 0.50 or higher. Due to our larger dataset, a UPC threshold of 0.50 results in a network in which a quarter of all possible gene pairs are connected, which is not specific enough for practical use. Therefore, we constructed the UNET by linking genes with UPC scores exceeding 0.866, which corresponds to a UPC significance of P < 0.01 (see Methods). We chose an AGREE threshold such that the same number of gene pairs (32,530) was included in the ANET. The resulting networks have precisions of 0.13 (ANET) and 0.07 (UNET).
We first compared general topological features of the networks. We found that the ANET and UNET exhibit different connectivity. On average, genes in the ANET are linked to 53 other genes (+/- 47), while genes in the UNET are linked to 34 other genes (+/- 49). The ANET is comprised of one large connected component containing 1,202 genes, and six smaller connected components containing the remaining seventeen genes. In contrast, the UNET is comprised of a large connected component, containing 601 genes (25% of the original gene set), and 159 smaller components, all but eight of which are fully connected. 17 of the fully-connected UNET components (11%) consist of gene pairs with identical phenotypic signatures that contain only a single knock-down phenotype, which results in a perfect UPC score. For example, the largest connected components include a component of 173 genes whose knock-downs result solely in an 'Embryonic lethal' (Emb) phenotype, a component of 99 genes with only a 'Slow post-embryonic growth' (Gro) phenotype, and a component of 50 genes with only an 'Uncoordinated' (Unc) phenotype. These gene pairs which share only a single frequently-occurring phenotype are unlikely to be co-functional, as evidenced by the precisions of
http://www.biomedcentral.com/1471-2105/9/463
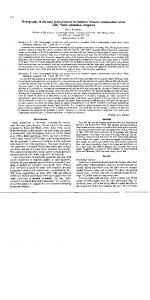
these connected components (0.07, 0.04, and 0.08, respectively). We next sought to compare the number of shared present phenotypes between genes linked in the ANET and UNET. To quantify this, we define the complexity of a link to be the total number of present phenotypes co-induced by a pair of genes. We refer to a link with a complexity of two or more as a complex link, and otherwise a simple link. We found that the ANET connects genes exhibiting a higher number of phenotypes than genes connected in the UNET (Figure 3a). Most of the links in the ANET are complex (median complexity of four), while most links in the UNET are simple (median complexity of one). The ANET contains a total of 330 simple links (1% of the network), where each simple link connects genes sharing one rare phenotype (phenotype frequency < 4%). Conversely, there are 23,375 simple links (72% of the network) in the UNET. Almost two-thirds (14,878) of these links connect genes sharing the 'Embryonic lethal' phenotype (Emb). We also measured the complexity of the UNET after removing simple links from consideration. The resulting UNET still contained links with lower complexity than the ANET (black bars, Figure 3a). Additionally, for each level of complexity, the ANET contains gene pairs with higher precision than the UNET (Figure 3b). These results indicate that AGREE not only identifies links of higher complexity, but also links of greater biological relevance. The networks induced by AGREE and UPC are orthogonal, having little overlap in their gene pairs (only 1,909 links, or 5.8% of the networks). These shared links have a precision of 0.158. The links unique to the ANET have a precision of 0.134, whereas links unique to the UNET have a precision of 0.075, which is significantly less than the precision of the shared links (P < 10-38, proportions test). Taken together, these results indicate that the AGREE metric not only identifies many gene associations that are missed by the UPC metric, but also finds associations that are of an overall higher quality. While the set of gene pairs in the ANET and UNET are different, it was still possible that the metrics brought genes into proximity from the same pathways, albeit through different gene pairs. However, we found that pathways containing high-scoring AGREE gene pairs are largely not the same as the pathways containing high-scoring UPC gene pairs. We created a non-redundant set of functional categories from our evaluation set, and calculated the significance of the pairwise scores of its gene members for each category using the AGREE and UPC metrics (see Methods). This calculation assigns high scores to categories whose gene members have significantly similar phenotypic signatures according to the metric. Figure 4 plots the highest significance achieved for each non-redundant
Page 7 of 21 (page number not for citation purposes)
BMC Bioinformatics 2008, 9:463
http://www.biomedcentral.com/1471-2105/9/463
A.
B.
C.
D.
Figure 3 and subnetwork comparisons Network Network and subnetwork comparisons. Key is shown in the upper left-hand panel. A. AGREE links join genes with more shared present phenotypes. The x-axis indicates the link complexity, or number of shared present phenotypes. The y-axis indicates the frequency of occurrence of each link complexity bin. B. AGREE links have higher precision for every level of link complexity. The links of each network were binned by their complexity (x-axis). The y-axis indicates the precision of each bin for each network. Error bars indicate one standard deviation, assuming a binomial distribution. C. AGREE subnetworks are enriched for more phenotypes. The number of over-represented phenotypes present in the genes of each subnetwork (subnetwork complexity) was determined using the hypergeometric distribution (see Methods). The x-axis indicates subnetwork complexity. The y-axis indicates the frequency of the given subnetwork complexity in the ANET and UNET. D. A greater number of AGREE links are supported by other data types. The x-axis indicates the data type. The y-axis indicates the number of links in the ANET and UNET which are supported by that data type. Error bars indicate one standard deviation, assuming a binomial distribution.
Page 8 of 21 (page number not for citation purposes)
BMC Bioinformatics 2008, 9:463
http://www.biomedcentral.com/1471-2105/9/463
Ribosome
Anion transport
Embryonic development*
rRNA metabolic process
Anatomical structure formation Golgi vesicle transport Protein-RNA complex assembly
Cofactor metabolic process Oxidative phosphorylation Nuclear transport Cellular biosynthetic process
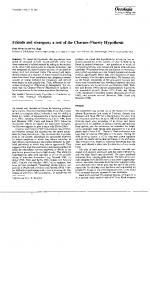
Figure 4 of AGREE and UPC scores within functional categories Comparison Comparison of AGREE and UPC scores within functional categories. Each point represents one functional category, and indicates the negative log significance of the pairwise scores of all genes within that functional category using the AGREE (xaxis) and UPC metrics (y-axis). Dashed lines indicate significances of P < 0.01 or better. Categories were taken from the evaluation set, and were filtered to ensure that no two categories overlap by greater than half of their gene members (see Methods). * 'Embryonic development' is short for 'Embryonic development ending in birth or egg hatching.'
Page 9 of 21 (page number not for citation purposes)
BMC Bioinformatics 2008, 9:463
category using each metric. Overall, three housekeepingrelated categories were enriched for high scores using both metrics:'Ribosome', 'rRNA metabolic process', and 'protein-RNA complex assembly.' 20 classes were exclusively enriched for AGREE, and 16 were enriched only for UPC (Additional Data File 5). Overall, the AGREE metric captured several categories involved in development and cell structure, while the UPC metric identified categories involved in translation and other protein expressionrelated activities. Thus, the genes that are brought into proximity by the two metrics largely belong to complementary biological processes. Comparison of subnetworks Decomposing large interaction networks into their constituent subnetworks has proven useful for the elucidation of genetic pathways [23]. As the majority of links in the ANET and UNET connect different pairs of genes, we investigated how the different link content of the networks could influence subnetwork identification, which in turn could influence the prediction of functional modules. To detect subnetworks, we used the MODES algorithm [24] (see Methods), and identified a total of 37 ANET subnetworks and 107 UNET subnetworks. ANET subnetworks contained 33 genes on average (+/- 20), while UNET subnetworks were smaller, containing 14 (+/ - 21) genes. For each UNET subnetwork, we determined if its genes had a significant number of links in the ANET. The density of the links within a subnetwork was assessed using a connectivity score calculated as the fraction of links connecting the genes of the subnetwork out of the total possible number of such links. The significance of the score was estimated for each subnetwork size using a random sampling procedure (see Methods).
As expected, the ANET and UNET share many small (7 +/ - 6 genes), low-complexity (2.6 +/- 1.3) subnetworks in which the genes share one or two rare phenotypes. Even though the number of shared subnetworks amounts to half (51 out of 107) of the subnetworks identified in the UNET, the total fraction of network links included in these subnetworks is small (approximately 5%). The subnetworks unique to the UNET are much larger (21 +/- 27 genes) and lower in complexity (2.1 +/- 1.1), whereas the majority of ANET subnetworks are enriched for five or more phenotypes (Figure 3c). The overall difference in complexities is significant based on bootstrap resampling (P < 10-12, see Methods). Thus, both the ANET and UNET produce a similar number of small subnetworks of genes sharing a single rare phenotype. However, the majority of genes and links in the UNET reside in large subnetworks that are not well-connected in the ANET.
http://www.biomedcentral.com/1471-2105/9/463
Integration into a C. elegans genetic network Previous studies have demonstrated the utility of combining phenotype congruency data with other data types in order to identify functional relationships [8,9,13,25]. We investigated how the ANET integrates with other data types, including interactions based on coexpression, protein-protein interactions, and a compendium of lowthroughput genetic interactions (see Methods). To this end, we took the union of all of these interactions with the ANET links to create a superimposed AGREE network (available as Additional Data File 6). In an identical manner, a superimposed UPC network was constructed using UNET links.
We first investigated AGREE's ability to identify gene associations supported by other data sources and found that significantly more ANET links were multiply-supported links (present in multiple data sources) compared to UNET links (23% increase, see Figure 3d and Additional Data File 6). Furthermore, the ANET performs comparably to, or better than, the UNET for each data type considered separately (Figure 3d). In a manner similar to the approach by Gunsalus et al. [9], we restricted our analysis to multiply-supported links. This revealed that only 81 of 412 (20%) multiply-supported ANET links were also supported by UNET links. The 412 multiply-supported ANET links have a precision of 0.607, while the 336 multiplysupported UNET links have a precision of 0.485. Thus, the multiply-supported ANET contains gene interactions that are different from, but of higher quality than, the multiply-supported UNET. We next searched for gene modules composed of multiple data types that are undetectable using the UPC metric. We first identified multiply-supported subnetworks (MSSNs) using previously published methods [8] (see Methods). A total of 29 AGREE and 50 UPC MSSNs were identified with phenotype congruency links as one of the enriched link types (provided in Additional Data File 7). Many of these MSSNs represent functionally coherent gene groups, as 27 (93.1%) AGREE MSSNs and 47 (94.0%) UPC MSSNs are enriched for at least one category in our validation set (see Methods). 14 of the AGREE MSSNs represent novel gene combinations with respect to the UPC metric (see Methods and Additional Data File 7). All of these unique subnetworks are enriched for at least one functional category, indicative of their potential in the discovery of novel gene modules. Module MSSN278 (Figure 5a) contains ten genes, seven of which are annotated as being involved in ribosomal biogenesis. Many of the genes in this module are components of the core translational machinery. Other genes in the module are predicted to be necessary for ribosome synthesis, including byn-1 [26], K07C5.4 [27], and eif-3.F [27].
Page 10 of 21 (page number not for citation purposes)
BMC Bioinformatics 2008, 9:463
A.
http://www.biomedcentral.com/1471-2105/9/463
B.
Super imposed Networ k
AGREE MSSN278
Multiply-suppor ted Networ k
AGREE MM6
Figure 5 with other data sources Integration Integration with other data sources. Link colors indicate interaction type: Green, AGREE phenotype congruency; Blue, UPC phenotype congruency; Purple, protein-protein; Red, co-expression; Orange, genetic. A. Superimposed network. Superimposed network created from multiple data sources. Shown below is a multiply-supported subnetwork identified in the superimposed network. B. Multiply-supported network. Network created from restricting to links supported by multiple data sources. Shown below the network is one 'molecular machine', identified as a subnetwork in the multiply-supported network.
Furthermore, two of the three genes that are not annotated with ribosomal function or biogenesis are predicted to be involved in translation. hrs-1 is a predicted histidyltRNA synthetase, and cct-6 (Chaperonin Containing TCP1) is a cytosolic chaperonin involved in folding of nascent proteins [27,28]. Since many developmental pathways are regulated by translation, it is not surprising that disruption of the genes in this module results in multiple severe phenotypes such as 'Sterile', 'Embryonic lethal', 'Larval
arrest', 'Slow growth', and 'Sick'. Thus, the AGREE metric correctly identifies components of the translational machinery which the UPC metric is unable to identify, due to the multiple phenotypes of the genes in this module being present in slightly differing combinations. We also identified modules of densely connected genes in the multiply-supported superimposed network using a module discovery method similar to the method used by
Page 11 of 21 (page number not for citation purposes)
BMC Bioinformatics 2008, 9:463
Gunsalus and colleagues to detect 'molecular machines' [9]. We identified a total of 112 molecular machines, and labeled them with the prefix 'MM' (Additional Data File 7). Module MM6 (Figure 5b) contains seven body morphology-related genes with similar phenotypic signatures supported by multiple functional sources. Three of the genes in the module, sma-3 (Smad) [29], sma-6 (type I TGF-β receptor) [30], and sma-4 (Smad) [29] are TGF-β pathway components that play a role in body size and male tail development. Both gei-17(GEX Interacting protein) and pdi-3 (Protein Disulfide Isomerase), are thought to regulate tissue morphology [31]. The presence of the 'Small' phenotype and, importantly, the lack of other common phenotypes, enables AGREE to connect genes that regulate different aspects of morphology which are missed by UPC. UPC fails to connect most of the sma genes because some of them are also annotated with the 'Dumpy' phenotype, and others are not. Finally, we estimated the predictive influence of adding phenotype congruency links to the integrated C. elegans network of Lee et al. (2008) [32]. We found that the loglikelihood scores (LLS) placed significantly more weight on the AGREE-derived links, as compared to the UPCderived links (see Additional Data File 8 for the regression of each metric onto the LLS score). 388 AGREE links were above the LLS cutoff of 1.5, and would therefore be included into the Lee et al. network. In contrast, none of the UPC links have sufficiently high LLS scores on their own to merit inclusion. Nearly all of the AGREE links (384 out of 388) represent new connections into the Lee et al. integrated network. Thus, the phenotypes provide a small, but appreciable set of new connections not elucidated by the combination of the other data sources.
http://www.biomedcentral.com/1471-2105/9/463
v. The component of the AGREE metric that rewards for shared present phenotypes is a sum over the set {IDFv}, while sFDP is a sum over {IDFv2}. Our results indicate that squaring the inverse frequencies may over-emphasize rare phenotypes. Thus, the exponent in the summation could be parameterized to give the generalized sum over the set {IDFvp}. For example, using this notation, Match corresponds to p = 0. The observation that Match outperformed sFDP indicates that one might find an improvement over the AGREE metric by optimizing p between 0 and 1. Likewise, a corresponding parameter could be optimized for the component of AGREE which rewards for shared absent phenotypes. Recently, approaches inspired by natural language processing (NLP) have been applied to a range of biological problems (reviewed in [33]). In this study, the task of finding related genes based on common phenotypic consequences can be likened to the task of identifying similar documents based on the presence and absence of particular words. Other studies have proposed NLP-based methods for protein interaction prediction (reviewed in [34]), protein subcellular localization prediction [35], prediction of gene function (reviewed in [36]), GO-based protein semantic similarity calculation [37], and the identification of candidate genes for complex traits [38]. For this study, we focused on the analysis of highthroughput RNAi phenotype data in C. elegans. Such data is currently also being generated for other species, most notably in S. cerevisiae (e.g. the morphological traits examined in [39]) and D. melanogaster (reviewed in [40]). Our results on S. cerevisiae (see Additional Data File 3b) suggest that metrics such as the ones evaluated in this paper may be useful for analyzing data from other species.
Discussion We compared the ability of several metrics to connect functionally related genes using high-throughput RNAi knock-down phenotype data. We found that the Agreement Score (AGREE) performed better than 18 other metrics in this regard. Additionally, with respect to the previously published UPC metric, the phenotype congruency network induced by the AGREE metric connects genes with more shared phenotypes, and contains more links that are supported by additional data sources. While the AGREE metric outperforms the metrics tested in this study, the results provide information about how it could be improved upon. For example, although the frequency of a phenotype does carry some information, placing too much weight on rare phenotypes may lead to erroneous functional predictions. This may explain why AGREE outperformed the similar information-based metric Symmetric Frequency Dot Product (sFDP). To illustrate, let IDFv be the inverse document frequency of phenotype
Finally, all of the metrics evaluated in this study are limited in the sense that they treat phenotypes as vectors, ignoring any known or latent relationships that may exist among the phenotypes. Rather than use binary presence/ absence calls, comparisons could make use of quantitative values representing "strengths" if replicates of gene-phenotype observations are available either within or across studies. Additionally, the introduction of more formal knowledge representations for C. elegans that describe is-a or part-of relations among phenotypes, such as the Mammalian Phenotype Ontology [41], may allow comparisons that incorporate semantic structure such as the work by Pesquita et al. (2008) [37].
Conclusion With the maturation of RNAi technology, it is now possible to knock down genes in a high-throughput manner. We found that an information-based measure, which we call the AGREE metric, outperforms other tested metrics
Page 12 of 21 (page number not for citation purposes)
BMC Bioinformatics 2008, 9:463
and that its use in the construction of a superimposed network containing data from several sources results in high quality predictions, many of which go undetected using other methods. Other measures of phenotype congruency that we did not test may outperform those tested in this study. Our results indicate that metrics borrowed from the field of natural language processing may prove useful in this domain. We suggest that metrics which incorporate the frequency of shared phenotypes, such as the AGREE metric, should be used in place of unweighted correlations for functional genomics analyses involving RNAi knock-down data.
Methods RNA Interference-Induced Phenotype Data An RNA Interference (RNAi)-induced phenotype compendium was assembled by compiling the results of three genome-wide RNAi studies: 30 phenotypes scored for 1,470 genes from [19]; 27 phenotypes scored for 1,778 genes from [21]; and 26 phenotypes scored for 1,066 genes from [20]. Several phenotype annotations in the datasets were converted to provide a uniform language which allowed the three datasets to be integrated. These conversions included labeling brood counts scored as "1– 5" and "6–10" as "Ste"; re-labeling "Ppz" as "Prl"; re-labeling "Lvl" as "Let"; labeling any embryonic lethal percentages over 10% as "Emb"; and re-labeling "Slm" and "Thn" as "Thin". In total, 34 phenotypes scored across 2,376 unique genes were collected from the three studies and recorded in a 2,376-by-34 RNAi phenotype matrix, K. Each entry in the matrix, Kiv, was set to 1 if RNAi against gene i produced phenotype v in at least one of the three studies and was set to 0 otherwise. We refer to each row in the matrix, Ki, as a phenotypic signature. Calculation of congruency metrics We calculated the similarity of phenotypic signatures using a variety of congruency metrics. For binary vectors such as those used in this study, several metrics are equivalent, including (Euclidean Distance and Canberra Distance) and (Match, Hamming Distance, and Rand Index). In such cases, the results of only one metric from each group are presented. Additionally, several metrics are conceptually and mathematically similar. In such cases, the metric with the highest precision curve (as shown in Figure 2a) was chosen for presentation. To simplify discussion, we group the metrics into four categories: match-based metrics, unweighted metrics, metrics weighted by phenotype frequencies, and metrics incorporating phenotype correlations.
To facilitate direct comparison, each pairwise similarity between genes i and j, s(i, j) was re-scaled to reside between zero and one:
http://www.biomedcentral.com/1471-2105/9/463
Re-scaled( s(i, j)) =
s(i, j)− min ( s(i, j) ) , max ( s(i, j) ) − min ( s(i, j) )
where min(s(i, j)) and max(s(i, j)) are the minimum and maximum unnormalized score computed across all gene pairs, respectively. All metrics tested were similarity measures, in which a higher score for a gene pair indicated a higher degree of relatedness. Match-based metrics One way to compare two phenotypic signatures is to count the number of matching phenotypes. We evaluated three such match-based metrics.
MatchPresent counts the number of matching present phenotypes between a gene pair: 34
MatchPresent(i, j) =
∑K
iv K jv .
v =1
MatchAbsent counts the number of matching absent phenotypes between a gene pair: 34
MatchAbsent(i, j) =
∑ (1 − K
iv )(1 −
K jv )
v =1
Match counts the number of matching present and absent phenotypes between a gene pair: 34
Match(i, j) =
∑K
iv K jv
+ (1 − K iv )(1 − K jv ).
v =1
Unweighted metrics We categorize metrics as unweighted if they operate on the input binary vectors without incorporating additional statistics on phenotype background frequencies or phenotype correlations. The following five unweighted metrics were tested. Pearson Correlation Coefficient (PCC) The Pearson Correlation Coefficient (PCC) measures the departure of two variables from independence. In our notation, the PCC definition is:
PCC(i, j) =
34 ∑ K iv − K i K jv − K j v =1 , 34 2 34 2 ∑ K iv − K i ∑ K jv − K j v =1 v =1
)(
(
(
)
)
(
)
where K i is the mean across the phenotypic signature of gene i. A positive value for a gene pair (i, j) indicates that the phenotypes present in gene i also tend to be present in
Page 13 of 21 (page number not for citation purposes)
BMC Bioinformatics 2008, 9:463
http://www.biomedcentral.com/1471-2105/9/463
gene j, and phenotypes absent in gene i also tend to be absent in gene j. Uncentered Pearson Correlation (UPC) The Uncentered Pearson Correlation (UPC) was used as a phenotype congruency metric for network construction in (Gunsalus et al. 2005). The UPC is the same as PCC, but does not center the vectors around their means. In our notation, the UPC definition is:
UPC(i, j) =
34 ∑ K iv K jv v =1 34 2 34 2 ∑ K iv − K i ∑ K jv − K j v =1 v =1
(
(
)
)
Mutual Information Mutual Information (MI) is an information theoretic quantity that expresses the mutual dependence between two random variables. It measures the degree to which knowledge about one random variable reduces the entropy of another random variable. In our notation, the mutual information is:
MI ( i, j ) =
1 34
1
1
∑∑N
ijab
a =0 b =0
⎛ 34 N ijab ⎞ ⎟, log 2 ⎜ ⎜ N ia N jb ⎟ ⎝ ⎠
where Nijab is the number of times genes i and j took on values a and b together, and Nia is the number of times gene i took on value a. For example, N11 is the number of present phenotypes of gene 1, and N1200 is the number of times gene 1 and gene 2 together had absent phenotypes. Euclidean Distance In our notation, the Euclidean Distance (Euclidean) between two phenotypic signatures in V-dimensional space, where V = 34, is: 34
Euclidean(i, j) =
∑( K v =1
iv
− K jv
)
2
.
We converted this metric to a similarity metric by using 1 – Re-scaled(Euclidean(i, j)).
Jaccard(i, j) =
34 ∑ K iv K jv v =1
34 ∑ K iv + K jv − K iv K jv v =1
(
)
.
Information-based metrics In this paper, information-based metrics are defined to be metrics that factor in the background frequency of matching present and absent phenotypes. To illustrate their utility, consider the scenario of scoring two pairs of genes: (A, B) and (B, C), where each pair of genes shares two present phenotypes and two absent phenotypes. Using a noninformation based metric, each pair of genes will receive an equivalent score, as each has an equal number of matches. Using an information-based metric, (A, B) will receive a poor score, as this pair shares present and absent phenotypes which occur more frequently (Figure 6a). Conversely, (C, D) will receive a high information-theoretic score, as the genes in the pair share less frequent present and absent phenotypes (Figure 6b).
For the following definitions, let fv denote the frequency of phenotype v across all genes in the knock-down matrix K. Agreement Score (AGREE) The Agreement Score (AGREE) measures the bits of information that are encoded in the phenotypes shared by two genes, and is defined as:
AGREE ( i, j ) =
34
∑ S (i, j, v) + S (i, j, v), p
a
v =1
where
⎛ 1 ⎞ S p (i, j, v) = K iv K jv log 2 ⎜ ⎟ ⎝ fv ⎠ and
S a (i, j, v) = ( 1 − K iv
⎛
1 ⎞ ⎟. ⎝ 1− f v ⎠
) ( 1 − K jv ) log 2 ⎜
Sp and Sa reward a gene pair for shared present and absent Jaccard Index The Jaccard Index (Jaccard) is commonly used in clustering applications. It compares the number of shared present phenotypes to the number of phenotypes present in either gene:
phenotypes, respectively. AGREE was used in the construction of a C. elegans phenotype network, and called Loss-of-Function Agreement Score in[8]. If RNAi produces phenotype v in two genes, the AGREE score will increase by log 2
( ) bits. The log ( ) term is known as the 1 fv
2
1 fv
Inverse Document Frequency (IDF), which is often used in natural language processing applications [42]. Page 14 of 21 (page number not for citation purposes)
BMC Bioinformatics 2008, 9:463
A.
Pheno 1
http://www.biomedcentral.com/1471-2105/9/463
Pheno 2
Pheno 3
Pheno 4
Gene A
Poor informationbased score
Gene B Frequency of presence
B. Gene C Gene D
Frequency of absence Pheno 1
Pheno 2
Pheno 3
Pheno 4
Good informationbased score Figure 6 of frequency-weighted phenotype congruency Illustration Illustration of frequency-weighted phenotype congruency. The distance between points reflects the relative number of genes that share (or lack) the corresponding phenotype. Phenotypic signatures for a single gene are represented as a line; phenotypes correspond to individual vertical bars. The length of the gray area in a phenotype's bar is proportional to its frequency. The presence of a phenotype for a gene is indicated by drawing a point at the extremes of the shaded area for the phenotype. The total distance between the lines reflects the relative dissimilarity of the gene pair. A. Two genes which share frequently occurring present and absent phenotypes, and so would receive a poor information-based score. B. Two genes which share rare present and absent phenotypes, and so would receive a good information-based score.
Frequency Dot Product (FDP) The dot product is frequently used to measure the similarity between two IDF vectors [42], and is here referred to as the Frequency Dot Product (FDP). FDP weights each present phenotype shared between two genes by the frequency of occurrence of that phenotype across all genes. We define the FDP as:
FDP ( i, j ) =
34
∑ S (i, j, v) , 2
p
v =1
where Sp is defined as above for AGREE.
Page 15 of 21 (page number not for citation purposes)
BMC Bioinformatics 2008, 9:463
http://www.biomedcentral.com/1471-2105/9/463
Symmetric FDP We also define the Symmetric FDP (sFDP) to reward shared absent phenotypes in the same way as shared present phenotypes. In our notation this measure is defined to be:
sFDP ( i, j ) =
types like 'Embryonic lethal' and 'Lethal' phenotypes. We define pFDP as: 34
pFDP(i, j) =
34
∑ S (i, j, v) p
2
34
∑ ∑ ⎡⎣ S
co − p (i,
u =1 v = u +1
+ S a (i, j, v) 2 ,
2
j, u, v) − λ b(i, j) ⎤⎦ ,
where
v =1
where Sp and Sa are defined as above for AGREE. Normalized FDP The Normalized FDP (nFDP) is equivalent to FDP, except that the measure is normalized by the lengths of the two vectors:
nFDP(i, j) =
FDP(i, j) Ki × K j
.
Residual FDP The Residual FDP (rFDP) is frequently used for the identification of relevant terms in Natural Language Processing [42]. The rFDP is defined to be the difference between the FDP score of a gene pair and its expected FDP score as given by a Poisson distribution. In our notation, the rFDP between two phenotypic signatures is: 34
∑ ( Sp(i, j, v) − Spenalty(v) )
and 34
∑ S (i, j, v).
b(i, j) =
p
v =1
nFDP is the cosine similarity measure computed on IDFweighted vectors. Normalizing the dot product by the lengths of the vectors penalizes gene pairs which cause many knock-down phenotypes.
rFDP ( i, j ) =
⎛ 1 ⎞ S co − p (i, j, u, v) = K iu K ju K iv K jv log 2 ⎜ ⎟ ⎝ f uv ⎠
2
Sp is defined as above for AGREE, and fuv is the background co-occurrence of phenotypes u and v. The second term in the pFDP equation corrects phenotype pairings by the background frequency of each present phenotype. We used a value for β equivalent to half the number of shared present phenotypes between genes i and j. Weighted FDP The Weighted FDP (wFDP) is similar to FDP, but each matching present phenotype is inversely weighted to its co-occurrence with other matching present phenotypes across all genes. We calculated the wFDP of a gene pair as
wFDP ( i, j ) =
34
∑w
ijv S p (i,
j , v) 2 ,
v =1
,
where Sp is defined as above for AGREE.
v =1
where Sp is defined as above for AGREE, and
⎛ ⎞ 1 S penalty (v) = K iv K jv log 2 ⎜ ⎟. ⎝ 1− e − f v ⎠ The PhenoBlast Metric The PhenoBlast Metric is used to rank genes based on the similarity of their phenotypic signatures to the profile of a query gene. This method first ranks genes by the MatchPresent metric, then by the MatchAbsent metric, and finally by a metric similar to the FDP metric, as defined in [17]. Metrics factoring in phenotype correlations Pairwise FDP The Pairwise FDP (pFDP) rewards gene pairs that share rarely co-occuring present phenotypes. pFDP thus incorporates a correction based on phenotype correlation. For example, it gives a higher score to genes sharing rarely cooccuring pairs of phenotypes like 'Long' and 'Ruptured' compared to a pair sharing commonly co-ocurring pheno-
The weights wijv are pre-computed across all genes as: 34
w ijv =
∑K
iv K jv K iw K jw
w =1
1 , f vw
where fvw is the background co-occurrence of phenotypes v and w. Weighted MatchPresent The Weighted MatchPresent metric (wMatchPresent) counts the number of matching present phenotypes between a gene pair, weighting each shared present phenotype by the degree to which it does not co-occur with other shared present phenotypes across all genes: 34
wMatchPresent(i, j) =
∑w
ijv K iv K jv .
v =1
The weights wijv are pre-computed across all genes as described above for Weighted FDP.
Page 16 of 21 (page number not for citation purposes)
BMC Bioinformatics 2008, 9:463
http://www.biomedcentral.com/1471-2105/9/463
Weighted AGREE The Weighted AGREE metric (wAGREE) weights each phenotype by the degree to which it does not co-occur with other matching phenotypes across all genes:
wAGREE ( i, j ) =
34
∑w
ijv S p (i,
j, v) + z ijv S a (i, j, v),
Determination of metric link precisions For a metric, the highest-scoring k gene pairs present in the union of the genes in the positive and negative sets were assigned a precision score:
precision(k) =
v =1
where Sp and Sa are defined as above for AGREE. The weights wijv are pre-computed as described above for Weighted FDP. The weights zijv are calculated in the same way as the weights wijv, but for matching absent phenotypes instead of matching present phenotypes (i.e. counting matching zeroes in each phenotypic signature instead of ones). Evaluation set We evaluated each congruency metric by assessing its ability to link gene pairs known to share a similar function. We created positive and negative evaluation sets from biological process annotation databases. The positive set consisted of the union of the set of all gene pairs that share a common category in any of the three following sets: 1) C. elegans Gene Ontology (GO) [43] process categories containing 200 or fewer genes, restricting to gene associations not created from C. elegans knock-down phenotype data (i.e. removing all gene/category associations with the "inferred from mutant phenotype" (IMP) evidence code); 2) GO process categories of size 200 or smaller mapped from H. sapiens, M. musculus, D. melanogaster, and S. cerevisiae. Orthology mappings were created from reciprocalbest BlastP [44] hits; or 3) genes in C. elegans metabolic pathways, as reported in the Kyoto Encyclopedia of Genes and Genomes [45]. Because more than 26,000 C. elegans GO associations based on mutant phenotypes were removed to reduce circularity in the evaluations, we included GO annotations predicted from other species in order to increase the size of the effective positive set. While the inclusion of GO annotations from other species is likely to result in an increase in false positives, we do not expect them to be introduced in such a manner that would bias one metric in favor of another.
The negative evaluation set consisted of the union of the sets of all gene pairs contained in any GO process, Orthologous GO process, or KEGG category, removing any pairs that are members of the positive set. Considering only gene pairs for which each gene has a phenotypic signature, we obtained a total of 196,122 positives and 2,270,353 negatives. A total of 355,025 gene pairs were not present in either set, and so were not used for evaluation purposes.
|pos k | , |pos k |+|neg k |
where |posk| is the number of gene pairs from the positive evaluation set in the top k gene pairs, |negk| is the number of gene pairs from the negative evaluation set in the top k gene pairs, and k ranges from 2,500 to 100,000, in increments of 2,500. Determination of the significance of the difference between the gene neighborhood functional coherence of the AGREE and PhenoBlast metrics Using each gene as a "query gene", we identified the genes with the top 25 most similar phenotypic signatures using each metric. We calculated the precision of each query gene as described above. Query genes with precisions over 0.25 were considered to be "high precision queries."
We defined Dreal to be the difference between the number of high precision queries using the AGREE metric and The PhenoBlast Metric. We defined Drand to be the difference between the number of precisions selected randomly with replacement from the distributions of AGREE and PhenoBlast Metric precisions. The significance of Dreal was estimated by comparing to the mean (μrand) and standard deviation (σrand) computed across 10,000 Drands, using a standard Z-score transformation:
Z=
D real − μ rand . σ rand
Construction of Networks We constructed a UPC network (UNET) and an AGREE network (ANET) of equal size by linking gene pairs exceeding a threshold for each metric. We chose a UPC threshold of 0.8663, which corresponded to a significance level of P < 0.01 for all gene pairs. This significance level was calculated using the Z-score obtained from the mean and standard deviation of the UPC metric score across all gene pairs. A total of 32,530 gene pairs exceeded this threshold. We chose a corresponding normalized AGREE threshold (0.3531) such that the same number of gene pairs were present in its network. Creation of non-redundant functional categories To compare the functional categories captured by the AGREE and UPC metrics, we created a set of non-redundant categories. This set was created by first sorting all categories present in the positive evaluation set in order of decreasing size (to capture broader categories). Starting at
Page 17 of 21 (page number not for citation purposes)
BMC Bioinformatics 2008, 9:463
the top of this list, each category was included in the final non-redundant set only if its gene members did not overlap an already-included category by 50% or more. Comparison of functional categories captured by AGREE and UPC For each non-redundant functional category c in our evaluation set, we calculated the mean pairwise score of all gene pairs contained in that category, μc, using both the AGREE and UPC metrics. For a category containing nc genes, we assessed the significance of μc by comparing to the mean and standard deviation of μc calculated across 10,000 random gene sets of size nc and performing a standard Z-score transformation. Identification of subnetworks We identified subnetworks in each network by running MODES [24] with settings (d = 0.50, s = 80, c = 0.80, g = 4). Settings were chosen such that all subnetworks contained at least four genes, with a minimum connectivity of 50%. Determination of the significance of the difference between the number of enriched phenotypes within ANET and UNET subnetworks We identified enriched phenotypes within each subnetwork using the hypergeometric distribution (with a cutoff of P < 0.01). To assess the significance of the difference in the distributions of the number of enriched phenotypes in the ANET and UNET subnetworks, we compared the difference of their means across all subnetworks. We sampled with replacement 10,000 times from the distributions of enriched phenotype counts for both the ANET and UNET subnetworks, calculating their difference each time. We then calculated the standard deviation of the 10,000 differences. Finally, we performed a Z-score transformation by dividing the true difference in the means by this standard deviation. Construction of superimposed networks We constructed superimposed networks from several large-scale interaction datasets, including a C. elegans protein-protein interaction network [46], a eukaryotic protein interaction network that augments the C. elegans protein interaction network with orthologous interactions (interologs) mapped from S. cerevisiae, D. melanogaster, and human protein interactions contained in BioGRID [47], an mRNA coexpression network constructed from C. elegans, S. cerevisiae, D. melanogaster, and human expression data [48,49], and genetic interactions identified from low-throughput experiments that were collected from the literature by WormBase [50]. All interactions assembled from organisms other than C. elegans were mapped to predicted worm ortholog pairs using BLASTP [44] with a significance cutoff of P < 10-30.
http://www.biomedcentral.com/1471-2105/9/463
Identification of novel subnetworks Subnetworks identified in the ANET, UNET, and superimposed network were automatically inspected to determine which types of data significantly link their gene members. For each subnetwork, the significance of the number of links of a specific data type t connecting two genes within the subnetwork was calculated using a connectivity significance score. The connectivity significance score for data type t for a subnetwork containing n genes was calculated as a standard Z-score (lt - μt)/σt, where lt is the observed number of links in the subnetwork of type t, and μt and σt are the mean and standard deviation of the number of links across 1,000 random collections of n genes taken from the network constructed from data type t. Subnetworks were annotated as enriched for a data source if the connectivity score had an associated P-value of 0.01 or less. Novel UNET subnetworks were identified as subnetworks enriched for UNET links, but not enriched for ANET links. Novel AGREE multiply-supported subnetworks were identified as subnetworks enriched for ANET links and at least one other link type, while remaining unenriched for UNET links. Determination of enriched subnetwork functional annotations We assigned putative functions to subnetworks by determining their overlaps with categories in our positive validation set. We assessed the significance of the overlap of each subnetwork to a category, c, using the P-value obtained from the hypergeometric distribution:
⎛ n c ⎞⎛ n s − n c ⎞
ns ⎜ n ⎟⎜ N − n ⎟ b ⎠, ⎝ b ⎠⎝ P( X ≥ k) =
∑ i=k
⎛ ns ⎞ ⎜ ⎟ ⎝N ⎠
where nb is the number of genes present in both the subnetwork and the category, ns is the size of the subnetwork, nc is the size of the category, and N is the number of genes in any category. We estimated hypergeometric P-values using the approximation implemented in R. Calculation of the significance of the deviation of observed phenotype frequency/precision pairs from expected values To evaluate the intuition that rarer phenotypes might be more informative than frequent phenotypes, we calculated the precision of all pairs of genes displaying each knock-down phenotype using our validation set. We then plotted the precision of each phenotype as a function of its overall background frequency across all genes. To assess the significance of the trend for rarer phenotypes to be more informative, we divided this space into four quadrants based on high/low precision and high/low background frequency. Note that these quadrants corre-
Page 18 of 21 (page number not for citation purposes)
BMC Bioinformatics 2008, 9:463
spond to those displayed by the dashed lines in Additional Data File Figure 4b. Any phenotype with a precision exceeding the mean precision across all phenotypes was considered to have "high" precision, and "low" otherwise (likewise for frequencies). We obtained a P-value by comparing the observed number of phenotypes in each quadrant to the expected number of phenotypes (assuming a uniform distribution) using a χ2 test with three degrees of freedom.
http://www.biomedcentral.com/1471-2105/9/463
Additional material Additional file 1 Phenotype data matrix. The phenotypic signatures for all 2,376 genes. Click here for file [http://www.biomedcentral.com/content/supplementary/14712105-9-463-S1.xls]
Additional file 2 Evaluation of phenotype correlation dependency We calculated the correlation between phenotypes as described above in the definition for the Weighted FDP metric. We evaluated the intuition that more functional information is conveyed when genes share less-correlated phenotypes than when they share more-correlated phenotypes. To achieve this, we determined the amount of precision gained when genes share an additional uncorrelated phenotype, as opposed to sharing an additional correlated phenotype. We first restricted our analysis to include all gene pairs sharing exactly two phenotypes. For each phenotype v, we considered all gene pairs that share exactly that phenotype along with any other second phenotype w. We measured the baseline precision Pv0 of all gene pairs sharing a phenotype v using our evaluation set, as described above. For each phenotype w, we then considered gene pairs that share phenotypes v and w, and calculated their precision Pvw. We calculated the significance of the increase in precision obtained by sharing phenotype w over the baseline precision using the proportion statistic
Z vw =
Pvw − Pv0 , Pv0(1− Pv0 ) n vw
where nvw is the number of gene pairs sharing phenotypes v and w. Zvw can be interpreted as a standard Z-score, and quantifies the degree to which the precision of a gene pair sharing phenotype v increases when adding phenotype w as opposed to any phenotype in general. For each phenotype pair (v, w), we plotted Zvw as a function of the correlation of phenotypes v and w. We restricted analysis to phenotype pairs shared in at least 10 gene pairs.
Authors' contributions MW designed and implemented the majority of analyses. CW implemented most metrics. AB analyzed and interpreted novel multiply-supported subnetworks. MW and JS conceived of the study and drafted the manuscript.
Phenotypes used in this study. Overview of knock-down phenotypes, including background frequencies, sources, and descriptions. Click here for file [http://www.biomedcentral.com/content/supplementary/14712105-9-463-S2.doc]
Additional file 3 Additional metric evaluations. The first evaluation measures precision as a function of the number of unique genes contained in the network. Additional gene neighborhood evaluations are also included, with varying neighborhood sizes. Results of evaluations using the mean neighborhood precision as a summary statistic instead of the number of high precision neighborhoods are also included. Click here for file [http://www.biomedcentral.com/content/supplementary/14712105-9-463-S3.doc]
Additional file 4 Evaluation of phenotype dependencies. Evaluation of three possible dependencies which may be present in the data, which different metrics could exploit: 1) number dependency: sharing a greater number of present phenotypes is positively correlated with sharing a common function; 2) frequency dependency: the frequencies of shared phenotypes are inversely related to the probability that two genes share a common function; and 3) correlation dependency: genes sharing highly correlated phenotypes are less likely to be functionally related than genes sharing the same number of uncorrelated phenotypes. Click here for file [http://www.biomedcentral.com/content/supplementary/14712105-9-463-S4.doc]
Additional file 5 Comparison of enriched functional categories. List of functional categories enriched for AGREE scores only, UPC scores only, and for both. Click here for file [http://www.biomedcentral.com/content/supplementary/14712105-9-463-S5.xls]
Additional file 6 Superimposed Network. List of the 89,898 gene interactions contained in the superimposed network, including the data source(s) of each interaction. Click here for file [http://www.biomedcentral.com/content/supplementary/14712105-9-463-S6.xls]
Page 19 of 21 (page number not for citation purposes)
BMC Bioinformatics 2008, 9:463
http://www.biomedcentral.com/1471-2105/9/463
13.
Additional file 7 Subnetworks. Gene subnetworks identified in this study (AGREE, UPC, AGREE multiply-supported, UPC multiply-supported, and molecular machines), along with relevant information pertaining to each subnetwork. Click here for file [http://www.biomedcentral.com/content/supplementary/14712105-9-463-S7.xls]
14.
15.
16.
Additional file 8 Comparison of Log Likelihood Scores (LLS) for various data sources. Plot of the LLS for each C. elegans data source contained in the Superimposed Network at varying network sizes. Click here for file [http://www.biomedcentral.com/content/supplementary/14712105-9-463-S8.doc]
17. 18. 19.
Acknowledgements MW was supported by a University of California at Santa Cruz Chancellor's Division Dissertation-Year Fellowship. JS was supported by a grant from the National Science Foundation's Division of Biological Infrastructure DBI0543197 and by a fellowship from the Alfred P. Sloan foundation.
References 1.
2. 3. 4. 5.
6.
7.
8. 9.
10.
11. 12.
Fire A, Xu S, Montegomery MK, Kostas SA, Driver SE, Mello CC: Potent and specific genetic interference by double-stranded RNA in Caenorhabditis elegans. Nature 1998, 391(6669):806-811. Fortunato A, Fraser AG: Uncover genetic interactions in Caenorhabditis elegans by RNA interference. Biosci Rep 2005, 25(5–6):299-307. Sugimoto A: High-throughput RNAi in Caenorhabditis elegans: genome-wide screens and functional genomics. Differentiation 2004, 72(2–3):81-91. Ashrafi K, Chang FY, Watts JL, Fraser AG, Kamath RS, Ahringer J, Ruvkun G: Genome-wide RNAi analysis of Caenorhabditis elegans fat regulatory genes. Nature 2003, 421(6920):268-272. Lettre G, Kritikou EA, Jaeggi M, Calixto A, Fraser AG, Kamath RS, Ahringer J, Hengartner MO: Genome-wide RNAi identifies p53dependent and -independent regulators of germ cell apoptosis in C. elegans. Cell Death Differ 2004, 11(11):1198-1203. Vastenhouw NL, Fischer SE, Robert VJ, Thijssen KL, Fraser AG, Kamath RS, Ahringer J, Plasterk RH: A genome-wide screen identifies 27 genes involved in transposon silencing in C. elegans. Curr Biol 2003, 13(15):1311-1316. Piano F, Schetter AJ, Morton DG, Gunsalus KC, Reinke V, Kim SK, Kemphues KJ: Gene clustering based on RNAi phenotypes of ovary-enriched genes in C. elegans. Curr Biol 2002, 12(22):1959-1964. Byrne AB, Weirauch MT, Wong V, Koeva M, Dixon SJ, Stuart JM, Roy PJ: A global analysis of genetic interactions in Caenorhabditis elegans. J Biol 2007, 6(3):8. Gunsalus KC, Ge H, Schetter AJ, Goldberg DS, Han JD, Hao T, Berriz GF, Bertin N, Huang J, Chuang LS, et al.: Predictive models of molecular machines involved in Caenorhabditis elegans early embryogenesis. Nature 2005, 436(7052):861-865. Lehner B, Crombie C, Tischler J, Fortunato A, Fraser AG: Systematic mapping of genetic interactions in Caenorhabditis elegans identifies common modifiers of diverse signaling pathways. Nat Genet 2006, 38(8):896-903. Tong AH, Lesage G, Bader GD, Ding H, Xu H, Xin X, Young J, Berriz GF, Brost RL, Chang M, et al.: Global mapping of the yeast genetic interaction network. Science 2004, 303(5659):808-813. Ye P, Peyser BD, Pan X, Boeke JD, Spencer FA, Bader JS: Gene function prediction from congruent synthetic lethal interactions in yeast. Mol Syst Biol 2005, 1:2005 0026.
20.
21.
22. 23. 24. 25.
26.
27.
28.
29.
30.
31. 32.
Boulton SJ, Gartner A, Reboul J, Vaglio P, Dyson N, Hill DE, Vidal M: Combined functional genomic maps of the C. elegans DNA damage response. Science 2002, 295(5552):127-131. Fraser AG, Kamath RS, Zipperlen P, Martinez-Campos M, Sohrmann M, Ahringer J: Functional genomic analysis of C. elegans chromosome I by systematic RNA interference. Nature 2000, 408(6810):325-330. Gonczy P, Echeverri C, Oegema K, Coulson A, Jones SJ, Copley RR, Duperon J, Oegema J, Brehm M, Cassin E, et al.: Functional genomic analysis of cell division in C. elegans using RNAi of genes on chromosome III. Nature 2000, 408(6810):331-336. Sonnichsen B, Koski LB, Walsh A, Marschall P, Neumann B, Brehm M, Alleaume AM, Artelt J, Bettencourt P, Cassin E, et al.: Full-genome RNAi profiling of early embryogenesis in Caenorhabditis elegans. Nature 2005, 434(7032):462-469. Gunsalus KC, Yueh WC, MacMenamin P, Piano F: RNAiDB and PhenoBlast: web tools for genome-wide phenotypic mapping projects. Nucleic Acids Res 2004:D406-410. Zou L, Sriswasdi S, Ross B, Missiuro PV, Liu J, Ge H: Systematic analysis of pleiotropy in C. elegans early embryogenesis. PLoS Comput Biol 2008, 4(2):e1000003. Kamath RS, Fraser AG, Dong Y, Poulin G, Durbin R, Gotta M, Kanapin A, Le Bot N, Moreno S, Sohrmann M, et al.: Systematic functional analysis of the Caenorhabditis elegans genome using RNAi. Nature 2003, 421(6920):231-237. Rual JF, Venkatesan K, Hao T, Hirozane-Kishikawa T, Dricot A, Li N, Berriz GF, Gibbons FD, Dreze M, Ayivi-Guedehoussou N, et al.: Towards a proteome-scale map of the human protein-protein interaction network. Nature 2005, 437(7062):1173-1178. Simmer F, Moorman C, Linden AM van der, Kuijk E, Berghe PV van den, Kamath RS, Fraser AG, Ahringer J, Plasterk RH: Genome-wide RNAi of C. elegans using the hypersensitive rrf-3 strain reveals novel gene functions. PLoS Biol 2003, 1(1):E12. Issel-Tarver L, Christie KR, Dolinski K, Andrada R, Balakrishnan R, Ball CA, Binkley G, Dong S, Dwight SS, Fisk DG, et al.: Saccharomyces Genome Database. Methods Enzymol 2002, 350:329-346. Ideker T, Ozier O, Schwikowski B, Siegel AF: Discovering regulatory and signalling circuits in molecular interaction networks. Bioinformatics 2002, 18(Suppl 1):S233-240. Hu H, Yan X, Huang Y, Han J, Zhou XJ: Mining coherent dense subgraphs across massive biological networks for functional discovery. Bioinformatics 2005, 21(Suppl 1):i213-i221. Walhout AJ, Reboul J, Shtanko O, Bertin N, Vaglio P, Ge H, Lee H, Doucette-Stamm L, Gunsalus KC, Schetter AJ, et al.: Integrating interactome, phenome, and transcriptome mapping data for the C. elegans germline. Curr Biol 2002, 12(22):1952-1958. Chen W, Bucaria J, Band DA, Sutton A, Sternglanz R: Enp1, a yeast protein associated with U3 and U14 snoRNAs, is required for pre-rRNA processing and 40S subunit synthesis. Nucleic Acids Res 2003, 31(2):690-699. Tatusov RL, Fedorova ND, Jackson JD, Jacobs AR, Kiryutin B, Koonin EV, Krylov DM, Mazumder R, Mekhedov SL, Nikolskaya AN, et al.: The COG database: an updated version includes eukaryotes. BMC Bioinformatics 2003, 4:41. Leroux MR, Candido EP: Subunit characterization of the Caenorhabditis elegans chaperonin containing TCP-1 and expression pattern of the gene encoding CCT-1. Biochem Biophys Res Commun 1997, 241(3):687-692. Savage C, Das P, Finelli AL, Townsend SR, Sun CY, Baird SE, Padgett RW: Caenorhabditis elegans genes sma-2, sma-3, and sma-4 define a conserved family of transforming growth factor beta pathway components. Proc Natl Acad Sci USA 1996, 93(2):790-794. Krishna S, Maduzia LL, Padgett RW: Specificity of TGFbeta signaling is conferred by distinct type I receptors and their associated SMAD proteins in Caenorhabditis elegans. Development 1999, 126(2):251-260. Tsuboi D, Qadota H, Kasuya K, Amano M, Kaibuchi K: Isolation of the interacting molecules with GEX-3 by a novel functional screening. Biochem Biophys Res Commun 2002, 292(3):697-701. Lee I, Lehner B, Crombie C, Wong W, Fraser AG, Marcotte EM: A single gene network accurately predicts phenotypic effects of gene perturbation in Caenorhabditis elegans. Nat Genet 2008, 40(2):181-188.
Page 20 of 21 (page number not for citation purposes)
BMC Bioinformatics 2008, 9:463
33. 34. 35.
36. 37. 38. 39.
40. 41. 42. 43.
44. 45.
46.
47.
48. 49. 50.
http://www.biomedcentral.com/1471-2105/9/463
Scherf M, Epple A, Werner T: The next generation of literature analysis: integration of genomic analysis into text mining. Brief Bioinform 2005, 6(3):287-297. Jose H, Vadivukarasi T, Devakumar J: Extraction of protein interaction data: a comparative analysis of methods in use. EURASIP J Bioinform Syst Biol 2007:53096. Shatkay H, Hoglund A, Brady S, Blum T, Donnes P, Kohlbacher O: SherLoc: high-accuracy prediction of protein subcellular localization by integrating text and protein sequence data. Bioinformatics 2007, 23(11):1410-1417. Zweigenbaum P, Demner-Fushman D, Yu H, Cohen KB: Frontiers of biomedical text mining: current progress. Brief Bioinform 2007, 8(5):358-375. Pesquita C, Faria D, Bastos H, Ferreira AE, Falcao AO, Couto FM: Metrics for GO based protein semantic similarity: a systematic evaluation. BMC Bioinformatics 2008, 9(Suppl 5):S4. Gaulton KJ, Mohlke KL, Vision TJ: A computational system to select candidate genes for complex human traits. Bioinformatics 2007, 23(9):1132-1140. Ohya Y, Sese J, Yukawa M, Sano F, Nakatani Y, Saito TL, Saka A, Fukuda T, Ishihara S, Oka S, et al.: High-dimensional and largescale phenotyping of yeast mutants. Proc Natl Acad Sci USA 2005, 102(52):19015-19020. Fuchs F, Boutros M: Cellular phenotyping by RNAi. Brief Funct Genomic Proteomic 2006, 5(1):52-56. Smith CL, Goldsmith CA, Eppig JT: The Mammalian Phenotype Ontology as a tool for annotating, analyzing and comparing phenotypic information. Genome Biol 2005, 6(1):R7. Manning C, Schütze H: Foundations of Statistical Natural Language Processing. Cambridge, MA: MIT Press; 1999. Ashburner M, Ball CA, Blake JA, Botstein D, Butler H, Cherry JM, Davis AP, Dolinski K, Dwight SS, Eppig JT, et al.: Gene ontology: tool for the unification of biology. The Gene Ontology Consortium. Nat Genet 2000, 25(1):25-29. Altschul SF, Gish W, Miller W, Myers EW, Lipman DJ: Basic local alignment search tool. J Mol Biol 1990, 215(3):403-410. Kanehisa M, Araki M, Goto S, Hattori M, Hirakawa M, Itoh M, Katayama T, Kawashima S, Okuda S, Tokimatsu T, et al.: KEGG for linking genomes to life and the environment. Nucleic Acids Res 2008, 36(Database issue):D480-D484. Li S, Armstrong CM, Bertin N, Ge H, Milstein S, Boxem M, Vidalain PO, Han JD, Chesneau A, Hao T, et al.: A map of the interactome network of the metazoan C. elegans. Science 2004, 303(5657):540-543. Breitkreutz BJ, Stark C, Reguly T, Boucher L, Breitkreutz A, Livstone M, Oughtred R, Lackner DH, Bahler J, Wood V, et al.: The BioGRID Interaction Database: 2008 update. Nucleic Acids Res 2008:D637-640. Kim SK, Lund J, Kiraly M, Duke K, Jiang M, Stuart JM, Eizinger A, Wylie BN, Davidson GS: A gene expression map for Caenorhabditis elegans. Science 2001, 293(5537):2087-2092. Stuart JM, Segal E, Koller D, Kim SK: A gene-coexpression network for global discovery of conserved genetic modules. Science 2003, 302(5643):249-255. Rogers A, Antoshechkin I, Bieri T, Blasiar D, Bastiani C, Canaran P, Chan J, Chen WJ, Davis P, Fernandes J, et al.: WormBase 2007. Nucleic Acids Res 2008, 36(Database issue):D612-D617.
Publish with Bio Med Central and every scientist can read your work free of charge "BioMed Central will be the most significant development for disseminating the results of biomedical researc h in our lifetime." Sir Paul Nurse, Cancer Research UK
Your research papers will be: available free of charge to the entire biomedical community peer reviewed and published immediately upon acceptance cited in PubMed and archived on PubMed Central yours — you keep the copyright
BioMedcentral
Submit your manuscript here: http://www.biomedcentral.com/info/publishing_adv.asp
Page 21 of 21 (page number not for citation purposes)