BMC Molecular Biology
BioMed Central
Open Access
Methodology article
Normalisation genes for expression analyses in the brown alga model Ectocarpus siliculosus Aude Le Bail†1,2, Simon M Dittami†1,2, Pierre-Olivier de Franco1,2, Sylvie Rousvoal1,2, Mark J Cock1,2, Thierry Tonon1,2 and Bénédicte Charrier*1,2 Address: 1UPMC Univ Paris 6, UMR 7139 Végétaux marins et Biomolécules, Station Biologique, F 29682, Roscoff, France and 2CNRS, UMR 7139 Végétaux marins et Biomolécules, Station Biologique, F 29682, Roscoff, France Email: Aude Le Bail -
[email protected]; Simon M Dittami -
[email protected]; Pierre-Olivier de Franco -
[email protected]; Sylvie Rousvoal -
[email protected]; Mark J Cock -
[email protected]; Thierry Tonon -
[email protected]; Bénédicte Charrier* -
[email protected] * Corresponding author †Equal contributors
Published: 18 August 2008 BMC Molecular Biology 2008, 9:75
doi:10.1186/1471-2199-9-75
Received: 24 February 2008 Accepted: 18 August 2008
This article is available from: http://www.biomedcentral.com/1471-2199/9/75 © 2008 Le Bail et al; licensee BioMed Central Ltd. This is an Open Access article distributed under the terms of the Creative Commons Attribution License (http://creativecommons.org/licenses/by/2.0), which permits unrestricted use, distribution, and reproduction in any medium, provided the original work is properly cited.
Abstract Background: Brown algae are plant multi-cellular organisms occupying most of the world coasts and are essential actors in the constitution of ecological niches at the shoreline. Ectocarpus siliculosus is an emerging model for brown algal research. Its genome has been sequenced, and several tools are being developed to perform analyses at different levels of cell organization, including transcriptomic expression analyses. Several topics, including physiological responses to osmotic stress and to exposure to contaminants and solvents are being studied in order to better understand the adaptive capacity of brown algae to pollution and environmental changes. A series of genes that can be used to normalise expression analyses is required for these studies. Results: We monitored the expression of 13 genes under 21 different culture conditions. These included genes encoding proteins and factors involved in protein translation (ribosomal protein 26S, EF1alpha, IF2A, IF4E) and protein degradation (ubiquitin, ubiquitin conjugating enzyme) or folding (cyclophilin), and proteins involved in both the structure of the cytoskeleton (tubulin alpha, actin, actin-related proteins) and its trafficking function (dynein), as well as a protein implicated in carbon metabolism (glucose 6-phosphate dehydrogenase). The stability of their expression level was assessed using the Ct range, and by applying both the geNorm and the Normfinder principles of calculation. Conclusion: Comparisons of the data obtained with the three methods of calculation indicated that EF1alpha (EF1a) was the best reference gene for normalisation. The normalisation factor should be calculated with at least two genes, alpha tubulin, ubiquitin-conjugating enzyme or actinrelated proteins being good partners of EF1a. Our results exclude actin as a good normalisation gene, and, in this, are in agreement with previous studies in other organisms.
Page 1 of 9 (page number not for citation purposes)
BMC Molecular Biology 2008, 9:75
Background Brown algae (Phaeophyceae) are multi-cellular marine organisms that grow along temperate, tropical and polar coasts. Many of them are subject to frequent changes in their local environment, because they are uncovered at low tide, and are hence exposed to desiccation, and to variations in osmotic pressure due to rain or evaporation. In addition, pollution of the coasts, due to human activities, constitutes an additional source of abiotic stress, to which they must develop adaptive mechanisms. Expression analyses of genes involved in the perception of the stress, and in the establishment of the appropriate responses, provide a means to decipher the molecular mechanisms potentially involved in such adaptations. Despite the availability of medium scale cDNAs libraries for several different species of the brown algae (Laminaria, Sargassum, and Fucus), this task has been hindered by the lack of genome-scale resources. In 2004, Peters et al. [1] have compared a range of features in several species of Phaeophyceae and concluded that Ectocarpus siliculosus was the best candidate to consider for such developments. Recently, the genome of this alga has been sequenced, offering a unique opportunity to survey the expression of gene families in brown algae (Genoscope, J.M. Cock, unpublished data). E. siliculosus is a small filamentous alga, extensively studied over the last two centuries for its complex life cycle and its physiological features (reviewed in [2]). The genome is currently being annotated, allowing the initiation of both large scale and targeted surveys of the Ectocarpus genes, such as microarrays or real-time RT-PCR respectively. Compared to high-throughput microarray techniques, real-time quantitative RT-PCR only allows assays of gene expression to be carried out at relatively low throughput (10–20 genes in 10–50 samples). Nonetheless, this technique has been adopted by a large community as a standard method for gene expression studies, because of its high reliability, and its rapidity of execution [3,4]. This technique is now widely used for a large number of animal and plant organisms, as well as for bacteria and viruses. A few years after the emergence of this technique, a need for a reliable normalisation method became insistent. Different methods of identifying normalisation genes, such as geNorm [5], NormFinder [6] and BestKeeper [7], were then developed. This was followed by a wave of reports on the identification of the best normalisation genes from a broad range of species and specific tissues. These biological materials included human tissues [8-10] and viruses [11], as well as tissues from a variety of animals such as cow [12], pig [13], horse [14], dolphin [15], fishes [16,17], worm [18] and others. In parallel, a similar extension of the use of this technique was observed in plant
http://www.biomedcentral.com/1471-2199/9/75
research, for rice [19], poplar [20], potato [21], grapevine [22], and for plant pathogens [23]. In the brown alga E. siliculosus, the expression level of 20 genes specific to the two generations in the life-cycle of this alga was recently reported in a mutant impaired in development [24]. Additional developmental and physiological studies are underway, including studies aimed at assessing the resistance of this alga to environmental changes. Hence, the availability of a set of housekeeping genes for normalising the expression levels of genes of interest is a pre-requisite to any valuable conclusion, especially since this organism lives in a frequently changing environment. In this paper, we propose optimal normalisation genes for expression analyses in E. siliculosus. Thirteen housekeeping genes that have been reported to be good potential candidates in the previously cited literature, were chosen for this task. Their expression was examined by Q-RT-PCR in a diversity of algal samples corresponding to growth kinetic series, osmotic stress experiments, and chemical treatments. Namely, the candidate genes are involved in the synthesis and the dynamics of the cytoskeleton, in the synthesis, folding and degradation of proteins, and in the metabolism of carbon, all of these processes being known to be only moderately affected by the fluctuation of growth conditions.
Results Treatments applied to E. siliculosus and choice of housekeeping genes Several different stresses were tested in this study. Chemical agents tested included H2O2, a reactive oxygen species produced by many organisms, including seaweeds, under conditions of abiotic and biotic stresses [25]. We also tested heavy metals such as copper, which are among the most significant pollution actors in marine environments worldwide. Diuron and atrazine are herbicides that inhibit photosynthesis by blocking the d1 protein of photosystem II [26,27]. Diuron is also an additive of antifouling paints, which prevent growth of organisms on ships' hulls. In addition pathogen or grazer attacks were mimicked by wounding E. siliculosus tissues with a razor blade. We also tested the effect of oxylipins. These are oxygenated derivatives of polyunsaturated fatty acids which play a major role in inflammatory processes, allergies, and, in a wide sense, defensive stress responses to infection, drugs, and xenobiotics [28]. In land plants, C18 derived jasmonates play a pivotal role in defense induced mechanisms [29]. In mammals, oxidation of the C20 arachidonic acid produces derivatives such as leukotriens and prostaglandins. As brown algae are able to produce oxylipins typical of both land plants and animals [30], their putative action on the induction of stress signalling path-
Page 2 of 9 (page number not for citation purposes)
BMC Molecular Biology 2008, 9:75
http://www.biomedcentral.com/1471-2199/9/75
ways is of particular interest. Finally, as the metabolism and the physiology of brown algae are regulated to a large extent by diurnal rhythms, a time series of samples taken over a single day was also analysed. RNA was extracted from biological triplicates of algae that had received the above treatments resulting in a total of 63 samples for 21 different treatments (see Table 1, and Methods for details on concentration and timing). Single strand cDNA was synthesised simultaneously from each of the 63 extracts in order to minimize any variation during this step of the process. The abundance of the transcripts of 13 potential housekeeping genes was then assayed on these cDNAs. The genes tested included commonly used genes such as a ribosomal protein and translation initiation or elongation factors (eIF2A, eIF4E, EF1a, 26S ribosomal protein), cytoskeleton proteins (tubulin alpha, actin and actin-related proteins), and proteins involved in the protein degradation process (ubiquitin and ubiquitin-conjugating enzyme). In addition, cyclophylin, two actin-related proteins, a tubulin molecular motor (dynein) and an enzyme involved in the pentose phosphate pathway (glucose 6-phosphate dehydrogenase) were included in this study. The genes tested are listed in Table 2.
Table 1: Culture conditions and duration.
Type of treatment
Final concentration
Diurnal cycle Diurnal cycle Diurnal cycle Diurnal cycle Diurnal cycle
Duration 0h 6h 12 h 18 h 24 h
ASW DMSO H 2O 2 CuSO4 Atrazine 13-HOtrE 15-HEPE ASW Ethanol CuSO4 Diuron Wounding
450 mM NaCl 1% (V:V) 10 mM 10 μM 55 μg. L-1 5 μM 5 μM 450 mM NaCl 0.2% (V:V) 10 μM 42 μg.L-1
3h 3h 3h 3h 3h 3h 3h 6h 6h 6h 6h 6h
ASW Hyposaline Hypersaline H 2O 2
450 mM NaCl 60 mM 1,5 M 1 mM
6h 6h 6h 6h
Treatments were applied under light (see Material and Methods for details). ASW: artificial sea water; DMSO: dimethyl sulfoxide; 13HOTrE: 13-hydroxyoctadecatrienoic acid; 15(S)-HEPE: 15hydroxyeicosapentaenoic acid.
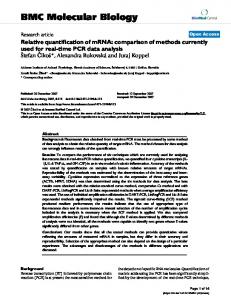
Quantification and data analysis In order to assess whether the transcripts of these 13 genes remained at comparable levels in the different samples tested, we calculated the variation in the Ct value for each gene. Figure 1A shows that the transcripts of these genes exhibited different levels of abundance, with CYC being expressed at the lowest level, and UBQ being expressed the most strongly. Variation in transcript accumulation across the 21 culture conditions was not the same for all the genes tested. EF1a showed the weakest variation, while G6PD expression seemed to be strongly influenced by the treatments, its range of expression level exceeding 10 Ct (Figure 1B).
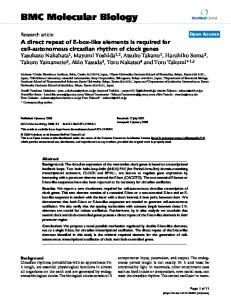
In order to test the robustness of these data, we performed the geNorm pairwise analysis, which was first described by Vandesompele et al. [5], and has since been widely used to evaluate the stability of expression of genes from many organisms. The results of this analysis (Figure 2) were slightly different from those obtained with the Ct value calculation. The two calculation methods identified the same least and most stably expressed genes (G6PD and CYC were the least stable, and TUA, EF1a and Dyn were the most stable), but the intermediate genes were ordered differently. This was particularly striking for ARP2.1 and UBCE, which the geNorm analysis indicated were the most stably expressed genes, and which the Ct value analysis indicated to be among the least stably expressed. In order to test whether averaging the biological triplicates had an effect on the final result, we performed the geNorm analysis using the transcript abundances measured in the 63 individual cDNA samples, as previously described [31]. This analysis identified the same genes as having either highly variable (CYC, G6PD and ACT) or very stable (ARP2.1, UBCE, TUA, EF1a and Dyn) transcript abundances, but the order of the six remaining genes was again different (data not shown). Thus, averaging the biological replicates modified the results of the analysis for the intermediate genes, but not for the most and the least stable genes. A one-way ANOVA test showed that for most of the genes considered individually, the variance between the different culture conditions is significantly higher than the variance between the biological replicates for a given condition (see Additional file 1). Therefore, averaging on the three biological replicates should not introduce any significant distortion. NormFinder is another approach that has been used to assess the stability of expression of housekeeping genes [6]. When NormFinder was applied to the data obtained in this study, it indicated that the genes with the most stable levels of transcript abundance were TUA, ARP2.1, EF1a and Dyn (Table 3). These were almost the same genes as the ones identified by geNorm, with the exception that Dyn performed better than UBCE. Therefore,
Page 3 of 9 (page number not for citation purposes)
BMC Molecular Biology 2008, 9:75
http://www.biomedcentral.com/1471-2199/9/75
Table 2: Candidate housekeeping genes tested in this study. Gene symbol
Homologous to
Description of trace archive
Accession number
Oligonucleotides – Forward – Reverse
E (%)
R2
Tm product
PCR product length (bp)
Actin
KY0AIB94YO18AHM1
1927036313
91
1.000
87.80
119
p34-arc subunit of the actin-related protein complex ARP2/3 ARP2 subunit of the actin-related protein complex ARP2/3 Cyclophilin
KY0AFIPA38YJ23RM1
1927195696
CCCAGATCATGTTCGAGACGTT CACGCCGTCACCCGAGTC GAAGGAGTTCTGCCGGGAAG ACAAAGCAGCAACGCAGAGA
98
0.994
84.50
121
KY0AIB269YJ02AHM1
1929831232
GAAGAAGTTCAAGCTCAACATCGA CCGCACCCCCAATGAAA
104
0.998
80.90
68
KY0ADB29YF06FM1
1291599781
92
0.997
84.80
101
KY0AEB344YP09RM1
1306215256
100
0.999
81.20
65
KY0AEC342YI10RM1
1291335619
92
0.997
81.50
160
KY0AEF243YN02RM1
1299896231
90
0.996
84.50
101
KY0AIB251YB11AHM1
1918199315
94
0.991
84.80
101
KY0ADA42YE14FM1
1291478318
100
0.991
82.40
71
R26S
Dynein light chain protein Translation elongation factor 1 alpha Glucose 6 phosphate dehydrogenase Translation initiation factor eIF2 alpha Translation intiation factor eIF4E Ribosomal protein 26S
KY0AEC624YL15RM1
1300144654
93
0.995
85.40
101
TUA
Alpha tubulin
KY0AEC614YE14RM1
1299935912
92
0.999
83
140
UBCE
KY0AFIPA87YJ24RM1
1917772478
95
0.997
84.50
101
UBQ
Ubiquitin conjugating enzyme Ubiquitin C
KY0AEC576YH18FM1
1306241438
100
0.997
82.70
101
mN
Intron amplification
KY0AEF302YN21FM1
1306150449
AGACGGCGGTGCAAGTAGG GTGAGTCACGGCTGCTTTTATG GGAACAAAGCATGGTGACAACA CGCGTGCCTATCCAAGCT GCAAGGGCCTCAGCTCTG ACAAGCCGTCTGGGTATATGTTAGC GTGAGGATGTTCAGGTCCCAG GTGGAAGACCCGGTGAGGT GCGGTACGTGATGGACACC CCCCCGACTCGATGATCTTT TCGCGATTCGAGGTTTGAGTA CAAACGCTGCGGCAGC GCTAGGCTTGCGTTTGTGTG GGCGAGACAGAAAGATTCCG TTTGAGGAGTTTCGTCGGAGAT CACACAGCGCAAAACGGC AACAATGGCCTTTGCGAAAA GCGTACGTCTTGAAGCCCAG CAACGCCCATGATTGTTCAC GATTATTCCCATCCACGGCA TCATTTTTCATGTGGAGGTCTCTG GCCAAACAAACAACAACCCTC
83
0.981
84.80
93
ACT ARP2.1 ARP2.2 CYC Dyn EF1alpha G6PD IF2A IF4E
The identity of the sequences (gene name, function) is indicated in the left part of the table. The trace corresponds to trace archive at NCBI http:// www.ncbi.nlm.nih.gov/Traces/trace.cgi?cmd=retrieve&val=species_code%3D%22ECTOCARPUS+SILICULOSUS%22. Parameters on the corresponding amplified product (oligonucleotides, amplicon Tm and size, reaction efficiency and reliability) are indicated in the right part.
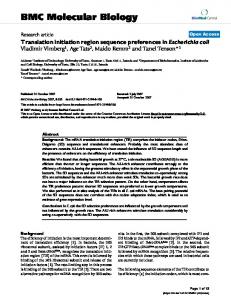
there was a very good correlation between the results obtained from geNorm and NormFinder, despite the fact that the methods of calculation are fundamentally different. In order to test whether the normalisation genes identified above were also the best choices for specific conditions, we performed expression stability measurements on distinct series of treatments i.e. osmotic stresses, chemical treatments and diurnal rhythm. Figure 3 shows that with both the geNorm and NormFinder calculation methods (A and B) the optimal choice of normalisation gene depended on the type of experiments. Thus, although EF1a remained among the most stable genes, variations in the identity of the other very stable genes were observed depending on the treatment. This was particularly striking for the ACT gene, the abundance of its transcript showing a high level of variability following all the treatments except osmotic stresses. The transcript of the TUA gene varied significantly in abundance in the diurnal sample series (see Additional file 2), but remained at a stable level in the abiotic stress treatments. Note that CYC and G6PD, which showed the greatest variability in transcript abundance in the global analyses, were also highly variable in each of the different classes of experiment.
To calculate the number of normalisation genes necessary to obtain the normalisation factor we determined, using geNorm, the pairwise variation between sets of normalisation factors obtained when using two, three or more genes for normalisation. Figure 4 shows that the normalisation factors are only modified slightly when a third (or more) gene is added (pairwise variation of 0.13 for 3 genes). Vandesompele et al. [5] recommended that additional normalisation genes be included if the pairwise variation between the normalisation factors is higher than 0.15. According to geNorm, measuring the expression levels of ARP2.1 and UBCE is sufficient to normalise the expression of genes of interest in these samples.
Discussion In this study, the three methods used to identify the best normalisation genes were concordant, as previously reported in other studies [10]. Comparison of the three methods indicates that EF1a is the most reliable gene to normalise gene expression in experiments aiming at quantitatively measuring the transcriptional response to abiotic stresses and chemical treatments. The V pairwise analysis shows that two genes are sufficient for a proper expression normalisation. The choice of the second gene, however, will depend on the type of experiment that is being carried out. For osmotic stresses and chemical treat-
Page 4 of 9 (page number not for citation purposes)
BMC Molecular Biology 2008, 9:75
A
http://www.biomedcentral.com/1471-2199/9/75
Table 3: Normfinder analysis of the expression stability of the 13 genes.
40
Ct value
36
28 24 20
U
BQ R2 EF 6S 1a lp ha TU A A CT D yn U BC E IF 2A G 6P D A RP 2. A 1 RP 2. 2 IF 4E CY C
16
B
G6PD ARP2.1 CYC UBCE ACT ARP2.2 UBQ R26S IF2A IF4E Dyn TUA EF1a
Stability value
TUA ARP2.1 EF1a Dyn UBCE UBQ IF4E IF2A ARP 2.2 R26S ACT G6PD CYC
0.099 0.182 0.220 0.227 0.240 0.401 0.403 0.406 0.422 0.479 0.558 0.655 1.964
The stability of expression of the 13 genes was calculated using the Normfinder method designed by Andersen et al.[6]
0
2
4
6
8
10
12
Ct
Figure 1 level of 13 housekeeping genes Expression Expression level of 13 housekeeping genes. A: The range of the expression level of the 13 genes over the 21 culture conditions is expressed in Ct values. The black diamond represents the arithmetic mean. B: Variations observed in the range of Ct values.
ments, TUA can be used reliably, while for the diurnal cycle ARP2.2 is more relevant. As a brown alga, E. siliculosus is member of the kingdom of the Heterokonta, which is phylogenetically very distant from animals and land plants [32]. Interestingly, and 1.2 1 0.8 0.6 0.4 0.2
despite this evolutionary distance, a consensus seems to emerge from similar analyses performed in organisms belonging to distant lineages. The gene coding for the elongation factor of protein translation EF1a was shown to be the best reference genes in salmon [17] and in several plants such as in rice [19], grapevine [22] and potato [21]. The alpha tubulin encoding gene was also reported to be one of the best reference genes for horse tissues [13] and in poplar [19]. On the other hand, actin genes have been very often reported as exhibiting highly variable levels of expression in both human and animals tissues [10,12,16-18], and in plants [19]. In this study, we have shown that this is also true for E. siliculosus. Despite the fact that ubiquitin and related enzymes (UBCE) are not commonly used as normalisation genes, in this study, they were found to be quite suitable. Interestingly, Czechowski et al. [31] showed, using microarray analysis, that genes of the ubiquitin complex, comprising an ubiquitin conjugating enzyme such as UBCE, and several E3-ubiquitin protein ligases, were very stably expressed. They also pointed out that genes with fairly low levels of expression such as UBCE may be of particular interest for normalising expression levels of genes that are expressed at moderate to low levels, such as transcription factors. This latter example illustrates how microarray analyses may be useful to find additional normalisation genes, which can be then tested by Q-PCR for their suitability.
A
TU RP A 2. 1/ U BC E
yn D
EF 1a
BQ U
IF 4E
R2 6S
IF 2A
CT A
RP 2. 2 A
G
6P D
C
0
CY
Average expression stability M
Gene name
32
analysisranking Global Figure 2 of the 13 housekeeping genes using geNorm Global ranking of the 13 housekeeping genes using geNorm analysis. The M value was calculated with the geNorm software [5]. Low values of M indicate that a gene is expressed very stably.
Conclusion E. siliculosus is recognised as the genomic and genetic model of brown macroalgae [1,2]. As the genome sequence is currently in the phase of expert annotation, the community interested in E. siliculosus is likely to grow in the near future. The results presented in this paper pave
Page 5 of 9 (page number not for citation purposes)
BMC Molecular Biology 2008, 9:75
http://www.biomedcentral.com/1471-2199/9/75
B
A Least stable
Least stable
CYC
CYC
ACT
TUA G6PD
UBQ
ARP2.1 IF4E
EF1a
chem ical
UBCE Dyn
ARP 2.2 EF1a
chem ical Most stable
R26S
tic
UBCE R26S
IF2A
c
IF2A ARP 2.2 Dyn
ARP2.1
os mo ti
IF4E
TUA
UBQ
G6PD
os mo
diurnal
diurnal
ACT
Most stable
Figure 3of the 13 housekeeping genes over the three different series of culture conditions Ranking Ranking of the 13 housekeeping genes over the three different series of culture conditions. Both geNorm (A) and Normfinder (B) were used to order the housekeeping genes according to three axes, corresponding to the three series of culture conditions/treatments. The position of each gene in the 3-D graph indicates its suitability as a reference gene. The front bottom position corresponds to the most stable gene, the far top position to the most regulated gene. Note the different scales on the axes.
the way for further studies on different aspects of E. siliculosus biology including development/morphogenesis and abiotic/biotic stress responses. In addition, they will be helpful for comparison with results from microarray hybridizations, which are currently in progress.
Methods Culture conditions and treatments E. siliculosus (Ectocarpales, Phaeophyceae) unialgal strain 32 (CCAP accession 1310/4, origin san Juna de Marcona, Peru) was cultivated in 10 L plastic flasks in a culture room at 14°C using filtered and autoclaved natural seawater enriched in Provasoli nutrients [33]. Light was provided by Philips daylight fluorescence tubes with a photon flux density of 40 μmol. m-2 .s-1 for 14 hours per day. Cultures were bubbled with filtered (0.22 μm) compressed air to avoid CO2 depletion. To conduct the chemical treatment experiments, algal tissues were transferred into Petri dishes containing artificial seawater enriched with Provasoli (ASW) for at least 18 h before treatments in order to acclimatize the cultures to the change of growth conditions. They were then treated with different chemi-
cals for 3 and/or 6 h (see Table 1) during the light phase. The treatments were 10 mM H2O2 (final concentration), 42 μg.L-1 Diuron, 55 μg.L-1 atrazine, 5 μM 13-HOTrE and 15(S)-HEPE. Algae were also incubated in 10 μM CuSO4 for 3 and 6 h. An equal volume of solvent (ASW or DMSO 1%) was used in each corresponding control treatment. Wounding was carried out by damaging the tissues with a razor blade. To perform saline stress and an additional H2O2 treatment, tissues were transferred to ASW for one week before applying the stress. The NaCl concentration in control ASW was 450 mM, while it was 60 mM and 1.5 M in ASW used to submit the alga to hyposaline and hypersaline conditions respectively. In addition, H2O2 was added at 1 mM final concentration to the control ASW for generating oxidative stress. Treatments were applied for 6 h before harvesting the tissues for RNA extraction. To collect samples through the diurnal cycle, algae were incubated in ASW and tissue harvested every 6 h during one day. The first sample was taken 30 min after the beginning of the light period. The summary of the culture conditions is presented in Table 1.
Page 6 of 9 (page number not for citation purposes)
BMC Molecular Biology 2008, 9:75
http://www.biomedcentral.com/1471-2199/9/75
Pairwise variation V
0.14 0.12 0.1 0.08 0.06 0.04 0.02
11
12 V1 1/
V1 0/
V9 /1 0
V8 /9
V7 /8
V6 /7
V5 /6
V4 /5
V3 /4
V2 /3
0
normalisation Determination Figure 4 of the optimal number of control genes for Determination of the optimal number of control genes for normalisation. The pairwise variation V of the normalisation factors was calculated for the 21 different culture conditions for the 13 housekeeping genes with the geNorm software [5].
Three biological replicates were obtained for each treatment and these were used for total RNA extraction. RNA extraction The protocol used for RNA extraction was based on the method developed by Apt et al. [34] with some modifications. Frozen tissue was ground in liquid nitrogen and immediately incubated in the presence of extraction buffer (100 mM Tris-HCl pH 7.5, 2% CTAB, 1.5 M NaCl, 50 mM EDTA, 50 mM DTT). The sample was shaken at room temperature for 30 min, then one volume of chlorophorm:isoamylic alcohol (24:1, V/V) was added and the sample shaken again for 25 min. After centrifugation, the upper phase was transferred to a new tube and mixed with 0.3 V of absolute ethanol to precipitate the polysaccharides, and extracted with 1 V of chlorophorm. After centrifugation the upper phase was transferred to a fresh tube and RNA was precipitated by addition of 0.25 V of 12 M LiCl and β-mercapto-ethanol to 1% final concentration, overnight at -20°C. After centrifugation, the pellet was resuspended for DNAse treatment by an RNAse-free DNAse I (Turbo DNAse, Ambion) according to the manufacturer's instructions, in order to eliminate any residual genomic DNA from the preparation. An extraction was then carried out by adding Phenol-Chlorophorm (1:1, V/ V). After centrifugation the upper phase was transferred to a fresh tube, and extracted with 1 V of chlorophorm:isoamylic alcohol (24:1, V/V) and centrifuged again. The upper phase was precipitated with 0.3 M NaAc pH 5.5 and 75% ice cold ethanol by incubating overnight at 20°C. After centrifugation, the supernatant was removed, and the pellet washed with 80% ethanol. After centrifugation and drying on ice, the pellet was resuspended in an appropriate volume of RNAse-free water.
Quantification of RNAs and cDNA synthesis Nucleic acid concentrations were measured by the absorbance at OD260 using a NanoDrop ND-1000 spectrophotometer. The purity of the RNA samples was assessed by measuring the ratio OD260/OD280 and OD230/OD260 (see Additional file 3). RNA integrity was then verified on 1.5% agarose gel stained with ethidium bromide (see Additional file 4). From each RNA sample, 1.4 μg was reverse transcribed to cDNA using oligo(dT)12–18 and the Superscript™ First Strand synthesis for RT-PCR (Invitrogen) according to the manufacturer's instructions, and subsequently diluted with nuclease free water to 1 ng.μl-1 cDNA. Protocol for DNA extraction Frozen tissue was ground in liquid nitrogen and then in a wheaton potter with 15 ml of extraction buffer (100 mM Tris-HCl pH7.5; 1.5 M NaCl; 2% CTAB; 50 mM EDTA; 50 mM DTT) per g of wet tissue. The suspension was then mixed vigorously at room temperature for at least 30 min. Proteins were degraded with 25 units of proteinase K for 2 h at 55°C, and then extracted with chlorophorm/isoamyl alcohol for several minutes. Polysaccharides were precipitated with progressive addition of 0.2 – 0.3 V of ethanol, and then extracted with 1 V of chloroform after spinning at 10,000 g and 20°C for 20 min. Nucleic acids were recovered from the upper phase by addition of 0.25 V of 12 M LiCl and 1% of β-mercaptoethanol, incubation at -20°C overnight and spinning at 10,000 g and 4°C for 1 h. The supernatant was precipitated with 0.6 V isopropanol, 0.3 M NaAc pH 5.2, left at 4°C for 30 min, and then spun down for 30 min at 13,000 g. The pellet was then dissolved in 400 μl H2O, and precipitated again with ethanol and NaAc. DNA was dissolved in 500 μl of TE (10 mM Tris-HCl pH 8.0; 1 mM EDTA), 5.4 M CsCl (density 1.66) and 250 μg.mL-1 of ethidium bromide. Spinning at 90,000 g for 24 h at room temperature allowed the recovery of a band containing ultrapure genomic DNA under UV. Ethidium bromide was extracted 4–5 times with TEsaturated butanol and CsCl eliminated by successive ethanol precipitations. Real-time PCR All the genes were quantified on the same lot of cDNAs, to minimize experimental variation that could be due to cDNA synthesis. For each gene, a pair of oligonucleotide sequences was designed in the 3' UTR of the genes when the sequence was known, or in the 3'coding sequence using Primer Express TM1.0 (PE Applied Biosystems, Foster City, CA, USA) (Table 2). The Q-PCR reactions were performed in a 96-well thermocycler (Biorad, Opticon) with SYBRgreen reaction mix from ABgene (AB-1162/B), for 15 min at 95°C, followed by 41 runs of 15 sec at 95°C and 1 min at 60°C. Each sample was technically duplicated. E. siliculosus genomic DNA was used as a quantifica-
Page 7 of 9 (page number not for citation purposes)
BMC Molecular Biology 2008, 9:75
tion reference. A dilution series ranging from 37 to 48671 copies of the E. siliculosus genome was prepared and tested for each gene. The amplification efficiency was tested using this dilution series (Table 2). The specificity of amplification was checked with a dissociation curve obtained by heating the samples from 65°C to 95°C (Table 2). In addition to the DNAse-I treatments of RNAs, the absence of a genomic DNA contaminants was checked, by amplifying an intron sequence on the cDNAs. The number of copies of contaminant gDNA was subtracted from all other values, prior to any further analyses.
Abbreviations 13-HOTrE: 13-hydroxyoctadecatrienoic acid; 15(S)HEPE: 15-hydroxyeicosapentaenoic acid; ACT: actin; ARP2: actin-related protein 2/3; ASW: artificial sea water; CYC: cyclophilin; DMSO: dimethyl sulfoxide Dyn: dynein; EF1a: translation elongation factor alpha; G6PD: glucose 6-phosphate dehydrogenase; IF2A: translation initiation factor 2 A; IF4E: translation initiation factor 4E; R26S: ribososomal protein 26S; TUA: tubulin alpha; UBCE: ubiquitin conjugating enzyme; UBQ: ubiquitin.
http://www.biomedcentral.com/1471-2199/9/75
Additional file 4 RNA extracts considered in this study. From the 83 RNAs run on the gel, the ones used for the cDNA synthesis are labelled in red. Between 400 to 900 ng of RNA were loaded on the gel. Click here for file [http://www.biomedcentral.com/content/supplementary/14712199-9-75-S4.pdf]
Acknowledgements We thank Julia Morales (Station Biologique de Roscoff) for her help concerning the identification of the IF2A and EFI4 genes, and Bernard Billoud (Atelier de Bioinformatique de l'Université Pierre et Marie Curie Paris-6) for his assistance with statistical analyses. ALB and P-O dF are granted by the French Ministère de l'Enseignement Supérieur et de la Recherche. SD has received funding from the European community's Sixth Framework Programme (ESTeam n° contract MESTCT 2005-020737).
References 1.
2.
Authors' contributions P-O dF, SR and SD extracted the RNAs. SR provided Ectocarpus genomic DNA. TT tested the quality of the RNAs and performed the cDNA synthesis. MC gave access to the E. siliculosus genomic resources. BC chose the housekeeping genes, found homologues in the Ectocarpus databases and designed the oligonucleotides for Q-PCR. ALB and SD carried out the Q-PCR experiments. Analyses of the data were performed equally by ALB, SD, TT & BC. The MS was written by TT and BC, and approved by all the authors.
Additional material Additional file 1 One-way ANOVA test for the significance of the biological triplicate averaging. An ANOVA was performed on the three biological replicates of all the data, with the groups corresponding to the different treatments. The resulting p-values are shown in the table. Click here for file [http://www.biomedcentral.com/content/supplementary/14712199-9-75-S1.pdf]
Additional file 2 Gene expression during the diurnal cycle. Click here for file [http://www.biomedcentral.com/content/supplementary/14712199-9-75-S2.xls]
3. 4. 5.
6.
7.
8. 9.
10.
11.
12.
Additional file 3 Quantification and quality of the RNAs used in this study. Click here for file [http://www.biomedcentral.com/content/supplementary/14712199-9-75-S3.pdf]
13.
Peters AF, Marie D, Scornet D, Kloareg B, Cock JM: Proposal of Ectocarpus siliculosus (Ectocarpales, Phaeophyceae) as a model organism for brown algal genetics and genomics. J Phycol 2004, 50:1079-1088. Charrier B, Coelho S, Le Bail A, Tonon T, Michel G, Potin P, Kloareg B, Boyen C, Peters AF, Cock JM: Development and physiology of the brown alga Ectocarpus siliculosus: two centuries of research. New Phytol 2008, 177:319-332. Gachon C, Mingam A, Charrier B: Real-time PCR: What relevance to plant studies? J Exp Bot 2004, 55:1445-1454. Bustin SA, Benes V, Nolan T, Pfaffl MW: Quantitative real-time RT-PCR – a perspective. J Mol Endocrinol 2005, 34:597-601. Vandesompele J, De Preter K, Pattyn F, Poppe B, Van Roy N, De Paepe A, Speleman F: Accurate normalization of real-time quantitative RT-PCR data by geometric averaging of multiple internal control genes. Genome Biol 2002, 3(7):RESEARCH0034. Andersen CL, Jensen JL, Ørntoft TF: Normalization of real-time quantitative reverse transcription-PCR data: a model-based variance estimation approach to identify genes suited for normalization, applied to bladder and colon cancer data sets. Cancer Res 2004, 64:5245-5250. Pfaffl MW, Tichopád A, Prgomet C, Neuvians TP: Determination of stable housekeeping genes, differentially regulated target genes and sample integrity: BestKeeper – Excel-based tool using pair-wise correlations. Biotechnol Lett 2004, 26:509-515. McNeill RE, Miller N, Kerin MJ: Evaluation and validation of candidate endogenous control genes for real-time quantitative PCR studies of breast cancer. BMC Mol Biol 2007, 8:107. Perez S, Royo LJ, Astudillo A, Escudero D, Alvarez F, Rodriguez A, Gomez E, Otero J: Identifying the most suitable endogenous control for determining gene expression in hearts from organ donors. BMC Mol Biol 2007, 8:114. Pombo-Suarez M, Calaza M, Gomez-Reino JJ, Gonzalez A: Reference genes for normalization of gene expression studies in human osteoarthritic articular cartilage. BMC Mol Biol 2008, 9:17. Watson S, Mercier S, Bye C, Wilkinson J, Cunningham AL, Harman AN: Determination of suitable housekeeping genes for normalisation of quantitative real time PCR analysis of cells infected with human immunodeficiency virus and herpes viruses. Virol J 2007, 4:130. Goossens K, Van Soom A, Van Poucke M, Vandaele L, Vandesompele J, Van Zeveren A, Peelman LJ: Identification and expression analysis of genes associated with bovine blastocyst formation. BMC Dev Biol 2007, 7:64. Kuijk EW, du Puy L, van Tol HT, Haagsman HP, Colenbrander B, Roelen BA: Validation of reference genes for quantitative RTPCR studies in porcine oocytes and preimplantation embryos. BMC Dev Biol 2007, 7:58.
Page 8 of 9 (page number not for citation purposes)
BMC Molecular Biology 2008, 9:75
14.
15.
16. 17.
18.
19.
20. 21. 22.
23. 24.
25. 26. 27. 28. 29. 30. 31.
32. 33. 34.
Bogaert L, Van Poucke M, De Baere C, Peelman L, Gasthuys F, Martens A: Selection of a set of reliable reference genes for quantitative real-time PCR in normal equine skin and in equine sarcoids. BMC Biotechnol 2006, 6:24. Spinsanti G, Panti C, Lazzeri E, Marsili L, Casini S, Frati F, Fossi CM: Selection of reference genes for quantitative RT-PCR studies in striped dolphin (Stenella coeruleoalba) skin biopsies. BMC Mol Biol 2006, 7:32. Hibbeler S, Scharsack JP, Becker S: Housekeeping genes for quantitative expression studies in the three-spined stickleback Gasterosteus aculeatus. BMC Mol Biol 2008, 9:18. Ingerslev HC, Pettersen EF, Jakobsen RA, Petersen CB, Wergeland HI: Expression profiling and validation of reference gene candidates in immune relevant tissues and cells from Atlantic salmon (Salmo salar L.). Mol Immunol 2006, 43:1194-1201. Hoogewijs D, Houthoofd K, Matthijssens F, Vandesompele J, Vanfleteren JR: Selection and validation of a set of reliable reference genes for quantitative sod gene expression analysis in C. elegans. BMC Mol Biol 2008, 9:9. Jain M, Nijhawan A, Tyagi AK, Khurana JP: Validation of housekeeping genes as internal control for studying gene expression in rice by quantitative real-time PCR. Biochem Biophys Res Commun 2006, 345:646-651. Brunner AM, Yakovlev IA, Strauss SH: Validating internal controls for quantitative plant gene expression studies. BMC Plant Biol 2004, 4:14. Nicot N, Hausman JF, Hoffmann L, Evers D: Housekeeping gene selection for real-time RT-PCR normalization in potato during biotic and abiotic stress. J Exp Bot 2005, 56:2907-2914. Reid KE, Olsson N, Schlosser J, Peng F, Lund ST: An optimized grapevine RNA isolation procedure and statistical determination of reference genes for real-time RT-PCR during berry development. BMC Plant Biol 2006, 6:27. Takle GW, Toth IK, Brurberg MB: Evaluation of reference genes for real-time RT-PCR expression studies in the plant pathogen Pectobacterium atrosepticum. BMC Plant Biol 2007, 7:50. Peters AF, Scornet D, Ratin M, Charrier B, Monnier A, Merrien Y, Corre E, Coelho SM, Cock JM: Life-cycle-generation-specific developmental processes are modified in the immediate upright mutant of the brown alga Ectocarpus siliculosus. Development 2008, 135:1503-1512. Dring M: Stress Resistance and Disease Resistance in Seaweeds: The Role of Reactive Oxygen Metabolism. Adv Bot Res 2006, 43:176-207. Giacomazzi S, Cochet N: Environmental impact of diuron transformation: a review. Chemosphere 2004, 56:1021-1032. Graymore M, Stagnitti F, Allinson G: Impacts of atrazine in aquatic ecosystems. Environ Int 2001, 26:483-495. Funk CD: Prostaglandins and Leukotrienes: Advances in Eicosanoid Biology. Science 2001, 294:1871-1875. Blée E: Impact of phyto-oxylipins in plant defense. Trends Plant Sci 2002, 7:315-21. Cosse A, Leblanc C, Potin P: Dynamic Defense of Marine Macroalgae Against Pathogens: From Early Activated to Gene Regulated Responses. Adv Bot Res 2007, 46:222-266. Czechowski T, Stitt M, Altmann T, Udvardi MK, Scheible WR: Genome-wide identification and testing of superior reference genes for transcript normalization in Arabidopsis. Plant Physiol 2005, 139:5-17. Baldauf SL: The deep roots of eukaryotes. Science 2003, 300:1703-1706. Starr RC, Zeikus JA: The culture collection of algae at the University of Texas at Austin. J Phycol 1993, 29:90-95. Apt KE, Clendennen SK, Powers DA, Grossman AR: The gene family encoding the fucoxanthin chlorophyll proteins from the brown alga Macrocystis pyrifera. Mol Gen Genet 1995, 246:455-464.
http://www.biomedcentral.com/1471-2199/9/75
Publish with Bio Med Central and every scientist can read your work free of charge "BioMed Central will be the most significant development for disseminating the results of biomedical researc h in our lifetime." Sir Paul Nurse, Cancer Research UK
Your research papers will be: available free of charge to the entire biomedical community peer reviewed and published immediately upon acceptance cited in PubMed and archived on PubMed Central yours — you keep the copyright
BioMedcentral
Submit your manuscript here: http://www.biomedcentral.com/info/publishing_adv.asp
Page 9 of 9 (page number not for citation purposes)