BMC Proceedings
BioMed Central
Open Access
Proceedings
Combining multiple family-based association studies Hua Tang*1, Jie Peng†2, Pei Wang†3, Marc Coram and Li Hsu3 Address: 1Department of Genetics, Stanford University School of Medicine, 300 Pasteur Drive, Stanford, California 94305, USA, 2Department of Statistics, University of California, Davis, California 95616, USA and 3Division of Public Health Sciences, Fred Hutchinson Cancer Research Center, 1100 Fairview Avenue North, Seattle, Washington 98109, USA Email: Hua Tang* -
[email protected]; Jie Peng -
[email protected]; Pei Wang -
[email protected]; Marc Coram -
[email protected]; Li Hsu -
[email protected] * Corresponding author †Equal contributors
from Genetic Analysis Workshop 15 St. Pete Beach, Florida, USA. 11–15 November 2006 Published: 18 December 2007 BMC Proceedings 2007, 1(Suppl 1):S162 Marsha A Wilcox, John
Genetic S Witte, Qiong Analysis Yang, Workshop Andreas Ziegler, 15: Gene Laura Expression Almasy Analysis and Jean and W MacCluer Approaches to Detecting Proceedings Multiple Functional Loci
http://www.biomedcentral.com/content/pdf/1753-6561-1-S1-info.pdf Heather J Cordell, Mariza de Andrade, Marie-Claude Babron, Christopher W Bartlett, Joseph Beyene, Heike Bickeböller, Robert Culverhouse, Adrienne Cupples, E Warwick Daw, Josée Dupuis, Catherine T Falk, Saurabh Ghosh, Katrina A Goddard, Ellen L Goode, Elizabeth R Hauser, Lisa J Martin, Maria Martinez, Kari E North, Nancy L Saccone, Silke Schmidt, William Tapper, Duncan Thomas, David Tritchler, Veronica J Vieland, Ellen M Wijsman,
This article is available from: http://www.biomedcentral.com/1753-6561/1/S1/S162 © 2007 Tang et al; licensee BioMed Central Ltd. This is an open access article distributed under the terms of the Creative Commons Attribution License (http://creativecommons.org/licenses/by/2.0), which permits unrestricted use, distribution, and reproduction in any medium, provided the original work is properly cited.
Abstract While high-throughput genotyping technologies are becoming readily available, the merit of using these technologies to perform genome-wide association studies has not been established. One major concern is that for studies of complex diseases and traits, the whole-genome approach requires such large sample sizes that both recruitment and genotyping pose considerable challenge. Here we propose a novel statistical method that boosts the effective sample size by combining data obtained from several studies. Specifically, we consider a situation in which various studies have genotyped non-overlapping subjects at largely non-overlapping sets of markers. Our approach, which exploits the local linkage disequilibrium structure without assuming an explicit population model, opens up the possibility of improving statistical power by incorporating existing data into future association studies.
Background The past few years have seen a rapid development in highthroughput genotyping platforms, making genome-wide association studies technologically feasible. Yet the merit of using these technologies to perform genome-wide association studies has not been established [1]. Insufficient sample size is a particular concern in genome-wide association studies for several reasons. First, the genotyping cost, even though decreasing, nonetheless puts a pressure to reduce the number of individuals assayed. Second, the sample size required to declare statistical significance is increased as a result of the large number of hypotheses tested. Third, a majority of these studies investigate com-
plex diseases, in which each disease variant confers a moderate risk. Thus, assuming an odds ratio of 1.5 and an allele frequency of 0.2, more than 1000 cases and controls are required for a statistical power of 80% and a significance level of p < 10-6 [2]. Several approaches are being developed to improve the efficiency of genome-wide association studies. One attractive solution is a multi-stage design, in which only a subset of individuals are genotyped at the full set of markers in the initial phase. In subsequent stages, additional individuals are genotyped at increasingly restricted marker sets [3]. In the context of family-based association testing,
Page 1 of 6 (page number not for citation purposes)
BMC Proceedings 2007, 1(Suppl 1):S162
methods have also been developed that use the same data for genomic screening and replication [4]. Both of these methods focus on reducing the number of hypotheses tested. As an alternative, we note that association studies of some diseases, such as rheumatoid arthritis (RA), are being performed by more than one group of investigators, giving rise to multiple data sets [5,6]. One major challenge is that subjects from different studies, or within a study over the study period, may be genotyped by different platforms; therefore, different sets of single-nucleotide polymorphisms (SNPs) are assayed. In linkage analysis, it is relatively straightforward to combine families genotyped at different marker panels: a LOD score at an unobserved marker may be evaluated using neighboring observed markers through multipoint interval mapping techniques [7]; LOD scores at corresponding genome locations can then be added across families. In contrast, to our knowledge, a multipoint interval mapping approach has not been developed in the context of linkage disequilibrium (LD) association studies. This is because without a priori knowledge of LD patterns between markers, it is difficult to infer LD between disease and an unobserved marker based on neighboring observed markers. Furthermore, haplotypes constructed on each study cannot be easily combined. On the other hand, there is evidence that strong LD exists among tightly linked markers, and therefore we expect the test statistics at these markers to be correlated [8]. In this paper, we propose a novel approach that allows us to increase the effective sample size by combining data obtained from several studies. Specifically, we consider a situation in which both the subjects and marker panels are non-overlapping among the studies. In this situation, it is not possible to evaluate LD between markers from different panels. Our approach, which exploits the local LD structure without assuming an explicit population model, opens up the possibility of improving statistical power by incorporating existing data into future association studies. We illustrate our method by analyzing the simulated RA data. We had no knowledge of the "answers" at the time of analysis.
Methods We have previously described a multipoint transmissiondisequilibrium test (TDT) method that is based on local smoothing [8]. Our study demonstrated that a) TDT statistics at tightly linked markers are correlated, and b) when tightly linked markers are genotyped, the smoothed TDT statistics can achieve a greater statistical power compared with the non-smoothed version. These findings suggest that TDT statistics can be combined, even though the
http://www.biomedcentral.com/1753-6561/1/S1/S162
different studies have genotyped non-overlapping set of markers. Combining data sets with non-overlapping markers and individuals In this section, we outline our statistical methodology in a simple setting: two studies have genotyped non-overlapping sets of markers on independent sets of individuals in a common genomic region, and both studies have used a case-parents trio design. In each study, the TDT statistics, TDTA or TDTB, can be computed at the genotyped markers [9].
To motivate our test statistic, we first consider a marker that has been genotyped in both studies. In Study A, let b1 denote the number of informative transmissions, in which A alleles are transmitted but a alleles are not transmitted, and let c1 denote the converse (i.e., a alleles but not A alleles are transmitted). Likewise, let b2 and c2 denote the corresponding numbers of informative transmissions in Study B. With complete genotype data, we would compute the TDT by pooling the data: Tpool
=
(b1 + b2 − c1 − c2 )2 b1 + b2 + c1 + c2
(b1 − c1 )2 b1 + c1 (b − c )2 b2 + c2 2(b1 − c1 )(b2 − c2 ) + 2 2 + b1 + c1 b1 + b2 + c1 + c2 b2 + c2 b1 + b2 + c1 + c2 b1 + b2 + c1 + c2 n1 n2 A B 2(b1 − c1 )(b2 − c2 ) = TDT + TDT + . n1 + n2 n1 + n2 b1 + b2 + c1 + c2
=
We next show that, under the null hypothesis, the last term in Eq. (1) has an expectation of 0. Let R1 = B1 + C1 > 0 (the capital letters denote the random variables), and R2 = B2 + C2 > 0. Under the null hypothesis, L(B1 | R1) ~ Binom(R1, 0.5), L(B2 | R2) ~ Binom(R2, 0.5), and B1 and B2 are independent. We then have: ⎡ ⎛ (B1 − C1 )(B2 − C2 ) ⎞ ⎤ ⎛ (B − C1 )(B2 − C2 ) ⎞ E⎜ 1 ⎟ | R1 , R2 ⎥ ⎟ = E ⎢ E⎜ B B C C B B C C + + + + + + ⎥⎦ 2 ⎠ 2 1 2 ⎠ 2 1 ⎝ 1 ⎣⎢ ⎝ 1 ⎡ 1 ⎤ = E⎢ E(2B1 − R1 | R1 )E(2B2 − R2 | R2 ) ⎥ = 0. ⎣ R1 + R2 ⎦
Therefore, under the null hypothesis, the pooled TDT statistic is nearly a weighted average of the corresponding TDT statistics in the respective studies. The weights are proportional to the number of informative parents (ni = bi + ci). Assuming that the two studies sampled comparable populations (e.g., allele frequencies are similar at all loci), we approximate these weights by the number of trios. For a marker that is not genotyped in one study (but is genotyped in the other), we try to impute the TDT statistic using neighboring markers. We then add the observed and imputed TDT scores from the two studies. Suppose M markers have been genotyped by either Study A or Study
Page 2 of 6 (page number not for citation purposes)
BMC Proceedings 2007, 1(Suppl 1):S162
B. Denote the physical locations of these markers by A ] be a vector indicating {t1,...,tM}. Let V A = [v1A ,… , vM
whether marker m is genotyped in Study A. Denote the TDT statistics using each of the two samples as TDTA and TDTB, respectively. Let fA(t) be the results of applying a local linear regression fitting to (ti, TDTA) data. At each marker, we compute:
T A (t i ) = viA TDT A (t i ) + (1 − viA ) f A (t i ). In other words, if a marker is genotyped in Study A (vA = 1), we simply take the TDT statistic; if a marker ti is not gentoyped in Study A, we impute its expected TDT statistic using the predicted value. Similarly, we compute TB(t) using data from Study B. The combined test statistic at each marker is simply:
TDTcomb (t i ) =
n1 n2 T A (t i ) + T B (t i ). n1 + n2 n1 + n2
We implement the imputation step using the loess function in R. The choice of the smoothing parameter depends on many factors such as the age of the disease mutation, the population under study, and the marker density. While an optimal window size is difficult to define, an examination of inter-marker LD guides our choice: we seek a region within which the genotyped markers are in high LD. Roughly speaking, we are faced with a trade-off between bias and variance: smoothing over a wide region tends to reduce variance of the imputed statistics at the cost of an increased bias. Therefore, an alternative to loess with pre-specified bandwidth is a smoothing spline with the degree of freedom chosen by cross-validation. To properly account for the imputation, and to correct for multiple comparison, we perform a simulation-based test: conditioning on the parents' genotype, we generate the transmitted and the non-transmitted haplotypes under the null hypothesis, re-impute the TDT statistics, and compute TDTcomb on the simulated data. The observed maxiTDTcomb(ti) is compared with the null distribution of the corresponding maxima in the simulated data. Data set example To illustrate our proposed method, we analyze Replicate 1 of the simulated RA data. This data set consists of 1500 nuclear families, each of which has both parents and two affected children genotyped. It is known that there is a strong effect of DR type at the HLA locus on chromosome 6. A simple TDT analysis using all 1500 families unambiguously demonstrates preferential transmission of DR-2 or DR-3 alleles to the affected individuals. However, is the DR allele the sole variant affecting the disease in the region? To address this question, we examine the trans-
http://www.biomedcentral.com/1753-6561/1/S1/S162
mission from parents who are homozygous 1/1 at the DR locus. If the DR locus explains the entire association in the region, conditioning on parents being 1/1, there should not be preferential transmission at any markers nearby. Among 1500 mothers, 70 have genotype 1/1. Our analyses highlight a practical difficulty: performing stratified analysis on a subset of samples further reduces the sample size; thus, stratified analyses are particularly likely to suffer from small sample size even when the main study has good power. On chromosome 6, we restrict ourselves to the 293 SNP markers falling within 1.5 × 10⁶ bp around the DR locus. We consider a situation in which each third of the families are genotyped on a different platform. The 293 SNPs are randomly divided into three sets, and there is no overlap in the three sets of markers or individuals. Because the risk of RA is much higher among women, we hypothesize that there may be gene × sex interaction. Furthermore, there has been ambiguous evidence regarding maternally transmitted risk elements [10]. Therefore, we looked at four types of transmission: father to son, father to daughter, mother to son, and mother to daughter. Because the phase is known for all the affected children, the four types of transmission can be examined independently. For each type of transmission, we perform a TDT analysis on each of the three subsets of families. Because the diagnosis of RA is often ambiguous, we hypothesized that the more severe cases are more likely to carry the genetic risk factor. Therefore, a severity measure, on the scale of 1 to 5, is used as a relative weight. We then combine the three sets of TDT scores to compute TDTcomb, with a bandwidth approximately 15 markers.
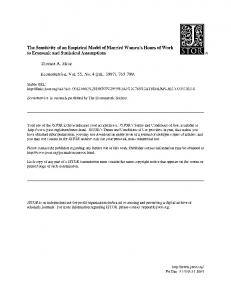
Results The results of various TDT test for the mother-daughter transmission in the 3-cM region are shown in Figure 1. Figure 1a displays the TDT scores using each subset of one-third of the families. Because the transmissions from a mother to two daughters are independent, a meaningful measure of sample size is the mother-daughter pairs. In our data, the numbers of mother-daughter transmissions in the three subsets are 46, 39, and 23, respectively. For all TDT tests, we use 10,000 permutations to establish the null distribution and significance level. The p-values of TDT on the three subsets are 0.0011, 0.02, and 0.61, respectively. In Figure 1b, the points represent the TDT scores from subset A (families 1–500) and the solid line represents the loess prediction, n1 n 2 TDTcomb (t i ) = T A (t i ) + T B (t i ). . Figure 1c n1 + n2 n1 + n2 compares the TDT scores when all markers are genotyped in every individual (TDTall, open square) versus TDTcomb Page 3 of 6 (page number not for citation purposes)
BMC Proceedings 2007, 1(Suppl 1):S162
(filled points). While the maximum value achieved by TDTcomb appears substantially lower than the corresponding value by TDTall, the same is true under the null hypothesis, because the imputed TDT statistics tend to be smoother than observed ones. As a result, at a specific significance level (say, 0.99), the critical value for TDTall is 17.38, while the corresponding critical value for TDTcomb is 6.87. We perform a quantile transformation based on the null distribution, and Figure 1d compares TDTall with transformed TDTcomb. It indicates that, upon suitable transformation, TDTcomb can achieve similar significance level as if TDTall. However, the location of the peak shifts slightly: while the marker with highest TDTall lies to the
http://www.biomedcentral.com/1753-6561/1/S1/S162
right of the DR locus, that with the highest TDTcomb lies to the left of DR locus. Another consequence of smoothing and imputing TDT scores is that the "peak" of TDTcomb appears somewhat narrower than TDTall. In a similar fashion, we analyzed the other three types of transmission. The results, summarized in Table 1, suggest the existence of another variant that influences the disease risk. Interestingly, transmission is distorted in mother-daughter and father-daughter transmission, but not transmissions to sons. This suggests possible gene × sex interaction. Finally, while we set out to use severity as a relative weight for each individual, retrospective comparison indicates that the weight makes little difference.
Figure TDT tests 1 for mother-daughter transmissions, restricted to mothers with DR genotype 1/1 TDT tests for mother-daughter transmissions, restricted to mothers with DR genotype 1/1. a, TDT for three subsets separately. Dotted vertical line indicates the location of DR locus. b, TDT scores using sub-sample A (square) versus imputed scores (line). c, TDT scores assuming all markers are genotyped in each individual (TDTall), open square) versus TDTcomb. Dotted line indicates 0.01 critical value for TDTall, and solid line represents the corresponding critical value for TDTcomb. d, Comparison of TDTall and TDTcomb after a quantile transformation.
Page 4 of 6 (page number not for citation purposes)
BMC Proceedings 2007, 1(Suppl 1):S162
http://www.biomedcentral.com/1753-6561/1/S1/S162
Table 1: Results of TDT tests for sex- and parent-specific transmissions
Transmission
TDTA
TDTB
TDTC
TDTall
TDTcomb
Mother-daughter Father-daughter Mother-son Father-son
0.0011 6 × 10⁻⁴ 0.056 0.22
0.019