JOURNAL OF BONE AND MINERAL RESEARCH Volume 24, Number 10, 2009 Published online on May 4, 2009; doi: 10.1359/JBMR.090501 Ó 2009 American Society for Bone and Mineral Research
Bone Morphogenetic Protein 7 (BMP7) Gene Polymorphisms Are Associated With Inverse Relationships Between Vascular Calcification and BMD: The Diabetes Heart Study Barry I. Freedman,1 Donald W. Bowden,1,2,3 Julie T. Ziegler,4 Carl D. Langefeld,4 Allison B. Lehtinen,2,3 Megan E. Rudock,2,3 Leon Lenchik,5 Keith A. Hruska,6 Thomas C. Register,7 and J. Jeffrey Carr5
ABSTRACT: Inverse relationships have been observed between BMD and vascular calcification (VC), suggesting an underlying metabolic pathway linking these processes. Bone morphogenetic proteins (BMPs) are potential candidate genes that may mediate this relationship. Four single nucleotide polymorphisms (SNPs) in the BMP2 gene, 2 SNPs in BMP4, and 16 SNPs in BMP7 were tested for association with measures of VC using CT (coronary and carotid arteries, abdominal aorta), and BMD was measured using DXA (lumbar spine, hip, and distal radius) and quantitative CT (QCT; thoracic and lumbar spine) in 920 European Americans from 374 Diabetes Heart Study families: 762 with type 2 diabetes. Variance components quantitative trait locus association analysis was computed using SOLAR software, and a bivariate principal component analysis (PCA) assessed for genetic relationships between BMD and VC. Association was observed between several measures of BMD and BMP7 rs17404303 (thoracic spine QCT p = 0.03; lumbar spine QCT p = 0.02; hip DXA p = 0.06, dominant models). In addition, 6 of 16 BMP7 SNPs showed significant and opposing effects on the bivariate PCA for VC and BMD (two-sided exact test, p = 0.0143). Polymorphisms in BMP7 are associated with inverse relationships between bone mineralization and VC in the coronary, carotid, and abdominal aorta in a diabetes-enriched cohort of European Americans. J Bone Miner Res 2009;24:1719–1727. Published online on May 4, 2009; doi: 10.1359/JBMR.090501 Key words: BMP2, BMP4, BMP7, BMD, diabetes mellitus, calcified atherosclerotic plaque, osteoporosis Address correspondence to: Barry I. Freedman, MD, Department of Internal Medicine, Section on Nephrology, Wake Forest University School of Medicine, Medical Center Boulevard, Winston-Salem, NC 27157-1053, USA, E-mail:
[email protected]
INTRODUCTION
L
OW BMD AND AORTIC calcification seem to be related disorders.(1) Cross-sectional studies showed the coincident occurrence of low BMD and atherosclerosis in postmenopausal women; low bone mass has also been linked to cardiovascular disease (CVD) morbidity and mortality.(2–4) Longitudinal studies also showed inverse relationships between changes in bone mass and vascular calcification (VC).(5–7) Schulz et al.(6) reported that the increase in aortic calcium over time explained 47% of the observed decline in BMD in postmenopausal women. Women in the highest quartile for gain in aortic VC had four times the annual rate of bone loss compared with those in the lowest quartile. This inverse relationship was present regardless of the initial BMD or VC score. These effects are particularly pronounced in women, in part because of the well-known beneficial effects of endogenous
The authors state that they have no conflicts of interest.
estrogen on the skeleton and cardiovascular system. Once menopause occurs, accelerated bone loss and increased rates of CVD follow. Vascular calcification was inversely related to BMD in type 2 diabetic European-American men (EA) and black women from Diabetes Heart Study (DHS) families, an effect that persisted after adjustment for age and other covariates.(8) The relationship between VC and BMD in this diabetes-enriched group was significantly influenced by age, sex, and ethnicity, with effect modification in black women receiving supplemental estrogen. After adjustment for body mass index (BMI) and covariates, diabetes was not independently associated with either areal BMD measured by DXA or volumetric measurement of vertebral trabecular BMD measured by QCT,(9) although diabetic subjects had increased CVD risk and higher burdens of VC. Bone morphogenetic proteins (BMPs) are growth factors and members of the TGFb superfamily. BMP signaling through the Smad 1, 5, and 8 pathways plays major roles in development of the heart, kidney, nerve, and cartilage, as
1
Department of Internal Medicine, Wake Forest University School of Medicine, Winston-Salem, North Carolina, USA; 2Department of Biochemistry, Wake Forest University School of Medicine, Winston-Salem, North Carolina, USA; 3Center for Human Genomics, Wake Forest University School of Medicine, Winston-Salem, North Carolina, USA; 4Department of Biostatistical Sciences, Wake Forest University School of Medicine, Winston-Salem, North Carolina, USA; 5Department of Radiologic Sciences, Wake Forest University School of Medicine, Winston-Salem, North Carolina, USA; 6Department of Pediatrics, Washington University School of Medicine, St. Louis, Missouri, USA; 7Department of Pathology, Wake Forest University School of Medicine, Winston-Salem, North Carolina, USA.
1719
1720
FREEDMAN ET AL.
well as an important role in bone formation. Regulatory and signaling molecules related to calcium metabolism and bone formation, including BMPs, have been hypothesized to play important roles in VC,(10) a pathologic process influenced by metabolic and genetic factors. Microscopic calcifications are noted in the early lesions of atherosclerosis, with calcium granules forming intracellularly in vascular smooth muscle cells and appearing in extracellular matrix vesicles in the decade after puberty.(11–13) We hypothesized that variants in BMP genes might play a role in the inverse relationship between skeletal and vascular mineralization. This study assessed whether polymorphisms in BMP2, BMP4, and BMP7 were associated with the relationship between VC and BMD, as well as with individual measures of VC and BMD in different bone and vascular regions.
MATERIALS AND METHODS Study population The DHS recruited a biracial cohort of families containing at least two siblings with type 2 diabetes in northwestern North Carolina, as well as available parents and one nondiabetic sibling. Diabetes was clinically diagnosed after the age of 34 yr, and all diabetic subjects were actively receiving medical treatment (oral agents and/or insulin) or had fasting blood glucose >126 mg/dl, in the absence of historical evidence of diabetic ketoacidosis. These analyses were limited to self-described European Americans because of their larger sample size. The study was approved by the Institutional Review Board at the Wake Forest University School of Medicine, and all participants provided written informed consent. The examination included interviews for medical history, current medications, and health behaviors. Measurements of body size, resting blood pressure, 12-lead electrocardiogram, fasting blood draw, and urine collection were conducted in the General Clinical Research Center. History of prevalent CVD was provided by participant self-report.
Bone and vascular imaging VC was measured in the coronary and carotid arteries and abdominal aorta using single and multidetector CT systems incorporating a standardized protocol based on those currently implemented in the National Heart Lung and Blood Institute’s (NHLBI) MultiEthnic Study of Atherosclerosis (MESA) studies and reported as an Agatston score modified to account for slice thickness.(14) DXA scans of posterior-anterior spine, proximal femur, forearm, and whole body were obtained using a fan-beam scanner (Delphi A; Hologic, Waltham, MA, USA) to determine areal BMD (g/cm2). QCT for volumetric trabecular BMD (mg/cm3) of the thoracic and lumbar vertebrae were measured using the same CT images obtained for calcified plaque in the coronary and abdominal aorta using an external calibration phantom using previously published methods.(15) Detailed descriptions of these radiographic examinations have been reported.(8,15)
Genetic analysis Total genomic DNA was purified from whole blood samples obtained from subjects using the PUREGENE DNA isolation kit (Gentra, Minneapolis, MN, USA). DNA concentration was quantified using standardized fluorometric readings on a Hoefer DyNA Quant 200 fluorometer (Hoefer Pharmacia Biotech, San Francisco, CA, USA). Each sample was diluted to a final concentration 5 ng/ml. Single nucleotide polymorphisms (SNPs) in the BMP2 and BMP7 genes were selected from the HapMap database (http://www.hapmap.org/cgi-perl/gbrowse/hapmap _B36/).(16) Specifically, tagging SNPs for the population of CEPH Utah residents with ancestry from northern and western Europe (CEU population) were selected using the greedy pairwise tagging algorithm implemented in the Tagger program(17) of Haploview.(18) Setting the minimum minor allele frequency to 0.05 and the r2 threshold to 0.80 resulted in 24 SNPs in BMP7, 5 SNPs in BMP2, and 2 SNPs in BMP4 to be evaluated. Primers for PCR amplification and extension reactions were designed using the MassARRAY Assay Design Software (Sequenom, San Francisco, CA, USA). Genotypes were determined using a MassARRAY SNP Genotyping System (Sequenom; Oeth P Sequenom Application Note 2005). This genotyping system uses single-base extension reactions to create allele-specific products that are separated and scored in a matrix-assisted laser desorption ionization/time of flight mass spectrometer.
Statistical methods The sample means, SDs, and medians were computed for the continuous characteristics, BMD, and the measures of subclinical CVD (abdominal aorta, coronary and carotid artery calcified plaque). The proportions were calculated for the discrete demographic characteristics. The five BMD measures and three CVD measures form two sets of intracorrelated traits. To capture the common variant and contrasting variation among these measures, two principal component analyses (PCAs) were computed. To maximize the use of the available data and whether an observation had a missing value for exactly one trait, a linear regression model was used to impute the missing data only for the PCA. The BMD principal component was well approximated by the contrast between the weighted mean of the DXA and CT measures:
BMDPC2 ¼ ð2 3 DXA Radial Ultra Distal BMDÞ þðDXA Hip BMDþ DXA Spine BMDÞ 4 Thoracic Spine CT þ Lumbar Spine CT 2 2 The VC principal component was computed as the average of the standardized measures (mean = 0 and variance = 1) of VC in the three vascular beds. The rationale for the PC analysis was to identify variants common to multiple traits and shared variation (e.g., pleiotropy). The bivariate tests of association, like any multivariate ANOVA (MANOVA) approach, further exploit the common
BMP7 IN BONE AND CARDIOVASCULAR DISEASE variation and increase statistical power for common effects. Searching for associations with the common sources of variation reduced the number of tests and allowed us to test our primary inference. Each SNP was examined for Mendelian inheritance using the program PedCheck(19) and departures from HardyWeinberg Equilibrium (HWE) expectations. A series of variance component measured genotypes models were computed using the software SOLAR(20) to test for the association between an individual SNP and the traits of interest. The model included age, sex, type 2 diabetes affection status, smoking (yes/no), lipid medications (yes/ no), and body mass index (BMI). A separate model was computed for each individual measure of BMD, subclinical CVD measured by VC, and the principal components of BMD and VC. To best approximate the distributional assumptions of the model, the conditional distribution of each trait was examined for departures from normality and homogeneity of variance given the covariates. The individual measures of BMD and VC were either natural logtransformed (coronary and carotid artery calcium) or square root-transformed (aortic calcium and lumbar BMD); the remaining traits and the principal components did not require transformation. Standard regression diagnostics were used to examine the set of covariates for collinearity and influence. To examine the association with the joint distribution of the VC principal component with each individual BMD principal component, a bivariate association analysis was computed.
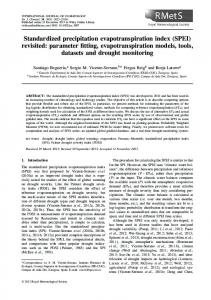
RESULTS The study sample consisted of 920 European Americans from 347 DHS families, 762 with type 2 diabetes. Demographic characteristics are listed in Table 1. Among diabetic subjects, the mean (SD) diabetes duration was 10.3 (7.0) yr, and 41.7% of DHS participants were taking statins. One hundred thirty-seven women (28%) reported receiving estrogen, 21 reported bisphosphonates, and 15 reported selective estrogen receptor modulators (SERMs). High levels of VC, and thus high atherosclerotic plaque burden, were present at all vascular territories, consistent with the high cardiovascular risk inherent in a cohort of families with type 2 diabetes. There were 170 missing data imputed for BMD, 1 DXA lumbar spine (L-spine), 0 DXA hip, 3 DXA radius, 6 QCT thoracic spine (T-spine), and 160 QCT L-spine, and 286 missing data imputed for VC (61 coronary artery, 9 carotid artery, and 216 aorta). Table 2 lists the SNPs that were evaluated. Of 24 BMP7 SNPs, 8 failed assay design, and the remaining 16 genotyped SNPs captured 0.837 of the genetic variation of all 126 SNPs under the BMP7 region as defined by r2, with 71% of alleles captured with r2 > 0.8. The mean genotyping success rate for the 16 BMP7 SNPs was 97.4%, with rs13037653 having the lowest success rate (96.3%) and rs172983 having the highest success rate (98.8%). Of the five BMP2 SNPs, one failed assay design, with the remaining four SNPs capturing 100% of the variation of the six SNPs in BMP2 with a mean r2 of 0.794. The mean
1721 TABLE 1. Demographic Characteristics for the European American DHS Study Population
N Age (yr) Percent female Percent type 2 diabetes Diabetes duration (yr) Smoking status (%) Current Past Never Percent hypertension Percent lipid medications BMI (kg/m2) Systolic BP (mmHg) Diastolic BP (mmHg) HbA1c (proportion of total) Fasting glucose (mM) Serum creatinine (mM) Estimated GFR (ml/s) Urine ACR (mg/mmol) LDL cholesterol (mM) HDL cholesterol (mM) Triglycerides (mM) Total cholesterol (mM) Highly sensitive CRP (mM) Carotid artery IMT (mm) Coronary artery VC Carotid artery VC Abdominal aorta VC DXA hip BMD (g/cm2) DXA L-spine BMD (g/cm2) DXA distal radius BMD (g/cm2) QCT T-spine BMD (mg/cm3) QCT L-spine BMD (mg/cm3)
920
750
920 918 918 917 918 918 861 895 854 915 915 915 761 866 776 851 616 779 777 783 867 622
Mean ± SD (median) or percentage 61.5 ± 9.4 (61.5) 55.8% 82.8% 10.3 ± 7.0 (8.0) 16.7% 41.6% 41.7% 83.9% 41.7% 31.8 ± 6.7 (30.7) 139.0 ± 19.1 (137.5) 72.9 ± 10.1 (72.5) 0.073 ± 0.017 (0.069) 7.8 ± 3.1 (7.1) 94.7 ± 22.1 (92.9) 1.13 ± 0.30 (1.10) 12.8 ± 61.5 (1.3) 2.75 ± 0.83 (2.67) 1.13 ± 0.32 (1.09) 2.29 ± 1.47 (1.95) 4.88 ± 1.07 (4.77) 0.49 ± 0.73 (0.24) 0.672 ± 0.129 (0.651) 1222 ± 2458 (254) 322.0 ± 681.9 (54.0) 3420 ± 4398 (1651) 0.974 ± 0.167 (0.965) 1.05 ± 0.18 (1.03) 0.437 ± 0.078 (0.440) 142.5 ± 41.7 (140.1) 128.1 ± 39.0 (126.6)
genotyping success rate for BMP2 was 0.971 with a minimum efficiency of 0.963. The two BMP4 SNPs captured 100% of the variation of the three SNPs in this region, with a mean r2 of 0.977. The genotyping efficiency was 0.981 (rs2071047) and 0.977 (rs762642) for BMP4. The genotyping consensus rate for duplicate DNA samples within and across DNA plates was 100% for all SNPs. The allele and genotype frequencies for one SNP in BMP7 deviated from HWE expectations (rs193044 in EAs, p = 0.020) because of an excess of observed minor allele homozygotes and a corresponding deficiency in the observed number of heterozygotes compared with expected. For BMP7, two blocks of linkage disequilibrium (LD) were observed in European Americans, as defined by the D9 statistic using the CI algorithm(21) implemented in Haploview(18) (Fig. 1). For BMP2 and BMP4, the CI algorithm defined a single LD block in European Americans (data not shown). There was no significant LD between the two SNPs in BMP4, with a D9 of 0.51 and an r2 of 0.23 using the CI algorithm. Association results for BMP2 and BMP4 SNPs with BMD, VC, univariate, and bivariate PCA for these measures are contained in Supplementary Tables 1–4. The bivariate PCA provided a tool to quantify the strength of
1722
FREEDMAN ET AL. TABLE 2. BMP2, BMP4, and BMP7 SNPs Evaluated
SNP BMP2 rs1005464 rs235768 rs3178250 rs170986 BMP4 rs2071047 rs762642 BMP7 rs2182435 rs3787380 rs13037653 rs6070015 rs6064508 rs6123674 rs6123678 rs6123679 rs172983 rs17404303 rs193044 rs7273197 rs6127978 rs6064517 rs6127984 rs6014967
Physical Major/minor Minor allele HWE exact location allele frequency p value 20p12 6704148 6707115 6708201 6708431 14q22 53488161 53492803 20q13 55183611 55187517 55187646 55192062 55193974 55196354 55219129 55224755 55233446 55237094 55237523 55245465 55252580 55253755 55258000 55269435
G/A T/A T/C C/A
0.213 0.397 0.191 0.158
0.088 0.663 0.867 0.164
C/T T/G
0.415 0.408
0.391 0.164
C/A A/G A/G C/T A/G T/C G/A A/C C/T G/A G/T G/A T/C G/A C/T C/T
0.078 0.394 0.069 0.069 0.373 0.435 0.490 0.018 0.096 0.420 0.433 0.326 0.145 0.112 0.337 0.204
0.257 0.155 0.396 0.240 0.506 1.000 0.211 1.000 0.763 0.750 0.020 0.553 0.674 1.000 0.815 1.000
association between SNPs in BMP and relationships (inverse or parallel) between an overall measure of BMD and VC within one analysis. None of the BMP2 or BMP4 SNPs showed significant bivariate PCA results for BMD and VC with a consistent graded effect for the median result across genotypes. Six of 16 BMP7 SNPs showed significant, graded, and opposing effects on the bivariate PCA for VC and BMD (Table 3; two-sided exact test, p = 0.0143; KolmogrovSmirnov test, p < 0.001). For example, the genotypic means for rs17404303 were negative in a graded fashion across genotypes (1/1; 1/2; 2/2) for the BMD principal component and positive for the VC principal component. The bivariate BMD-VC PCA for rs17404303 was significant for the 2 df, additive, and recessive models (p = 0.040, 0.019, and 0.016, respectively). Minor allele homozygotes at rs17404303 had significantly decreased median BMD and higher median VC. In contrast, 0 of 16 BMP7 SNPs showed graded parallel relationships across genotypes for the median VC and BMD results (Table 3). Associations between BMD traits and BMP7 SNPs were significant at p < 0.05 for 4 of 16 SNPs tested using DXA (Supplementary Table 5) and 2 of 16 SNPs tested using QCT (Supplementary Table 6). After adjustment for age, sex, diabetes, smoking, BMI, and lipid medications, association was observed between BMP7 SNP rs17404303 and thoracic spine-QCT (dominant model, p = 0.027), lumbar spine-QCT (2 df model, p = 0.023; dominant model, p = 0.018), and distal radius-DXA (2 df model, p = 0.003; dominant model, p = 0.006), with a trend for hip-DXA (dominant model, p = 0.06). Associations between VC and
BMP7 SNPs are listed in Supplementary Table 7. A significant association was observed for 6 of 16 SNPs, most commonly with additive models at the carotid artery location. SNP rs6127984 was independently associated with both coronary and carotid artery VC, whereas rs6123674 and rs6123678 showed association with carotid artery VC with strong trends for coronary artery VC.
DISCUSSION Complex relationships exist between calcified atherosclerotic plaque and bone mineralization. In the DHS, EA men and black women had significant inverse associations between vertebral trabecular BMD measured by QCT and VC at multiple vascular sites, effects that remained significant after adjustment for age and other covariates.(8) The relationship between these phenotypes was influenced by age, sex, and ethnicity, with additional modification in women receiving supplemental estrogen. To detect unifying causes for the frequently observed inverse relationship between BMD and VC, three candidate genes in the BMP family were analyzed for evidence of genetic association. Although BMP2 and BMP4 SNPs were generally not associated, 6 of 16 SNPs in BMP7 showed significant and opposing effects on the bivariate PCA for VC and BMD (p = 0.0143). After adjustment for age, sex, diabetes, smoking, BMI, and lipid medications, association was also observed between several measures of BMD and BMP7 SNP rs17404303 (thoracic spine-QCT dominant model, p = 0.027; lumbar spine-QCT 2 df model, p = 0.023; dominant model, p = 0.018; hip-DXA 2 df, p = 0.003; dominant model p = 0.006). These results support a potential role for BMP7 polymorphisms in the causal pathways of VC and osteoporosis. Individuals in the DHS have extensive phenotype information for multiple metabolic parameters. The current analyses were intentionally limited to EA men and women because of the improved statistical power afforded by their larger sample size. BMD was measured using two complimentary approaches: DXA for measurement of areal BMD, the de facto standard for determining BMD in both clinical practice and the research setting, and QCT for measurement of volumetric BMD in the metabolically active trabecular bone component in the vertebrae. In addition, VC data were collected from the carotid, coronary, and abdominal aorta vascular beds, providing an overall assessment of systemic burden of atherosclerosis related to cerebrovascular, coronary heart disease, and peripheral arterial disease. A bivariate principal component analysis was performed to answer the fundamental question of whether BMP7 or BMP2 gene variants contribute to the observed inverse association between BMD and calcified vascular plaque. The bivariate PCA allowed testing of the contrast between a combined phenotype for BMD and VC versus SNPs of interest. Six of 16 BMP7 SNPs showed opposing and significant effects on the relationship between BMD and VC, whereas no BMP7 SNPs showed significant parallel relationships. We can only speculate on the physiologic effect(s) of BMP7 on the relationship between bone mineralization
BMP7 IN BONE AND CARDIOVASCULAR DISEASE
1723
FIG. 1. LD between the 16 SNPs genotyped in BMP7 in European Americans.
and VC formation. Arterial smooth muscle cells and pericytes can assume an osteoblastic phenotype associated with VC, and there is evidence for osteoblastic phenotypes in atherosclerotic calcification.(22,23) BMPs have been implicated in directing osteoblastic differentiation in both artery and bone and may play a role in the frequently observed inverse relationships between VC and BMD. BMP7 seems to be anabolic for bone and protective against VC.(22,24) In vitro studies suggest that BMP7 promotes the vascular SMC phenotype,(25) that BMP7 and BMP2 have interacting and often opposing metabolic effects,(26) and that receptors for the BMPs are expressed in vascular smooth muscle cells and involved in mediating the relative effects of BMP2 and BMP7.(27,28) In patients with end-stage renal disease (ESRD), low coagulation-activating hemodialyzers have been reported to reduce progression of atherosclerosis and modulate the relationship between BMP2 and BMP7(29) Because kidney disease impacts both BMD and VC, we repeated the PC analyses using Modification of Diet in Renal Disease estimated glomerular filtration rate (eGFR) as a covariate. No effect was seen on the six SNPs that showed inverse relationships between VC and BMD PC measures (data not shown). This was not unexpected as the DHS intentionally excluded subjects with known kidney disease (65.7% had eGFR > 60 ml/min, 33.2% had eGFR 30–59 ml/min, and 1.0% had eGFR < 29 ml/min, none 1 mm3. We are confident that the overwhelming majority of the VC we measured was related to intimal-medial atherosclerosis. Although calcified plaque is but one component of the advanced atherosclerotic lesion, it is a very good noninvasive surrogate for total plaque burden and ability to predict near term hard events(32,33) The molecular and metabolic pathways associated with the BMP7 SNPs examined in this study are unknown, because these SNPs reside in noncoding regions of the gene (seven in intron 1, three in intron 2, two in intron 3, and four in intron 4) and have no obvious effect on synthesized BMP7 protein. It is possible that key SNPs influence expression of BMP7 message and/or produce differential splicing of RNA, leading to truncated or variant protein products with altered function. Alterations in secreted levels of BMP proteins or the presence of variant proteins from differential splicing could lead to altered BMP–BMP receptor interactions. These downstream effects could occur in a tissue-specific manner as a result of local BMP synthesis or secretion.
1724
FREEDMAN ET AL. TABLE 3. Tests of Association: Principal Component and Bvariate Principal Component Analyses Genotypic means [mean ± SD (median)]
SNP
Trait
rs2182435*
BMDPC2 VCPC BMDPC2 VCPC BMDPC2 VCPC BMDPC2 VCPC BMDPC2 VCPC BMDPC2 VCPC BMDPC2 VCPC BMDPC2 VCPC BMDPC2 VCPC BMDPC2 VCPC BMDPC2 VCPC BMDPC2 VCPC BMDPC2 VCPC BMDPC2 VCPC BMDPC2 VCPC BMDPC2 VCPC BMDPC2 VCPC BMDPC2 VCPC BMDPC2 VCPC BMDPC2 VCPC BMDPC2 VCPC BMDPC2 VCPC BMDPC2 VCPC BMDPC2 VCPC BMDPC2 VCPC BMDPC2 VCPC BMDPC2 VCPC BMDPC2 VCPC BMDPC2 VCPC BMDPC2 VCPC BMDPC2 VCPC BMDPC2 VCPC
rs3787380*
rs13037653*
rs6070015†
rs6064508
rs6123674†
rs6123678†
rs6123679
rs172983*
rs17404303†
rs193044†
rs7273197†
rs6127978
rs6064517
rs6127984*
rs6014967
1/1
Model-based p values
1/2
2/2
2DF
Add
Dom
Rec
0.10 ± 0.80 (0.06) 5.22 ± 2.07 (5.42)
20.03 ± 0.81 (0.11) 5.20 ± 1.93 (5.48)
0.04 ± 1.30 (20.08) 4.84 ± 2.25 (4.49)
0.09 ± 0.81 (0.10) 5.11 ± 2.11 (5.09)
0.13 ± 0.83 (0.12) 5.28 ± 2.02 (5.62)
20.07 ± 0.73 (20.11) 5.19 ± 2.03 (5.48)
0.09 ± 0.81 (0.06) 5.23 ± 2.06 (5.46)
0.05 ± 0.76 (0.12) 5.11 ± 1.96 (5.06)
1.06 ± 1.62 (1.06) 5.70 ± 4.29 (5.70)
0.09 ± 0.81 (0.09) 5.17 ± 2.04 (5.38)
0.02 ± 0.76 (0.03) 5.40 ± 2.15 (5.97)
NA NA
0.12 ± 0.75 (0.07) 5.03 ± 2.05 (5.04)
0.05 ± 0.85 (0.07) 5.28 ± 2.03 (5.62)
0.10 ± 0.79 (0.06) 5.45 ± 2.08 (5.84)
0.14 ± 0.76 (0.08) 5.03 ± 2.02 (5.04)
0.06 ± 0.84 (0.10) 5.20 ± 2.05 (5.50)
0.05 ± 0.79 (20.04) 5.50 ± 2.06 (5.86)
0.10 ± 0.74 (0.06) 5.00 ± 1.95 (4.96)
0.08 ± 0.84 (0.11) 5.15 ± 2.11 (5.40)
0.06 ± 0.80 (20.001) 5.47 ± 2.00 (5.91)
0.08 ± 0.81 (0.06) 5.21 ± 2.04 (5.40)
0.10 ± 0.72 (0.26) 5.07 ± 2.31 (5.69)
NA NA
0.06 ± 0.81 (0.05) 5.21 ± 2.07 (5.39)
0.21 ± 0.76 (0.27) 5.20 ± 1.95 (5.48)
20.62 ± 0.44 (20.51) 4.26 ± 2.52 (5.04)
0.08 ± 0.79 (0.12) 4.99 ± 2.06 (4.98)
0.11 ± 0.82 (0.11) 5.19 ± 2.03 (5.41)
0.03 ± 0.79 (20.08) 5.55 ± 2.04 (5.95)
0.03 ± 0.76 (20.06) 5.40 ± 2.02 (5.74)
0.12 ± 0.84 (0.13) 5.14 ± 2.08 (5.41)
0.09 ± 0.77 (0.13) 5.07 ± 1.98 (4.98)
0.09 ± 0.82 (0.12) 5.04 ± 2.05 (4.98)
0.11 ± 0.80 (0.09) 5.28 ± 2.02 (5.60)
20.11 ± 0.71 (20.15) 5.54 ± 2.11 (6.05)
0.09 ± 0.81 (0.07) 5.25 ± 2.05 (5.42)
0.05 ± 0.79 (0.06) 5.08 ± 2.01 (5.29)
0.02 ± 0.58 (20.21) 4.57 ± 2.43 (4.33)
0.07 ± 0.80 (0.08) 5.18 ± 2.06 (5.40)
0.11 ± 0.79 (0.05) 5.24 ± 2.02 (5.73)
0.19 ± 1.28 (20.18) 5.63 ± 1.98 (5.61)
0.13 ± 0.83 (0.12) 5.12 ± 2.01 (5.06)
0.06 ± 0.80 (0.06) 5.27 ± 2.10 (5.64)
20.06 ± 0.75 (20.18) 5.18 ± 2.02 (5.43)
0.10 ± 0.82 (0.07) 5.25 ± 2.09 (5.52)
0.07 ± 0.78 (0.10) 5.15 ± 2.00 (5.24)
20.06 ± 0.74 (20.27) 4.62 ± 1.89 (4.68)
0.091 0.802 0.093 0.007 0.832 0.002 0.044 0.717 0.016 0.977 0.130 0.133 0.897 0.285 0.163 0.881 0.083 0.029 0.331 0.031 0.014 0.592 0.940 0.805 0.013 0.576 0.008 0.356 0.085 0.040 0.962 0.018 0.016 0.118 0.278 0.018 0.179 0.620 0.132 0.786 0.546 0.564 0.551 0.029 0.015 0.987 0.638 0.765
0.095 0.512 0.069 0.330 0.560 0.105 0.680 0.439 0.746 0.831 0.045 0.047 0.680 0.135 0.077 0.979 0.026 0.010 0.956 0.009 0.018 0.306 0.724 0.511 0.041 0.954 0.069 0.220 0.029 0.019 0.899 0.006 0.014 0.112 0.117 0.013 0.091 0.513 0.080 0.559 0.373 0.479 0.629 0.057 0.053 0.873 0.893 0.635
0.046 0.544 0.038 0.406 0.688 0.312 0.424 0.422 0.521 0.831 0.043 0.045 0.805 0.119 0.059 0.802 0.065 0.035 0.341 0.061 0.135 0.306 0.724 0.511 0.014 0.757 0.021 0.538 0.104 0.148 0.809 0.007 0.004 0.406 0.211 0.114 0.154 0.407 0.098 0.638 0.472 0.594 0.973 0.011 0.014 0.873 0.839 0.800
0.745 0.675 0.912 0.007 0.586 0.001 0.024 0.968 0.006 1.000 0.846 0.854 0.653 0.478 0.438 0.729 0.084 0.035 0.402 0.021 0.008 1.000 1.000 1.000 0.227 0.352 0.086 0.156 0.056 0.016 0.945 0.106 0.362 0.041 0.197 0.008 0.156 0.726 0.202 0.558 0.346 0.323 0.292 0.994 0.201 0.954 0.390 0.471
Pearson correlation of BMDPC2 with VCPC = 0.359. Genetic correlation of BMDPC2 with VCPC = 20.222 ± 0.145; environmental correlation of BMDPC2 with VCPC = 0.387 ± 0.148. * Significant bivariate PCA lacking graded effect for median result across genotypes. † Statistically significant opposing result for bivariate PCA across genotypes. NA, not applicable.
Given the roles of BMP7 in maintaining skeletal health and in differentiation of multiple cell types including vascular smooth muscle and osteoblasts,(34) it is conceivable that the vascular calcification phenotype associated with the minor allele homozygotes at BMP7 rs17404303 could
result from changes in skeletal osteoblast and vascular smooth muscle cell phenotype. Pathways that govern bone formation and bone remodeling influence calcified plaque formation; thus, variants in the bone formation/remodeling pathway could accelerate calcification of atherosclerotic
BMP7 IN BONE AND CARDIOVASCULAR DISEASE plaques and impair maintenance of BMD (i.e., osteoporosis).(10) For example, defective BMP7 could inversely influence bone and vascular calcium accumulation through impaired phosphate deposition in the skeleton, leading to subclinically elevated circulating phosphate concentrations that would enhance vascular calcification.(22) We previously reported the independent heritability of BMD and calcified atherosclerotic plaque(8) in Diabetes Heart Study families. A number of pathways involving mineralization activators and inhibitors could also link osteoporosis and atherosclerosis. Fetuin-A (ASHG), matrix GLA protein (MGP), and pyrophosphate (produced by PNPP1 and destroyed by alkaline phosphatase) are inhibitors of vascular calcification also involved in skeletal mineralization.(35) It is possible that polymorphisms in mineralization inhibitor– associated genes, in addition to BMP7 and others, account for a portion of the risk of co-existing atherosclerosis and osteoporosis.(36) A biologic relationship between VC and BMD is further supported by marked ethnic variation in the prevalence of osteoporosis(37) and calcified atherosclerotic plaque.(15,38–40) European Americans, who on average ingest more dietary calcium than blacks, manifest decreased BMD, enhanced skeletal sensitivity to the effect of PTH, and significantly higher levels of calcified coronary artery plaque. The pathologic condition of atherosclerotic calcified plaque is less prevalent in black men and women. When provided equal access to medical care, blacks have a significantly reduced risk of bone fractures(41) and myocardial infarction,(42–44) relative to European Americans. Coronary artery VC measured by cardiac CT has been shown to add significantly to traditional risk factors in the prediction of near-term coronary artery disease events, CVD events, and all-cause mortality in adults of all ethnic backgrounds.(33) The consistent and significant relationships between multiple SNPs in the BMP7 gene with an inverse relationship between the principal components of BMD and VC in European Americans in the DHS support previous work suggesting that BMP7 influences pathways involved in both skeletal and vascular mineralization. Defective BMP7 functionality could simultaneously lead to reduced osteoblastic and vascular smooth muscle cell differentiation consistent with reduced BMD and increased VC, and/ or reduced osteoblast function, impaired mineralization, and increased availability of mineral ions for calcium phosphate precipitation in vascular sites. Additional studies to replicate these analyses in other diabetic, nondiabetic, and minority populations will be important in further establishing the link of BMP7 with the interrelationships between vascular and bone calcification.
ACKNOWLEDGMENTS The investigators acknowledge the cooperation of our participants; Project Manager Carrie Smith; imaging analysts Lining Du, Caresse Hightower, and Susan Pillsbury; technical support Chris O’Rourke, Bob Ellison, Ricardo Peral, and Karen Holbrook; and CT technologists. This study was supported by NIAMS and NHLBI Grants
1725 R01 AR048797 (J.J.C.), R01 HL67348 (D.W.B.), RO1 DK071891 (B.I.F.), and the General Clinical Research Center of the Wake Forest University School of Medicine Grant M01 RR07122. Software and technical support was provided by Image Analysis, Columbia, KY, USA, and GE Healthcare, Waukesha, WI, USA.
REFERENCES 1. Anderson JB, Barnett E, Nordin BE 1964 The relation between osteoporosis and aortic calcification. Br J Radiol 37:910–912. 2. Silverman SL, Delmas PD, Kulkarni PM, Stock JL, Wong M, Plouffe L Jr 2004 Comparison of fracture, cardiovascular event, and breast cancer rates at 3 years in postmenopausal women with osteoporosis. J Am Geriatr Soc 52:1543–1548. 3. Tanko LB, Christiansen C, Cox DA, Geiger MJ, McNabb MA, Cummings SR 2005 Relationship between osteoporosis and cardiovascular disease in postmenopausal women. J Bone Miner Res 20:1912–1920. 4. Browner WS, Pressman AR, Nevitt MC, Cauley JA, Cummings SR 1993 Association between low bone density and stroke in elderly women. The study of osteoporotic fractures. Stroke 24:940–946. 5. Kiel DP, Kauppila LI, Cupples LA, Hannan MT, O’Donnell CJ, Wilson PW 2001 Bone loss and the progression of abdominal aortic calcification over a 25 year period: The Framingham Heart Study. Calcif Tissue Int 68:271–276. 6. Schulz E, Arfai K, Liu X, Sayre J, Gilsanz V 2004 Aortic calcification and the risk of osteoporosis and fractures. J Clin Endocrinol Metab 89:4246–4253. 7. Barreto DV, de Carvalho BF, de Carvalho AB, Cuppari L, Draibe SA, Dalboni MA, Moyses RM, Neves KR, Jorgetti V, Miname M, Santos RD, Canziani ME 2008 Association of changes in bone remodeling and coronary calcification in hemodialysis patients: A prospective study. Am J Kidney Dis 52:1139–1150. 8. Carr JJ, Register TC, Hsu FC, Lohman K, Lenchik L, Bowden DW, Langefeld CD, Xu J, Rich SS, Wagenknecht LE, Freedman BI 2008 Calcified atherosclerotic plaque and bone mineral density in type 2 diabetes: The diabetes heart study. Bone 42:43–52. 9. Register TC, Lenchik L, Hsu FC, Lohman KK, Freedman BI, Bowden DW, Carr JJ 2006 Type 2 diabetes is not independently associated with spinal trabecular volumetric bone mineral density measured by QCT in the Diabetes Heart Study. Bone 39:628–633. 10. Doherty TM, Fitzpatrick LA, Inoue D, Qiao JH, Fishbein MC, Detrano RC, Shah PK, Rajavashisth TB 2004 Molecular, endocrine, and genetic mechanisms of arterial calcification. Endocr Rev 25:629–672. 11. Stary HC 2000 Lipid and macrophage accumulations in arteries of children and the development of atherosclerosis. Am J Clin Nutr 72:1297S–1306S. 12. Stary HC 2001 The development of calcium deposits in atherosclerotic lesions and their persistence after lipid regression. Am J Cardiol 88:16E–19E. 13. Stary HC, Chandler AB, Dinsmore RE, Fuster V, Glagov S, Insull W Jr, Rosenfeld ME, Schwartz CJ, Wagner WD, Wissler RW 1995 A definition of advanced types of atherosclerotic lesions and a histological classification of atherosclerosis. A report from the Committee on Vascular Lesions of the Council on Arteriosclerosis, American Heart Association. Circulation 92:1355–1374. 14. Carr JJ, Nelson JC, Wong ND, Nitt-Gray M, Arad Y, Jacobs DR Jr, Sidney S, Bild DE, Williams OD, Detrano RC 2005 Calcified coronary artery plaque measurement with cardiac CT in population-based studies: Standardized protocol of Multi-Ethnic Study of Atherosclerosis (MESA) and Coronary Artery Risk Development in Young Adults (CARDIA) study. Radiology 234:35–43.
1726 15. Freedman BI, Hsu FC, Langefeld CD, Rich SS, Herrington D, Carr JJ, Xu J, Bowden DW, Wagenknecht LE 2005 The impact of ethnicity and gender on subclinical cardiovascular disease: The Diabetes Heart Study. Diabetologia 48:2511– 2518. 16. Frazer KA, Ballinger DG, Cox DR, Hinds DA, Stuve LL, Gibbs RA, Belmont JW, Boudreau A, Hardenbol P, Leal SM, Pasternak S, Wheeler DA, Willis TD, Yu F, Yang H, Zeng C, Gao Y, Hu H, Hu W, Li C, Lin W, Liu S, Pan H, Tang X, Wang J, Wang W, Yu J, Zhang B, Zhang Q, Zhao H, Zhou J, Gabriel SB, Barry R, Blumenstiel B, Camargo A, DeFelice M, Faggart M, Goyette M, Gupta S, Moore J, Nguyen H, Onofrio RC, Parkin M, Roy J, Stahl E, Winchester E, Ziaugra L, Altshuler D, Shen Y, Yao Z, Huang W, Chu X, He Y, Jin L, Liu Y, Shen Y, Sun W, Wang H, Wang Y, Wang Y, Xiong X, Xu L, Waye MM, Tsui SK, Xue H, Wong JT, Galver LM, Fan JB, Gunderson K, Murray SS, Oliphant AR, Chee MS, Montpetit A, Chagnon F, Ferretti V, Leboeuf M, Olivier JF, Phillips MS, Roumy S, Sallee C, Verner A, Hudson TJ, Kwok PY, Cai D, Koboldt DC, Miller RD, Pawlikowska L, Taillon-Miller P, Xiao M, Tsui LC, Mak W, Song YQ, Tam PK, Nakamura Y, Kawaguchi T, Kitamoto T, Morizono T, Nagashima A, Ohnishi Y, Sekine A, Tanaka T, Tsunoda T, Deloukas P, Bird CP, Delgado M, Dermitzakis ET, Gwilliam R, Hunt S, Morrison J, Powell D, Stranger BE, Whittaker P, Bentley DR, Daly MJ, de Bakker PI, Barrett J, Chretien YR, Maller J, McCarroll S, Patterson N, Pe’er I, Price A, Purcell S, Richter DJ, Sabeti P, Saxena R, Schaffner SF, Sham PC, Varilly P, Altshuler D, Stein LD, Krishnan L, Smith AV, Tello-Ruiz MK, Thorisson GA, Chakravarti A, Chen PE, Cutler DJ, Kashuk CS, Lin S, Abecasis GR, Guan W, Li Y, Munro HM, Qin ZS, Thomas DJ, McVean G, Auton A, Bottolo L, Cardin N, Eyheramendy S, Freeman C, Marchini J, Myers S, Spencer C, Stephens M, Donnelly P, Cardon LR, Clarke G, Evans DM, Morris AP, Weir BS, Tsunoda T, Mullikin JC, Sherry ST, Feolo M, Skol A, Zhang H, Zeng C, Zhao H, Matsuda I, Fukushima Y, Macer DR, Suda E, Rotimi CN, Adebamowo CA, Ajayi I, Aniagwu T, Marshall PA, Nkwodimmah C, Royal CD, Leppert MF, Dixon M, Peiffer A, Qiu R, Kent A, Kato K, Niikawa N, Adewole IF, Knoppers BM, Foster MW, Clayton EW, Watkin J, Gibbs RA, Belmont JW, Muzny D, Nazareth L, Sodergren E, Weinstock GM, Wheeler DA, Yakub I, Gabriel SB, Onofrio RC, Richter DJ, Ziaugra L, Birren BW, Daly MJ, Altshuler D, Wilson RK, Fulton LL, Rogers J, Burton J, Carter NP, Clee CM, Griffiths M, Jones MC, McLay K, Plumb RW, Ross MT, Sims SK, Willey DL, Chen Z, Han H, Kang L, Godbout M, Wallenburg JC, L’Archeveque P, Bellemare G, Saeki K, Wang H, An D, Fu H, Li Q, Wang Z, Wang R, Holden AL, Brooks LD, McEwen JE, Guyer MS, Wang VO, Peterson JL, Shi M, Spiegel J, Sung LM, Zacharia LF, Collins FS, Kennedy K, Jamieson R, Stewart J 2007 A second generation human haplotype map of over 3.1 million SNPs. Nature 449:851–861. 17. de Bakker PI, Yelensky R, Pe’er I, Gabriel SB, Daly MJ, Altshuler D 2005 Efficiency and power in genetic association studies. Nat Genet 37:1217–1223. 18. Barrett JC, Fry B, Maller J, Daly MJ 2005 Haploview: Analysis and visualization of LD and haplotype maps. Bioinformatics 21:263–265. 19. O’Connell JR, Weeks DE 1998 PedCheck: A program for identification of genotype incompatibilities in linkage analysis. Am J Hum Genet 63:259–266. 20. Almasy L, Blangero J 1998 Multipoint quantitative-trait linkage analysis in general pedigrees. Am J Hum Genet 62:1198–1211. 21. Gabriel SB, Schaffner SF, Nguyen H, Moore JM, Roy J, Blumenstiel B, Higgins J, DeFelice M, Lochner A, Faggart M, Liu-Cordero SN, Rotimi C, Adeyemo A, Cooper R, Ward R, Lander ES, Daly MJ, Altshuler D 2002 The structure of haplotype blocks in the human genome. Science 296:2225– 2229. 22. Mathew S, Tustison KS, Sugatani T, Chaudhary LR, Rifas L, Hruska KA 2008 The mechanism of phosphorus as a car-
FREEDMAN ET AL.
23. 24.
25.
26.
27.
28.
29.
30.
31. 32.
33.
34. 35. 36.
37.
38.
diovascular risk factor in CKD. J Am Soc Nephrol 19:1092– 1105. Shao JS, Cai J, Towler DA 2006 Molecular mechanisms of vascular calcification: Lessons learned from the aorta. Arterioscler Thromb Vasc Biol 26:1423–1430. Davies MR, Lund RJ, Mathew S, Hruska KA 2005 Low turnover osteodystrophy and vascular calcification are amenable to skeletal anabolism in an animal model of chronic kidney disease and the metabolic syndrome. J Am Soc Nephrol 16:917–928. Dorai H, Vukicevic S, Sampath TK 2000 Bone morphogenetic protein-7 (osteogenic protein-1) inhibits smooth muscle cell proliferation and stimulates the expression of markers that are characteristic of SMC phenotype in vitro. J Cell Physiol 184:37–45. Piscione TD, Yager TD, Gupta IR, Grinfeld B, Pei Y, Attisano L, Wrana JL, Rosenblum ND 1997 BMP-2 and OP-1 exert direct and opposite effects on renal branching morphogenesis. Am J Physiol 273:F961–F975. Yu PB, Beppu H, Kawai N, Li E, Bloch KD 2005 Bone morphogenetic protein (BMP) type II receptor deletion reveals BMP ligand-specific gain of signaling in pulmonary artery smooth muscle cells. J Biol Chem 280:24443– 24450. Yu PB, Deng DY, Beppu H, Hong CC, Lai C, Hoyng SA, Kawai N, Bloch KD 2008 Bone morphogenetic protein (BMP) type II receptor is required for BMP-mediated growth arrest and differentiation in pulmonary artery smooth muscle cells. J Biol Chem 283:3877–3888. Pertosa G, Dalfino G, Porreca S, Cicconi B, Zaza G, Simore S, Pietanza S, Schena FP, Grandaliano G 2007 Low coagulationactivating dialyzer reduces progression of atherosclerosis in hemodialysis (HD) modulating serum bone morphogenetic protein (BMPS). J Am Soc Nephrol 18:274A. Budoff MJ, Achenbach S, Blumenthal RS, Carr JJ, Goldin JG, Greenland P, Guerci AD, Lima JA, Rader DJ, Rubin GD, Shaw LJ, Wiegers SE 2006 Assessment of coronary artery disease by cardiac computed tomography: A scientific statement from the American Heart Association Committee on Cardiovascular Imaging and Intervention, Council on Cardiovascular Radiology and Intervention, and Committee on Cardiac Imaging, Council on Clinical Cardiology. Circulation 114:1761–1791. Atkinson J 2008 Age-related medial elastocalcinosis in arteries: Mechanisms, animal models, and physiological consequences. J Appl Physiol 105:1643–1651. Becker A, Leber AW, Becker C, von Ziegler F, Tittus J, Schroeder I, Steinbeck G, Knez A 2008 Predictive value of coronary calcifications for future cardiac events in asymptomatic patients with diabetes mellitus: A prospective study in 716 patients over 8 years. BMC Cardiovasc Disord 8: 27. Detrano R, Guerci AD, Carr JJ, Bild DE, Burke G, Folsom AR, Liu K, Shea S, Szklo M, Bluemke DA, O’Leary DH, Tracy R, Watson K, Wong ND, Kronmal RA 2008 Coronary calcium as a predictor of coronary events in four racial or ethnic groups. N Engl J Med 358:1336–1345. Hruska KA, Mathew S, Saab G 2005 Bone morphogenetic proteins in vascular calcification. Circ Res 97:105– 114. Johnson RC, Leopold JA, Loscalzo J 2006 Vascular calcification: Pathobiological mechanisms and clinical implications. Circ Res 99:1044–1059. Taylor BC, Schreiner PJ, Doherty TM, Fornage M, Carr JJ, Sidney S 2005 Matrix Gla protein and osteopontin genetic associations with coronary artery calcification and bone density: The CARDIA study. Hum Genet 116:525–528. Luckey MM, Wallenstein S, Lapinski R, Meier DE 1996 A prospective study of bone loss in African-American and white women–a clinical research center study. J Clin Endocrinol Metab 81:2948–2956. Bild DE, Detrano R, Peterson D, Guerci A, Liu K, Shahar E, Ouyang P, Jackson S, Saad MF 2005 Ethnic differences in
BMP7 IN BONE AND CARDIOVASCULAR DISEASE coronary calcification: The Multi-Ethnic Study of Atherosclerosis (MESA). Circulation 111:1313–1320. 39. Carnethon MR, Bertoni AG, Shea S, Greenland P, Ni H, Jacobs DR Jr, Saad M, Liu K 2005 Racial/ethnic differences in subclinical atherosclerosis among adults with diabetes: The Multiethnic Study of Atherosclerosis. Diabetes Care 28: 2768–2770. 40. Budoff MJ, Nasir K, Mao S, Tseng PH, Chau A, Liu ST, Flores F, Blumenthal RS 2006 Ethnic differences of the presence and severity of coronary atherosclerosis. Atherosclerosis 187:343–350. 41. Acheson LS 2005 Bone density and the risk of fractures: Should treatment thresholds vary by race? JAMA 293:2151– 2154.
1727 42. Young BA, Rudser K, Kestenbaum B, Seliger SL, Andress D, Boyko EJ 2006 Racial and ethic differences in incident myocardial infarction in end-stage renal disease patients: The USRDS. Kidney Int 69:1691–1698. 43. Young BA, Maynard C, Boyko EJ 2003 Racial differences in diabetic nephropathy, cardiovascular disease, and mortality in a national population of veterans. Diabetes Care 26:2392–2399. 44. Karter AJ, Ferrara A, Liu JY, Moffet HH, Ackerson LM, Selby JV 2002 Ethnic disparities in diabetic complications in an insured population. JAMA 287:2519–2527. Received in original form November 3, 2008; revised form January 30, 2009; accepted May 1, 2009.