34th Annual International Conference of the IEEE EMBS San Diego, California USA, 28 August - 1 September, 2012
Body Surface Area Measurement and Soft Clustering for PASI Area Assessment Ahmad Fadzil M Hani, Senior Member, IEEE, Esa Prakasa, Hermawan Nugroho, Azura M Affandi, Suraiya H Hussein
Abstract² Psoriasis is a common skin disorder with a prevalence of 0.6 ± 4.8% around the world. The most common is plaques psoriasis and it appears as red scaling plaques. Psoriasis is incurable but treatable in a long term treatment. Although PASI (Psoriasis Area and Severity Index) scoring is recognised as gold standard for psoriasis assessment, this method is still influenced by inter and intra-rater variation. An LPDJLQJ DQG DQDO\VLV V\VWHP FDOOHG .-PASI is developed to perform PASI scoring objectively. Percentage of lesion area to the body surface area is one of PASI parameter. In this paper, enhanced imaging methods are developed to improve the determination of body surface area (BSA) and lesion area. BSA determination method has been validated on medical mannequin. BSA accuracies obtained at four body regions are 97.80% (lower limb), 92.41% (trunk), 87.72% (upper limb), and 83.82% (head). By applying fuzzy c-means clustering algorithm, the membership functions of lesions area for PASI area scoring have been determined. Performance of scoring result has been testHG ZLWK GRXEOH DVVHVVPHQW E\ .-PASI area algorithm on body region images from 46 patients. Kappa FRHIILFLHQWV IRU .-PASI system are greater than or equal to 0.72 for all body regions (Head - 0.76, Upper limb - 0.81, Trunk 0.85, Lower limb - 0.72). The overall kappa coefficient for the .-PASI area is 0.80 that can be categorised as substantial DJUHHPHQW 7KLV VKRZV WKDW WKH .-PASI area system has a high reliability and can be used in psoriasis area assessment. Keywords ² psoriasis, body surface area, lesion area assessment, fuzzy c-means clustering
I. INTRODUCTION Psoriasis is one of the most common skin disorders. The disease appears as red scaling plaques that can spread in any body part [1]. In psoriasis, the immune system sends incorrect signals that speed up the growth of new skin cells. Psoriasis affects approximately 0.6 - 4.8% of the world population [2]. The Dermatological Society of Malaysia estimated psoriasis prevalence in Malaysia to be 3% [3]. Since the disease cannot be totally cured, psoriasis patient needs a long term treatment. The PASI (Psoriasis Area and Severity Index) scoring method is the gold standard for the severity assessment and *This research is supported by Ministry of Science, Technology, and Innovation, Malaysia under the TechnoFund Grant TF 0308C041. Ahmad Fadzil M Hani, Esa Prakasa, and Hermawan Nugroho are with the Centre for Intelligent Signal and Imaging Research, Universiti Teknologi PETRONAS, Malaysia (E-mail:
[email protected]). Azura Mohd Affandi is with the Department of Dermatology, Hospital Kuala Lumpur, Malaysia. Suraiya H Hussein was with the Department of Dermatology, Hospital Kuala Lumpur, Malaysia. She is now with KPJ Damansara Specialist Hospital, Kuala Lumpur, Malaysia.
978-1-4577-1787-1/12/$26.00 ©2012 IEEE
determining treatment efficacy [4]. Four parameters, i.e. area (ratio of lesion area to total body surface area), erythema, scaliness, and thickness are examined to determine PASI score. The parameter scores from each body region (head, trunk, upper limbs and lower limbs) are weighted and totalled to provide a PASI score ranging from 0 ± 72. Dermatologists consider at least 75% reduction in PASI score for the treatment efficacy to be a clinically meaningful improvement [4]. Although the PASI scoring has been accepted as the gold standard, it is not used in daily practice. PASI scoring of all parameters are tedious, time consuming and subjective. Inter and intra-rater variation on scoring results can be occurred due to the subjectivity of dermatologists. For PASI area assessment, dermatologists usually observe the lesion area at four body regions. The scores, ranging from 0-6, are given based on the percentage of lesion area to total body surface area (BSA). $Q LPDJLQJ DQG DQDO\VLV V\VWHP FDOOHG .-PASI has been developed to perform PASI assessment and scoring objectively [5] [6]. These previous studies successfully measured the percentage the lesion area from 2D images of body regions. However the body surface areas are measured from front and back views only. Therefore, side parts of body regions are not covered in the surface area measurement. The PASI area scores are determined by classifying the lesion area to fixed intervals of PASI area scores. The intervals are same for all body regions. Multiview 2D imaging has been applied to acquire the body surface area as reported in [7]. The system with multi-view imaging achieved reasonable good performance for the area measurement. However, it suffers scale variation on upper limb regions and overvaluation for the surface area of head region. In this paper, the body surface coverage and PASI area VFRULQJ PHWKRGV RI WKH .-PASI have been improved to minimise uncounted surface area, miscalculation on overlapping area, and scale variation on the same view images. Elliptical shape is considered to approximate cross section of body regions to increase area measurement accuracy. For this work, fuzzy c-means clustering (FCM) is applied to classify PASI area scores. The FCM algorithm classifies the lesion area by comparing membership degrees of the scores' membership functions. The functions are fitted from the clustering results of the lesion area dataset. Thus, the PASI area classifier has been fully developed from the actual area measurement and can be adapted at different body regions.
4398
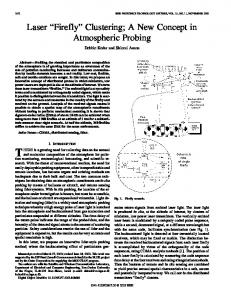
II. APPROACH 2.1 Validation of Body Surface Area Determination To determine PASI area score for a body region, the lesion area is divided by the body surface area (BSA). BSA calculations based on body weight and height estimation, such as Du Bois & Du Bois and Mosteller equations, are widely used to estimate BSA. Lund and Browder chart, which allocates fixed percentages to body regions, can be applied to determine BSA of body regions. 3D imaging has been developed to improve accuracy but the image acquisition requires specialised equipments [8]. In this work, the multi-view imaging method is applied to perform BSA measurement. The patient is photographed from four GLIIHUHQW SRVHV WR HQVXUH WKH SDWLHQW¶V %6$ LV FRPSOHWHO\ acquired [7]. The body is imaged from front, right, left and back viewpoints. The overlapped areas from the sequence of images are discarded in BSA measurement. To find the proportion of overlapped area, a cylindrical object with elliptical cross-section is used to model human body part [9]. This ellipse shape can approximate cross-sectional shape of human body region. The proportion of overlapping area is determined from the edges of the object. Calculation for the non-overlapping areas of front and right views are shown in Figure 1. The proportions of overlapping area at horizontal (dx/a) and vertical (dy/b) axes are applied separately for each axis.
by line. The proportion of overlapping area is applied to obtain a correct measurement. Equations 1 and 2 are used to determine proportions of overlapping area at horizontal and vertical axes. dx a
1 2
x a
(1)
dy b
1 2
y b
(2)
2.2 Validation of Overlapping Areas Validation of overlapping areas is performed by using a cylindrical object having elliptical cross-section. The object is wrapped with plaster material of 9,509 mm2. The object surface is imaged from front, right, left and back views. The BSA of plaster material is calculated using all image views. The overlapping areas are discounted in the BSA calculation. The boundary angle LV VHW HTXDOV Û WR JLYH WKH highest accuracy in BSA measurement. With this angle, the overlapping proportions at horizontal (dx/a) and vertical (dy/b) axes are minimal at 5.28% and 27.64%, respectively. The overlapping proportions are multiplied by two at two sides of each view. By using the known reference, the accuracy of BSA algorithm is determined. Let ABSA be defined as the total of BSA minus overlapping area (8,989.92 mm2) and AR (9,509.00 mm2) is the reference area. The accuracy of BSA algorithm is found to be 94.54%. The error is created from the scale variation curve surface of the cylindrical object. The accuracy proves that the photograph process and BSA algorithm area able to image the actual BSA of a cylindrical object. 2.3 Validation on Medical Mannequin Validation of D-PASI algorithm for BSA measurement is performed by using a medical mannequin. Manual wrapping method is conducted to obtain reference BSA for validating D-PASI algorithm. To determine BSA of human body using D-PASI algorithm, four images are acquired from four different views. The body regions from these images are segmented into 23 images. Head region taken from back view is not included since there is no skin for this area. The BSA measurements of body regions are therefore determined separately. The determination results are listed in Table I.
Figure 1. Overlapping and non-overlapping areas of front and right views
The overlapping proportion depends on the ellipse size that is indicated by a and b. The boundary angle angle is assigned to minimise scale variations on area. The scale variation will be less if the measured surface is more flat and parallel with the camera lens, as shown by horizontal part of the ellipse. The percentage of overlapping areas for the front and back views is proportional to the boundary angle. If the angle increases, the overlapping areas of front and back views will increase. This means a larger area with lesser scale variations will be discounted in BSA measurement. If the angle decreases, the overlapping areas of right and left views will increase. The total surface is calculated by accumulating non-overlapping areas from four different views. In every single view image, the surface area is calculated by accumulating non-overlapping surface area line
TABLE I. ACCURACY CALCULATION OF CYLINDRICAL OBJECT Manual (mm2)
.-PASI (mm2)
Accuracy
Lower Limb
485,112.93
474,463.22
97.80%
Trunk
498,960.00
461,065.72
92.41%
Upper Limb
252,080.07
221,113.09
87.72%
25,181.14
30,042.00
83.82%
Body Region
Head
The algorithm for measuring BSA achieved good accuracies (>90%) for lower limb and trunk regions. This is due to the following reasons: a) The ellipse cross-section model is a good approximation of the cross-sections of trunk and lower limb.
4399
b) For both body regions, a large proportion of the body surfaces are flat. Flat surface reduces any scale variation in the imaged area. The BSA values tend to be smaller than the actual because a fixed percentage of overlapped area is applied to all body parts. The accuracy of head region has been improved from 66.63% to 83.82% [7] by segmenting the head into three regions from three different views. Labial commisure of mouth and lateral commisure of eyelid are used as the references to segment the face area. In the previous work [7], the accuracy for upper limb is relatively lower due to scale area variation. The reference scales are not located at the same distances from the camera lens. To improve the accuracy for upper limb region, the upper limb located farther from camera is rescaled to the upper limb nearer to the camera. From the reference tapes at both upper limbs, it is known that the ratio between these two is 1.19. By using this ratio for the rescaling, the accuracy of upper limb region is improved from 85.22% to 87.72% [7]. III. RESULT AND ANALYSIS 3.1 /HVLRQ 6HJPHQWDWLRQ LQ WKH .-PASI Area Algorithm The lesion segmentation accuracy using PASI area algorithm is investigated. Accuracy of lesion segmentation is determined by comparing lesion coverage obtained from PDQXDO VHJPHQWDWLRQ DQG .-PASI area algorLWKP 7KH .PASI applies lesion segmentation method that has been developed in [5]. Manual segmentation is performed manually by using Adobe Photoshop. Results of the manual segmentation are then considered as a reference. This reference is used to evaOXDWH WKH VHJPHQWDWLRQ UHVXOW E\ .PASI. 37 lesion samples (varying from fair, light brown, brown, and dark skin tones) are used in the investigation. After performing outlier analysis, 5 samples are considered as outliers and not included in the analysis. Figure 2 plots WKH VHJPHQWDWLRQ UHVXOW RI WKH .-PASI area algorithm against the segmentation result of the manual segmentation. It is VKRZQ WKDW DOO RI WKH .-PASI lesion segmentation results are near the reference line (Y=X line). Moreover the plot can be modelled by a liner regression model with a very high R2 (R2=0.996) and the fitting line is closely located with the reference line. This indicates that the .-PASI lesion segmentation algorithm is accurate and precise.
3.2 Lesion Area Classification for PASI Area Scoring ,Q WKLV ZRUN WKH .-PASI area algorithm is applied to SDWLHQWV¶ ERG\ LPDJHV REWDLQHG IURP UHJLVWHUHG SVRULDVLV patients of Dermatology Department, Hospital Kuala Lumpur. Lesion areas collected from 158 patients are used to build FCM classifier and the areas of 46 patients are considered as testing data. The lesion area is classified by applying FCM clustering algorithm [10]. FCM is a soft-classifier that allows a data point to belong to more than one cluster. With this characteristic, FCM can solve clustering problems at cluster boundaries. Lesion areas obtained from 158 patients are then applied to the FCM algorithm. The algorithm is applied separately for each body regions. Membership functions of PASI area scores are constructed from the clustering results. Gaussian curve fitting is used to construct membership functions of PASI area scores. Figure 3 shows membership functions for PASI area scoring at trunk region. Six membership functions are determined to represent six severity grades of PASI area scores. A certain lesion area, that is represented by line x=AL, can intersect with more than one membership function. The score for this area is determined by membership function that can give the highest membership degree. If the area lies in two membership functions with same degrees, the area will be assigned to the higher score. For the example, let x=30%, it will intersect two membership functions which are functions of score 3 and 4. The membership degrees of lesion area 30% are determined to be 0.20 and 0.64 for score 3 and 4, respectively. Since membership degree of score 4 is higher than score 3, it can be decided that the PASI area score for lesion area 30% is 4. Lesion areas from 46 patients are scored by developed FCM classifier. The PASI area scores acquired from two successive acquisitions are utilised to evaluate measurement objectivities. The area differences between the first and second assessments have to be less than one standard deviation (V) of area differences.
Figure 3. Six membership functions of PASI area scores for trunk region. A membership function is used to determine membership degree of PASI area score at a particular percentage of lesion area Figure 2. 3ORW RI .-PASI segmentation against manual segmentation
4400
ACKNOWLEDGMENT
3.3 Evaluation on PASI Area Agreement To evaluate measurement objectivity, agreement between two dermatologists and two successive acquisitions are determined. Kappa coefficient is used to evaluate the agreement performance. The kappa coefficients for the body regions are described in Table II.
The research is a collaborative work between the Centre for Intelligent Signal and Imaging Research (CISIR) UTP and Department of Dermatology, Hospital Kuala Lumpur. This work is funded under the Techno Fund Grant TF 0308C041.
TABLE II. KAPPA COEFFICIENTS FOR BODY REGIONS
REFERENCES
No
Body Region
Dermatologist 1 vs. Dermatologist 2
.-3$6, YV .PASI 2
N (region)
Kappa
Test Data
Kappa
1
Head
23
0.49
11
0.76
2
Upper Limb
200
0.81
30
0.81
3
Trunk
198
0.83
28
0.85
4
Lower Limb
38
0.93
33
0.72
Total
459
0.82
102
0.80
[1]
.DSSD FRHIILFLHQWV RI WKH .-PASI are equal to the dermatologists for upper limb region. The .-PASI coefficients are higher than dermatologist assessments for head and trunk region except for lower limb (0.72). In lower limb, dermatologists have a very high agreement (0.93). This may be due to a small sample size in comparison with XSSHU OLPE DQG WUXQN ,Q .-PASI system, there are 6 disagreements from the 33 measurements at lower limb region. Four of these disagreement cases have difference less than 4 percent for the double assessment reflecting the system sensitiveness. Overall, high Kappa coefficients (0.80) indicate that the .-PASI area system has a high reliability and can be used in monitoring psoriasis area. IV. CONCLUSION The multi-view imaging method presented in [7] has been improved to account for the scale variation problems on upper limb regions and overestimation for the head region. The result of the BSA determinatioQ E\ WKH QHZ .-PASI method is validated on a medical mannequin. BSA accuracies at four body regions are 97.80% (lower limb), 92.41% (trunk), 87.72% (upper limb), and 83.82% (head). By applying fuzzy c-means clustering algorithm, the membership functions of lesions area for PASI area scoring have been determined. .DSSD FRHIILFLHQWV IRU .-PASI system are not less than 0.72 for all body regions (Head - 0.76, Upper limb - 0.81, Trunk - 0.85, Lower limb - 0.72). In comparison with assessments by dermatologists WKH .-PASI system has higher kappa coefficient for head and trunk regions assessment. The kappa coefficients are found to be same for upper limb region. A lower kappa coefficient on lower limb is caused by the sensitivity of the system. Overall the kappa FRHIILFLHQW RI .-PASI system is 0.80 that is categorised as VXEVWDQWLDO DJUHHPHQW 7KLV UHVXOW LQGLFDWHV WKDW WKH .-PASI system has a high reliability and can be used in psoriasis area assessment.
A. Menter, N.J., Elmets, C.A., Feldman, S.R., Lebwohl, M., Lim, H.W., Van Voorhees, A.S., Beutner, K.R., Reva Bhushan, P.D.,, ³*XLGHOLQHV RI FDUH IRU WKH PDQDJHPHQW RI SVRULDVLV DQG SVRULDWLF DUWKULWLV ´ Journal of American Dermatology, vol. 60, no. 1, pp. 451485, 2009. [2] A. L. Neimann, S. B. Porter DQG - 0 *HOIDQG ³7KH HSLGHPLRORJ\ RI SVRULDVLV ´ Expert Review of Dermatology, vol. 1, no. 1, pp. 63-76, 2006. [3] ³2YHUYLHZ RI 3VRULDVLV LQ 0DOD\VLD ´ YRO QR )HEUXDU\ 2011. Persatuan Dermatologi Malaysia., 2011. [4] S. R. Feldman and G. G. .UXHJHU ³3VRULDVLV DVVHVVPHQW WRROV LQ FOLQLFDO WULDOV ´ Annals of the rheumatic diseases, vol. 64, pp. 65-68, 2005. [5] 0 + $ )DG]LO ' ,KWDWKR $ 0 $IIDQGL DQG 6 + +XVVHLQ ³$UHD DVVHVVPHQW RI SVRULDVLV OHVLRQV IRU 3$6, VFRULQJ ´ Journal of medical engineering technology, vol. 2007, no. 6, pp. 3446-3449, 2007. [6] D. Ihtatho, M. H. Ahmad Fadzil, A. M. Affandi, and H. H. Suraiya, ³$UHD $VVHVVPHQW RI 3VRULDVLV /HVLRQ IRU 3$6, 6FRULQJ ´ IEEE engineering in medicine and biology magazine: the quarterly magazine of the Eng. in Medicine and Biology Society., vol. 1, p. 3446, 2007. [7] A. Fadzil MH., Prakasa, E., Asirvadam, V. S., Nugroho, H., Chong, C. H., Affandi, A. M., & Hussein, S. H., ³'HYHORSPHQW RI %RG\ Surface Area Measurement using Multi-View Imaging for Psoriasis $UHD $VVHVVPHQW ´ Journal of Australasian Physical & Engineering Science in Medicine, vol. 34, no. 4, p. 591, 2011. [8] 3 7UHOHDYHQ DQG - :HOOV ³ ' %RG\ 6FDQQLQJ DQG +HDOWKFDUH $SSOLFDWLRQV ´ Computer, vol. 40, no. 7, pp. 28-34, Jul. 2007. [9] - :DQJ DQG ( +LKDUD ³+XPDQ ERG\ VXUIDFH DUHD D WKHRUHWLFDO DSSURDFK ´ European journal of applied physiology, vol. 91, no. 4, pp. 425-8, Apr. 2004. [10] 5 ;X DQG ' & :XQVFK ³&OXVWHULQJ $OJRULWKPV LQ %LRPHGLFDO Research $ 5HYLHZ ´ IEEE Reviews in Biomedical Engineering, vol. 3, pp. 120-154, 2010.
4401