dialogue (see Section 2.6.1). (3.1) System: ''Hello, how may I help you?'' User: ''I want a Radiohead song''. System: ''Ok, a Radiohead song. From what album?
Bootstrapping Reinforcement Learning-based Dialogue Strategies from Wizard-of-Oz data
vorlegt von
IV
S
IS
S
SA
R
E R SIT A
UN
Verena Rieser
A VIE N
Dissertation zur Erlangung des akademischen Grades eines Doktors der Philosophie der Philosophischen Fakultäten der Universität des Saarlandes Saarbrücken, 2008
Meinen Omas Katharina Rieser und Maria-Theresia Hohmann.
Dekan(in):
Prof. Dr. Susanne Kleinert
Berichterstatter(innen):
Prof. Dr. Manfred Pinkal Dr. Oliver Lemon Dr. Olivier Pietquin
Tag der letzten Prüfungsleistung:
15 Juli 2008
ii
Abstract Designing a spoken dialogue system can be a time-consuming and challenging process. A developer may spend a lot of time and effort anticipating the potential needs of a specific application environment and then deciding on the most appropriate system response. These decisions are encoded in a dialogue strategy, which determines the system’s behaviour in a particular dialogue context. To facilitate strategy development, recent research investigates the use of Reinforcement Learning (RL) methods applied to automatic dialogue strategy optimisation. One of the key advantages of statistical optimisation methods, such as RL, for dialogue strategy design is that the problem can be formulated as a principled mathematical model which can be automatically optimised by training on real data. For new application domains where a system is designed from scratch, however, there is often no suitable in-domain data available. Collecting dialogue data without a working prototype is problematic, leaving the developer with a classic chickenand-egg problem. This thesis proposes to learn dialogue strategies by simulation-based RL using trial-and-error learning, where the simulated environment is learned from small amounts of Wizard-of-Oz (WOZ) data. Using WOZ data rather than data from real Human-Computer Interaction (HCI) allows us to learn optimal strategies for new application areas beyond the scope of existing dialogue systems. Optimised learned strategies are then available from the first moment of online-operation, and tedious handcrafting of dialogue strategies is fully omitted. We call this method ‘bootstrapping’. We apply this framework to optimise multimodal information-seeking dialogue strategies for an in-car MP3 music player. Dialogue Management and multimodal output generation are two closely interrelated problems for information seeking dialogues: the decision of when to present information depends on how many pieces of information to present and the available options for how to present them, and vice versa. We therefore formulate the problem as a hierarchy of joint learning decisions which are optimised together. We see this as a first step towards an integrated statistical model of Dialogue Management and output planning. In the bootstrapping framework the following steps are required. We first set up a data collection in a WOZ experiment, which already closely anticipates the final application. From this data we construct a simulated learning environment, where we introduce appropriate methods for learning from limited data sets. We then train and test a RL-based policy by simulated interaction. We compare the optimised policy against a supervised baseline. This comparison allows us to measure the relative improvements over the initial strategies in the training data. We also evaluate the policies by testing with real users. Our results show that the RL-based iii
policy significantly outperforms Supervised Learning. The RL-based policy gains on average 50% more reward in simulation, and 18% more reward when interacting with real users. Users also rate the RL policy on average 10% higher. Finally, we post-evaluate the framework by comparing different aspects of the three corpora gathered so far: the WOZ data, the dialogues generated from simulated interaction, and the user tests. We conclude that bootstrapping from WOZ data allows us to learn policies which are optimised for real user preferences.
iv
Zusammenfassung Ein natürlichsprachliches Dialogsystem zu entwickeln ist oft ein komplizierter und langwieriger Prozess. Ein Dialogentwickler investiert viel Zeit und Aufwand, um alle möglichen Anwendungsfälle vorauszusehen, und dann entsprechende Reaktionen für das System zu spezifizieren. Diese Entscheidungen werden dann zu einer Dialogstrategie zusammengefasst, die das Verhalten des Systems in einem bestimmten Dialogkontext festlegt. Um die Entwicklung solcher Strategien zu erleichtern, erprobt die aktuelle Forschung die Anwendung von Methoden des „Reinforcement Learning“ (RL) zur automatischen Entwicklung von Dialogstrategien. Ein entscheidender Vorteil statistischer Verfahren, wie zum Beispiel RL, ist, dass das Problem als ein mathematisch fundiertes Modell erfasst werden kann. Durch die Modellierung durch anwendungsnaher Daten kann dieses Modell automatisch optimiert werden. Für neue Anwendungsbiete allerdings muss ein System oft von Grund auf neu entworfen werden, und anwendungsnahe Daten sind schwer zu erhalten. Bei dem Problem, Daten ohne ein funktionierendes System zu sammeln, beißt sich die Katze in den Schwanz. Diese Arbeit verfolgt den Ansatz, Dialogstrategien mit Hilfe von simulationsbasiertem RL zu lernen, unter Anwendung von sogennanten „trial-and-error“ Lernenverfahren, d.h. Lernern durch Ausprobieren. Die simulierte Dialogumgebung wird dabei durch eine begrenzte Datenmenge modelliert, die durch ein „Wizard-of-Oz“ (WOZ) Experiment erfasst wurde. Der Gebrauch von WOZ-Daten, als Ersatz für Daten aus echter Mensch-Machine-Interaktion, ermöglicht es, optimale Strategien für vollkommen neue Anwendungsgebiete zu entwickeln, und so den Bereich der bestehenden Anwendung zu erweitern. Optimierte Strategien stehen so vom ersten Moment der Echtzeit-Interaktion zur Verfügung, und die langwierige manuelle Entwicklung von Dialogstrategien wird vollkommen umgangen. Wir nennen diese Methode „Bootstrapping“. Wir wenden die Methode auf multimodale Dialoge zur Informationsgewinnung an, die als Schnittstelle zu einem MP3 Audiogerät dienen. Die aktionsbasierte Dialoginteraktion und die Generierung von multimodalen Repräsentationen sind zwei engverwandte Themen bei der dialogbasierten Informationsgewinnung: Die Entscheidung, wann Information dargestellt werden soll, hängt von der Menge an Information ab, und ebenso von den zur Verfügung stehenden Präsentations Optionen, und umgekehrt. Wir formulieren daher das Problem als Hierarchie von aufeinanderfolgenden Entscheidungen, die gemeinsam optimiert werden. Wir betrachten dies als einen ersten Schritt auf dem Wege zu einem integrierten statistischen Model aus aktionsbasierter Dialogstragie und Systemausgabe. Die Methode des „Bootstrappens“ erfordert die folgenden Schritte: Als erstes werden Daten in einem WOZ-Experiment gesammelt. Dieses Experiment ist so konzipiert, dass die Be-
v
dingungen dem Anwendungsbereich bereits sehr nahe kommen. Diese Daten werden dann verwendet um eine simulierte Lernumgebung zu konstruieren. Dazu entwickeln wir angemessene Methoden zur statistischen Datenmodellierung mit kleinen Datenmengen. Danach wird die auf RL basierende Strategie durch simulierte Interaktion trainiert und getestet. Die so optimierte Strategie wird dann mit einer Strategy verglichen die durch „Supervised Learning“ (SL) gewonnen wurde. Dieser Vergleich ermöglicht die Ermittlung der relativen Verbesserungen gegenüber den Trainingsdaten. Die Strategien werden ebenfalls mit echten Benutzern getestet. Die Ergebnisse zeigen, dass die RL-basierte Strategie gegenüber SL zu signifikant verbesserten Ergebnissen führt. Die RL-basierte Strategie erziehlt im Durchschnitt 50% mehr „reward“ in der simulierten Interaktion, und 18% mehr „reward“ bei den Benutzertests. Auch bewerten die Benutzer die RL-basierte Strategie mit einer im Durchschnitt um 10% höheren Punktzahl in den Fragebögen. Zum Abschluss führen wir eine Endevaluation durch, bei der wir unterschiedliche Aspekte der drei bisher gesammlten Korpora miteinander vergleichen: die WOZ Daten, die durch simulierte Interaktion generierten Daten, und die Benutzertests. Die Evaluierung erlaubt den Schluss, dass die Methode des „Bootstrappens“ für den Entwurf von Strategien geeignet ist, die auf die Benutzerbedürfnisse optimiert sind.
vi
Acknowledgements First of all, I would like to thank my advisor Oliver Lemon. His ideas and influence have decisively shaped this thesis. In our collaboration, I have benefited enormously from his profound experience in spoken dialogue system and Reinforcement Learning. His enthusiasm for our line of work is infectious, and he will always know the right questions to ask. I also would like to thank my advisor and Doktorvater Manfred Pinkal. He gave me a lot of freedom to pursue my own ideas. He also encouraged me to think about the implications of my work in a wider context. I was lucky to write this thesis in a very productive and friendly research environment. First of all, I was a visiting student at the Human Communication Research Centre in Edinburgh. This stay gave me the opportunity to meet many interesting people, and work intensely on the Reinforcement Learning part of my thesis, where I got great support of Kalliroi Georgilia, Xingkun Liu, Jamie Henderson and Johanna Moore. This research was funded by the International Research Training Group Language Technology and Cognitive Systems (Saarland University), which also gave me the chance to be part of a very friendly and enthusiastic group of fellow students. I especially enjoyed our annual meetings where we discussed our research in a broad interdisciplinary context. This thesis was also closely affiliated to the TALK project (Talk and Look: Tools for Ambient Linguistic Knowledge) which was funded by the EU as project No. IST-507802 within the 6th Framework program. I especially have to thank Ivana Kruijff-Korbayová, Ciprian Gerstenberger, Jan Schehl, Tilman Becker and Matt Stuttle. A number of people and events were involved with this thesis in less direct but nevertheless important ways: my co-annotator Michael Wirth, Alissa Melinger giving me advice on statistics, Dan Shapiro who provided the REALL software tool, Olivier Pietquin who provided many valuable comments on my thesis, and a research visit to Cambridge and Carnegie Mellon University. I also had the great opportunity to be part of an international group of young researchers working on spoken dialogue systems. One of the outcomes of this spontaneous collaboration is the Young Researchers Round Table for Spoken Dialogue Systems, which is about to establish itself as an annual event. I especially would like to mention Alex Gruenstein, Mihai Rotaru, Joel Tetreault, Dan Bohus, David Schlangen, and Gabriel Skantze. Last and foremost, I got a lot of personal support from my family and friends. Listing all the good things they did to me would by far exeed the limited space assigned here. My special warm gratitude to my mum Tatjana and my dad Franz for being great parents. vii
Contents
1
2
Introduction
1
1.1
Motivation . . . . . . . . . . . . . . . . . . . . . . . . . . . . . . .
2
1.2
Contributions . . . . . . . . . . . . . . . . . . . . . . . . . . . . .
3
1.3
Overview of the thesis . . . . . . . . . . . . . . . . . . . . . . . .
5
Background
9
2.1
Human-Computer Interaction . . . . . . . . . . . . . . . . . . . . .
10
2.2
Dialogue strategy development . . . . . . . . . . . . . . . . . . . .
12
2.2.1
Conventional development lifecycle . . . . . . . . . . . . .
13
2.2.2
Evaluation and strategy quality control . . . . . . . . . . .
14
2.2.3
Strategy implementation . . . . . . . . . . . . . . . . . . .
18
2.2.4
Challenges for strategy development . . . . . . . . . . . . .
20
Literature review: Learning dialogue strategies . . . . . . . . . . .
22
2.3.1
Machine Learning paradigms . . . . . . . . . . . . . . . .
22
2.3.2
Supervised Learning for dialogue strategies . . . . . . . . .
24
2.3.3
Dialogue as decision making under uncertainty . . . . . . .
25
2.3.4
Reinforcement Learning for dialogue strategies . . . . . . . . 27
2.3.5
Summary and discussion . . . . . . . . . . . . . . . . . . .
30
Reinforcement Learning-based dialogue strategy learning . . . . . .
33
2.4.1
Dialogue as Markov Decision Process . . . . . . . . . . . .
33
2.4.2
The Reinforcement Learning Problem . . . . . . . . . . . . . 37
2.4.3
Model-based vs. simulation-based strategy learning . . . . .
2.3
2.4
2.5
44
Dialogue simulation . . . . . . . . . . . . . . . . . . . . . . . . . . . 47 2.5.1
Wizard-of-Oz studies . . . . . . . . . . . . . . . . . . . . .
48
2.5.2
Computer-based simulations . . . . . . . . . . . . . . . . .
49
2.5.3
Discussion . . . . . . . . . . . . . . . . . . . . . . . . . .
50
ix
2.6
2.7 3
Application domain . . . . . . . . . . . . . . . . . . . . . . . . . .
50
2.6.1
Information-seeking dialogue systems . . . . . . . . . . . .
50
2.6.2
Multimodal output planning . . . . . . . . . . . . . . . . .
52
2.6.3
Multimodal dialogue systems for in-car MP3 music players
54
Summary . . . . . . . . . . . . . . . . . . . . . . . . . . . . . . . . 57
Reinforcement Learning for Information Seeking dialogue strategies
59
3.1
60
Introduction . . . . . . . . . . . . . . . . . . . . . . . . . . . . . . 3.1.1
3.2
Simulated learning environments . . . . . . . . . . . . . . . . . . .
63
3.2.1
Problem representation . . . . . . . . . . . . . . . . . . . .
63
3.2.2
Database retrieval simulations . . . . . . . . . . . . . . . .
64
3.2.3
Noise model . . . . . . . . . . . . . . . . . . . . . . . . .
65
3.2.4
User simulations . . . . . . . . . . . . . . . . . . . . . . .
66
3.2.5
Objective/Reward/Evaluation function . . . . . . . . . . . .
68
3.2.6
Application scenarios . . . . . . . . . . . . . . . . . . . . .
69
3.3
The threshold-based baseline . . . . . . . . . . . . . . . . . . . . . . 71
3.4
Reinforcement Learning method . . . . . . . . . . . . . . . . . . .
73
3.4.1
Training the policies . . . . . . . . . . . . . . . . . . . . .
74
Results . . . . . . . . . . . . . . . . . . . . . . . . . . . . . . . . .
75
3.5.1
Qualitative description of learned policies . . . . . . . . . .
78
Summary . . . . . . . . . . . . . . . . . . . . . . . . . . . . . . .
80
3.5 3.6 4
A proof-of-concept study . . . . . . . . . . . . . . . . . . . . 61
The bootstrapping approach to developing Reinforcement Learning-based strategies
81
4.1
Introduction . . . . . . . . . . . . . . . . . . . . . . . . . . . . . .
82
4.1.1
Motivation . . . . . . . . . . . . . . . . . . . . . . . . . .
82
4.1.2
Term definition . . . . . . . . . . . . . . . . . . . . . . . .
83
4.1.3
Related work . . . . . . . . . . . . . . . . . . . . . . . . .
84
4.1.4
Advantages for learning from WOZ data . . . . . . . . . .
86
4.1.5
Challenges for learning from WOZ data . . . . . . . . . . . . 87
4.2
The bootstrapping method . . . . . . . . . . . . . . . . . . . . . .
88
4.2.1
Step 1: Data collection in a Wizard-of-Oz experiment . . . .
89
4.2.2
Step 2: Build a simulated learning environment . . . . . . .
90
4.2.3
Step 3: Train and test a strategy in simulation . . . . . . . . . 91
4.2.4
Step 4: Test with real users . . . . . . . . . . . . . . . . . . . 91 x
4.2.5 4.3 5
92
Summary . . . . . . . . . . . . . . . . . . . . . . . . . . . . . . .
92
Data Collection in a Wizard-of-Oz experiment 5.1
5.2
95
Experimental setup . . . . . . . . . . . . . . . . . . . . . . . . . . . 97 5.1.1
Recruited subjects: wizards and users . . . . . . . . . . . . . 101
5.1.2
Experimental procedure and task design . . . . . . . . . . . . 101
Noise simulation . . . . . . . . . . . . . . . . . . . . . . . . . . .
102
5.2.1
Related work . . . . . . . . . . . . . . . . . . . . . . . . .
102
5.2.2
Method . . . . . . . . . . . . . . . . . . . . . . . . . . . .
103
5.2.3
Results and Discussion . . . . . . . . . . . . . . . . . . . .
103
5.3
Corpus description . . . . . . . . . . . . . . . . . . . . . . . . . .
104
5.4
Analysis . . . . . . . . . . . . . . . . . . . . . . . . . . . . . . . .
105
5.4.1
Qualitative analysis . . . . . . . . . . . . . . . . . . . . . .
106
5.4.2
Subjective ratings from the user questionnaires . . . . . . .
108
Summary and Discussion . . . . . . . . . . . . . . . . . . . . . . .
110
5.5 6
Step 5: Post-evaluation and error analysis . . . . . . . . . .
Building a simulated learning environment from Wizard-of-Oz data
113
6.1
Introduction . . . . . . . . . . . . . . . . . . . . . . . . . . . . . .
114
6.1.1
Dialogue strategy learning with simulated environments . .
114
6.1.2
Method and related work . . . . . . . . . . . . . . . . . . .
116
6.1.3
Outline . . . . . . . . . . . . . . . . . . . . . . . . . . . .
119
6.2
Database description . . . . . . . . . . . . . . . . . . . . . . . . .
120
6.3
Action set selection . . . . . . . . . . . . . . . . . . . . . . . . . . . 121
6.4
6.5
6.3.1
Method and related work . . . . . . . . . . . . . . . . . . . . 121
6.3.2
Annotation scheme . . . . . . . . . . . . . . . . . . . . . .
122
6.3.3
Manual annotation . . . . . . . . . . . . . . . . . . . . . .
124
6.3.4
Action set for learning . . . . . . . . . . . . . . . . . . . .
125
State space selection . . . . . . . . . . . . . . . . . . . . . . . . . . 127 6.4.1
Method and related work . . . . . . . . . . . . . . . . . . . . 127
6.4.2
Task-based state space features . . . . . . . . . . . . . . . .
6.4.3
Feature selection techniques for domain-specific state space
128
features . . . . . . . . . . . . . . . . . . . . . . . . . . . .
129
MDP and strategy design . . . . . . . . . . . . . . . . . . . . . . .
133
6.5.1
Motivation . . . . . . . . . . . . . . . . . . . . . . . . . .
133
6.5.2
Implementation . . . . . . . . . . . . . . . . . . . . . . . .
134
xi
6.6
6.7
6.8
6.9
6.5.3
Hierarchical Reinforcement Learning in the ISU approach .
134
6.5.4
Further system behaviour . . . . . . . . . . . . . . . . . . . . 137
Supervised Baseline Strategy . . . . . . . . . . . . . . . . . . . . .
138
6.6.1
Method and related work . . . . . . . . . . . . . . . . . . .
138
6.6.2
Supervised Learning: Rule-based Classification . . . . . . .
139
Noise simulation: Modelling the effects of mis-communication . . . . 141 6.7.1
Method and related work . . . . . . . . . . . . . . . . . . . . 141
6.7.2
Simulating the effects of non- and mis-understandings . . .
142
User simulation . . . . . . . . . . . . . . . . . . . . . . . . . . . .
144
6.8.1
Method and related work . . . . . . . . . . . . . . . . . . .
144
6.8.2
User actions . . . . . . . . . . . . . . . . . . . . . . . . . .
149
6.8.3
A simple bi-gram model . . . . . . . . . . . . . . . . . . .
150
6.8.4
Cluster-based user simulation . . . . . . . . . . . . . . . .
152
6.8.5
Smoothed bi-gram user simulation . . . . . . . . . . . . . .
154
6.8.6
Evaluation: Simulated User Pragmatic Error Rate . . . . . .
155
6.8.7
Speech Act realisation dependent on the user goal . . . . . . . 161
Reward and objective functions . . . . . . . . . . . . . . . . . . . .
165
6.9.1
Method and related work . . . . . . . . . . . . . . . . . . .
165
6.9.2
Linear regression for information acquisition . . . . . . . .
170
6.9.3
Non-linear rewards for information presentation . . . . . . .
172
6.9.4
Final reward . . . . . . . . . . . . . . . . . . . . . . . . .
174
6.10 State-space discretisation . . . . . . . . . . . . . . . . . . . . . . .
176
6.11 Learning experiments . . . . . . . . . . . . . . . . . . . . . . . . . . 177 6.11.1 Training with SHARSHA . . . . . . . . . . . . . . . . . . . . 177 6.11.2 Results for testing in simulation . . . . . . . . . . . . . . .
178
6.11.3 Qualitative strategy description . . . . . . . . . . . . . . . . . 181
7
6.11.4 Strategy implementation . . . . . . . . . . . . . . . . . . .
184
6.11.5 Discussion and error analysis . . . . . . . . . . . . . . . . .
186
6.12 Summary . . . . . . . . . . . . . . . . . . . . . . . . . . . . . . .
190
Comparing Reinforcement and Supervised Learning of dialogue policies with real users
193
7.1
Policy integration into a dialogue system: The iTalk system . . . . .
194
7.1.1
The DUDE rapid dialogue development tools . . . . . . . .
194
7.1.2
Extensions to DUDE . . . . . . . . . . . . . . . . . . . . . . 197
xii
7.2
7.3
7.4 8
7.2.1
Technical setup . . . . . . . . . . . . . . . . . . . . . . . . . 201
7.2.2
Primary driving task . . . . . . . . . . . . . . . . . . . . .
203
7.2.3
Subjects and procedure . . . . . . . . . . . . . . . . . . . .
204
7.2.4
Task types . . . . . . . . . . . . . . . . . . . . . . . . . . .
205
7.2.5
User questionnaires . . . . . . . . . . . . . . . . . . . . . .
206
Results . . . . . . . . . . . . . . . . . . . . . . . . . . . . . . . . . . 207 7.3.1
Subjective user ratings . . . . . . . . . . . . . . . . . . . . . 207
7.3.2
Objective dialogue performance . . . . . . . . . . . . . . . . 211
Discussion . . . . . . . . . . . . . . . . . . . . . . . . . . . . . . .
214
Wizard-of-Oz, Simulation, and Real Users: Do Results Transfer?
217
8.1
Introduction . . . . . . . . . . . . . . . . . . . . . . . . . . . . . .
218
8.2
Comparison of Dialogue Performance . . . . . . . . . . . . . . . .
219
8.2.1
Comparison of objective dialogue performance . . . . . . .
219
8.2.2
Comparison of subjective dialogue performance . . . . . . . . 221
8.3
9
Experimental setup . . . . . . . . . . . . . . . . . . . . . . . . . . . 201
Evaluation of data-driven Dialogue Objective Functions . . . . . . .
222
8.3.1
Motivation . . . . . . . . . . . . . . . . . . . . . . . . . .
223
8.3.2
Model Stability . . . . . . . . . . . . . . . . . . . . . . . .
223
8.3.3
Model Performance: Prediction Accuracy . . . . . . . . . .
225
8.3.4
Error Analysis . . . . . . . . . . . . . . . . . . . . . . . . . 227
8.4
Discussion of the noise model . . . . . . . . . . . . . . . . . . . .
229
8.5
Summary and Discussion . . . . . . . . . . . . . . . . . . . . . . .
230
Conclusion
233
9.1
Contributions . . . . . . . . . . . . . . . . . . . . . . . . . . . . .
234
9.2
Discussion . . . . . . . . . . . . . . . . . . . . . . . . . . . . . . .
236
9.2.1
Lessons learned . . . . . . . . . . . . . . . . . . . . . . . .
236
9.2.2
RL for commercial dialogue strategy development . . . . .
240
9.3
Outlook . . . . . . . . . . . . . . . . . . . . . . . . . . . . . . . . . 241
A Wizard-of-Oz study
245
A.1 Wizard Instructions . . . . . . . . . . . . . . . . . . . . . . . . . .
245
A.2 User instructions . . . . . . . . . . . . . . . . . . . . . . . . . . .
248
A.3 Tasks . . . . . . . . . . . . . . . . . . . . . . . . . . . . . . . . .
249
A.4 User Questionnaire . . . . . . . . . . . . . . . . . . . . . . . . . .
253
xiii
B Example Dialogues
257
B.1 Wizard-of-Oz Example Dialogues . . . . . . . . . . . . . . . . . . . 257 B.2 Example Dialogues from Simulated Interaction . . . . . . . . . . .
260
B.3 Example Dialogues from User Testing . . . . . . . . . . . . . . . .
264
C Learned State-Action Mappings
269
D User Tests
273
D.1 Statement of Consent . . . . . . . . . . . . . . . . . . . . . . . . .
273
D.2 User Instructions . . . . . . . . . . . . . . . . . . . . . . . . . . .
275
D.3 Task sets for user tests . . . . . . . . . . . . . . . . . . . . . . . . . 277 D.4 User Questionnaire . . . . . . . . . . . . . . . . . . . . . . . . . .
278
D.4.1 Driving Task Questionnaire . . . . . . . . . . . . . . . . .
279
D.4.2 Personal Information . . . . . . . . . . . . . . . . . . . . .
280
D.4.3 Transcripts of user comments . . . . . . . . . . . . . . . . . 281 Bibliography
283
xiv
List of Figures
1.1
A chicken and egg problem – How to learn optimal dialogue strategies without a working prototype? . . . . . . . . . . . . . . . . . . . . . .
2.1
1
Wolfgang Von Kempelen’s speaking machine, drawing from his book Mechanismus der menschlichen Sprache nebst Beschreibung einer sprechenden Maschine (1791) . . . . . . . . . . . . . . . . . . . .
9
2.2
Dialogue system architecture and processing pipeline . . . . . . . .
12
2.3
Iterative development cycle used to develop dialogue systems . . . .
13
2.4
RL with Markov Decision Processes (MDPs): The learning agent travels through a network of interconnected states. At each time t, the agent is in state st , takes an action at , transitions into state st+1 according to the transition probability p(st+1 |st , at ) and receives reward rt+1 . . . . . . . . . . . . . . . . . . . . . . . . . . . . . . .
2.5
33
Agent interacting with a stochastic environment and actively influencing its behaviour by taking action at in state st . The changes in the environment are observed (ot+1 ) and a reward is received rt+1 . . .
2.6
34
Action space and state space for dialogue as a MDP: For slot filling dialogues the dialogue state might contain slot states; System action can be represented as tuples consisting of dialogue act, slot name and an optional slot value. . . . . . . . . . . . . . . . . . . . . . . . . .
2.7
Model-based Reinforcement Learning: Learning a transition model for the transition function Tssa0 and the reward function Rssa0 from data.
2.8
45
Simulation-based Reinforcement Learning: Learning a stochastic simulated dialogue environment from data. . . . . . . . . . . . . .
2.9
35
46
Wizard-of-Oz simulation setup: Hidden operator (the “wizard") simulates dialogue behaviour; user interacts in the belief of talking to a machine and rates the dialogue behaviour in the end. . . . . . . . . xv
48
2.10 Computer-based simulation setup: The dialogue manager (right) interacts with a simulated user (left) over a noisy channel. . . . . . . . .
49
2.11 Example of a list of retrieved items being displayed on the screen . .
53
3.1
Robot chasing a carrot on a stick – Learning how to chase a reward.
59
3.2
Learning curve for training HiNoise, HiHit, LowTurn policy, Monotonic DB . . . . . . . . . . . . . . . . . . . . . . . . . . . . . . . .
4.1
75
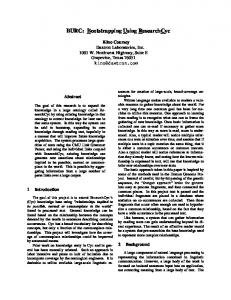
Baron Münchhausen escaping from a swamp by pulling himself up by his own hair; after a novel by (Raspe, 1785), illustration by Hosemann (1840) – The first ‘bootstrap’. . . . . . . . . . . . . . . . . . . . . . . 81
4.2
Development cycle for bootstrapping RL-based dialogue policies from WOZ data. . . . . . . . . . . . . . . . . . . . . . . . . . . . . . . .
5.1
An engraving of Kempelen’s chess “automaton" The Turk from Karl Gottlieb von Windisch’s 1784 book “Inanimate Reason”. . . . . . .
5.2
89
95
Multimodal Wizard-of-Oz data collection setup for an in-car music player application, using the Lane Change driving simulator. Top right: User, Top left: Wizard, Bottom: transcribers. . . . . . . . . . . 97
5.3
Screenshot from the FreeDB-based database application, as seen by the wizard. . . . . . . . . . . . . . . . . . . . . . . . . . . . . . . .
5.4
98
Screenshot from the display presentation tool offering options for screen output to the wizard for second-level of choice what to display an how. . . . . . . . . . . . . . . . . . . . . . . . . . . . . . . . .
100
5.5
NXT-based tool for annotating Clarification Requests . . . . . . . .
106
5.6
User Ratings on the PARADISE questions on a 5-point Likert Scale .
109
5.7
User Ratings on the multimodal presentation questions on a 5-point Likert Scale . . . . . . . . . . . . . . . . . . . . . . . . . . . . . .
6.1
109
Wooden mechanical horse simulator during World War I – Learning with simulated environments. . . . . . . . . . . . . . . . . . . . . .
113
6.2
Annotation scheme of discourse functions for wizard’s actions . . .
123
6.3
State space selection: task representation . . . . . . . . . . . . . . .
128
6.4
State-Action-Space for hierarchical RL . . . . . . . . . . . . . . . .
135
6.5
Dialogue system automaton . . . . . . . . . . . . . . . . . . . . . .
136
6.6
User action frequencies following a system act (bi-gram model): 25% zero frequencies for state-action pairs due to data sparsity . . . . . . . 151 xvi
6.7
Clustered System Actions . . . . . . . . . . . . . . . . . . . . . . .
153
6.8
User action frequencies from the cluster-based user simulation . . .
154
6.9
User action frequencies from the smoothed bi-gram user simulation
155
6.10 Example for context-dependent realisation of possible user speech acts 163 6.11 Evaluation functions relating number of items presented in different modalities to multimodal score . . . . . . . . . . . . . . . . . . . .
174
6.12 Overall framework for RL in a simulated environment obtained from WOZ data . . . . . . . . . . . . . . . . . . . . . . . . . . . . . . . . 191 7.1
Confused user trying to solve a ‘simple’ problem with a touch tone dialogue system. Illustration by Glasbergen (1996) . . . . . . . . .
7.2
193
The development process with the DUDE toolkit (graphic after (Lemon and Liu, 2006)) . . . . . . . . . . . . . . . . . . . . . . . . . . . .
196
7.3
List of retrieved items displayed in the iTalk system . . . . . . . . .
199
7.4
Experimental setup – User interacting with the iTalk system (laptop) while watching a driving simulation video (wall projection). . . . .
8.1
204
Mistmatch between optimised strategy and environment: Mouse learned the shortest way to the food reward in a maze. . . . . . . . . . 217
8.2
Direct comparison of objective measures: SLs = SL policy in simulation; SLr = SL policy with real users; RLs = RL policy in simulation; RLr = RL policy with real users. . . . . . . . . . . . . . . . . . . .
8.3
3D Visualisation of the objective functions obtained from WOZ data and real user data using a SL and RL-based strategy. . . . . . . . .
9.1
220 225
This is a historically significant photo depicting the second KasparovDeep Blue match, the first match in which a reigning human World Champion lost to a computer system, showing Kasparov on the left and Deep Blue’s operator on the right. Photo courtesy of IBM. . . .
xvii
233
List of Tables
2.1
Comparison of dimensions for user satisfaction according to the SASSI and PARADISE questionnaires . . . . . . . . . . . . . . . . . . . .
16
2.2
Frameworks conventionally used for dialogue strategy development
19
2.3
Initialised state-action values before learning for a learning problem with 4 states s1−4 and 3 actions a1−3 . . . . . . . . . . . . . . . . . .
2.4
Learned state-action values: The optimal strategy selects the action a with the highest expected value in each state s. . . . . . . . . . . . .
3.1
40
Probabilistic user simulation with noise model High Noise (HN) and Low Noise (LN) . . . . . . . . . . . . . . . . . . . . . . . . . . . .
3.2
40
68
Direct comparison between mean rewards (with standard deviation ±) obtained by the RL-based and best performing hand-coded policy for each environment with results from a paired t-test; ** denotes p < .005, *** p < .001 . . . . . . . . . . . . . . . . . . . . . . . .
3.3
76
Comparison of mean performance measures for learned and handcoded policies, for monotonic (left) and random (right) DB models . . 77
3.4
Multiple regression analysis on factors influencing strategy performance (reward); R2 = .4, excluded factors: user type, screen size . .
6.1
Utilised evaluation metrics for different simulated components used for RL-based strategy learning . . . . . . . . . . . . . . . . . . . .
6.2
118
Reduced action set: System speech acts and corresponding discourse functions . . . . . . . . . . . . . . . . . . . . . . . . . . . . . . .
6.3
78
124
System action types and frequencies as annotated in the data. (?) indicates the action types that won’t be learned. . . . . . . . . . . .
126
6.4
Contextual/Information-state features: Local Features . . . . . . . .
130
6.5
Contextual/Information-state features: History Features . . . . . . . . 131
xix
6.6
Contextual/Information-state features: User Model Features . . . . . 131
6.7
Example: Features in the context after the first turn in example 6.1 .
6.8
Available system actions and their preconditions. . . . . . . . . . . . 137
6.9
Predicted accuracy for presentation timing and mode (with standard deviation ±) . . . . . . . . . . . . . . . . . . . . . . . . . . . . . .
132
140
6.10 Action mapping from corpus annotation to user acts including the noise model . . . . . . . . . . . . . . . . . . . . . . . . . . . . . .
144
6.11 User action types and frequencies as annotated in the data. . . . . .
149
6.12
SUPER
evaluation – User action distributions per system act . . . . .
159
6.13
SUPER
scores . . . . . . . . . . . . . . . . . . . . . . . . . . . . .
160
6.14 Final probabilities for generating user actions from the cluster based model . . . . . . . . . . . . . . . . . . . . . . . . . . . . . . . . .
162
6.15 Final probabilities for generating user actions from the smoothed model162 6.16 Learning curve for training: whole training run (top), zoom-in between ca. 5k and 13k dialogues (bottom) . . . . . . . . . . . . . . . . . .
179
6.17 Comparison of mean performance for learned and WoZ policies testing with a cluster-based and a smoothed user simulation (with standard deviation ±); *** denotes statistical significance at p < .001 . . . . 7.1
180
Form filling (top) and information-seeking (bottom) dialogue strategies for a 4 slot problem (S1 − S4) with different opportunities for entering the presentation phase (P). The arcs denote slot transitions with implicit/ explicit confirmation or by asking a new slot value (denoted as ‘aas’ in the figure). . . . . . . . . . . . . . . . . . . . .
198
7.2
Example AVM for measuring task completion . . . . . . . . . . . .
206
7.3
Comparison of mean user ratings for SL and RL policies(with standard deviation ±); *** denotes statistical significance at p < .001 . . . .
208
7.4
Effects of gender and native vs. non-native speakers on user perception209
7.5
Dialogue length in turns and multimodally presented items for SL and RL in the user tests; dialogue length with outliers ◦ . . . . . . . . .
7.6
212
Direct comparison of objective measures for the WOZ and the RLbased policy; where * denotes statistical significance at p < .05, ** at p < .005, and *** at p 6). The different thresholds for the hand-coded policies thus determine when to stop asking for new constraints. For the baseline systems, we designed four hand-coded policies with the following combinations of hand-tuned thresholds: Hss : short dialogues (≤ 6), short lists (≤ 7): e.g. in-car, impatient user Hls : long dialogues (≤ 10), short lists (≤ 7): e.g. in-home, patient user Hsl : short dialogues (≤ 6), long lists (≤ 14): e.g. in-car, with impatient user Hll : long dialogues (≤ 10), long lists (≤ 14): e.g. in-home, patient user Example 3.6 shows an example dialogue using the simulated user and a baseline policy with DB information presentation and dialogue length thresholds 7 and 6 respectively. At each system move we report the number (“db:") of DB hits obtained by the system. 4
4 Note
that our database simulation assumes continuous values in the database and does not account for domain-specific constraints such as album size, as the proof-of-concept study is meant to be domain independent.
3.4. Reinforcement Learning method
73
(3.6) System: ‘‘Hello, how may I help you?’" greet User:
‘‘Do you have some modern classical music?’ provide_info(slot1)
System: ‘‘Ok, modern classical. Which composer?’’ implConf(slot1)AskASlot(slot2) (db: 77) User:
‘‘Steve Reich?" provide_info(slot2)
System: ‘‘Searching music by Steve Reich. Do you have a preferred piece?" implConf(slot2) AskASlot(slot3) (db:25) User: ‘‘Yes, Drumming" provide_info(slot3) System: ‘‘Did you say Drumming?" explicitConfirm(slot3) (db: 4) User:
‘‘Yes" yes_answer
System: ‘‘OK, there are 4 parts on this album, which are now shown on the screen." presentList(slot1, slot2,slot3)(db:4)
A major draw-back of hand-coded thresholds for a rule-based systems is that they are usually globally defined, i.e. the thresholds are fixed for the whole interaction. Ideally one wants to formulate rules like “if the dialogue gets too long, relax the constraint for DB presentation", or “if the threshold for DB hits is already reached at the beginning of the dialogue, it might still be worth asking the user for more confirmation/constraints in order to increase task success" etc. Specifying these contextual rules makes handcoding even more complex and harder to design a policy which is optimal (with respect to the defined objective function). The Reinforcement Learning experiments presented below effectively learn optimal values for different objective functions.
3.4
Reinforcement Learning method
For policy learning we use the REALL-DUDE development tool (Lemon et al., 2006c), which implements the SARSA RL algorithm (see Section 2.4.2.2) with linear function
74
Chapter 3. Reinforcement Learning for Information Seeking dialogue strategies
approximation (see Section 2.4.2.3). We will describe the
REALL - DUDE
learning
system in more detail in Section 6.11. For learning, the dialogue is formalised as a Markov-Decision-Process (MDP), with the problem formalised as the state-action space as described in Section 3.2.1. In the following we report on 16 experiments where we systematically vary the 2 database definitions and 8 objective/reward functions (as defined in Section 3.2.6).
3.4.1
Training the policies
For learning we use the following parameters: 5 • numberOfCycles = 96k • learning rate α = 0.2 • discount rate γ = 0.95 • eligibility trace parameter λ=0.9 • exploration halving time ε= 16 × numberO fCycles = 16k The learning rate α is the step-size parameter for learning, as described in Section 2.4.2.2. The discount factor gamma (γ) may take a value between 0 and 1. For the dialogue management problem we set it close to 1 so that future rewards are strongly weighted (Sutton and Barto, 1998). The lambda (λ) parameter refers to the trace decay parameter, with 0 ≤ λ ≤ 1. Higher settings lead to longer lasting traces; that is, a larger proportion of credit from a reward can be given to more distal states and actions, (with λ=1 producing parallel learning to Monte Carlo algorithms, see Section 2.4.2.2). The exploration halving time epsilon (ε) halves the exploration rate every 16k dialogues, where ε is about
1 6
of the agent’s life time. Each policy is trained
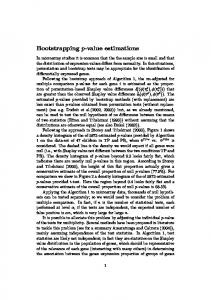
over 96,000 cycles of the system, which resulted in about 12,000 simulated dialogues per training run. Figure 3.2 shows a training run where the policy learns to reduce the number of database hits presented to the user (grey, +1 per presented item) and dialogue length (black, -1 per turn) while obtaining a high completionValue (green). Average dialogue reward, computed over windows of 50 dialogues, is shown by the red line. Note that after about 6000 dialogues the learner has settled on a policy of 5 In
this thesis we do not experiment with parameter setting, but used the recommended default settings for REALL.
3.5. Results
75
confirming all information slots while presenting fewer than 10 items in fewer than 20 turns.
Figure 3.2: Learning curve for training HiNoise, HiHit, LowTurn policy, Monotonic DB
3.5
Results
We test each (learned and baseline) policy in each condition by running 550 test dialogues in simulation. 6 We compare the policies in respect of their average final reward per dialogue over the test runs. We then perform a paired t-test (a planned comparison with Bonferroni correction) on the final rewards, to determine statistical significance. The results produced by the learned policies (denoted RL) and the best hand-coded baseline can be seen in Table 3.2. The manually optimised hand-coded strategy performs equally well to the RL-based strategy in only 4 out of 16 conditions. Especially in the more challenging random DB case, the RL-based policy learns to better adapt to the current context. Detailed results produced by the learned policies and all the dif6 Note
that this policy is trained and tested on the same user simulation. Although this method is commonly employed for dialogue strategy learning, e.g. (Henderson et al., 2008; Heeman, 2007) etc., training and testing on the same user simulation has been criticised of being “cheating" (Paek, 2006). In Chapter 6 we train and test a RL-based policy using two different user simulations. We also show that results transfer between user simulations, i.e. there is no significant difference in strategy performance between the user model which the strategy is trained on and the one which is was only used for testing (see Section 6.11.2).
76
Chapter 3. Reinforcement Learning for Information Seeking dialogue strategies
ferent hand-coded baselines (Hss . . . Hll ) for 4 of the operating conditions/application scenarios can be seen in Figure 3.3. We further discuss these results in the following. Reward def.
best hand-coded
RL
Monotonic DB HiNoise, HiHit, HiTurn
-31.1±54.7
28.1±7.8***
HiNoise, LowHit, HiTurn
25.3±30.2
28.4±11.1**
HiNoise, HiHit, LowTurn
34.9±30.6
41.3±21.3***
HiNoise, LowHit, LowTurn
85.7±11.2
86.0±4.6
LowNoise, HiHit, HiTurn
85.6±5.9
87.2±4.5**
LowNoise, HiHit, LowTurn
38.1±28.7
41.8±45.9
LowNoise, LowHit, HiTurn
31.8±14.4
31.3±10.1
LowNoise, LowHit, LowTurn
-22.6±54.3
-20.2±22.5
Random DB HiNoise, HiHit, HiTurn
-373.3±321.4
-159.7±96.3***
HiNoise, LowHit, HiTurn
-275.1±312.0
-115.7±164.9***
HiNoise, HiHit, LowTurn
-1.3±38.8
13.8±25.5***
HiNoise, LowHit, LowTurn
55.2±30.8
62.6±21.6***
LowNoise, HiHit, HiTurn
55.1±32.3
80.5±9.3***
LowNoise, HiHit, LowTurn
-290.2±310.7
-155.3±217.5***
LowNoise, LowHit, HiTurn
1.9±39.5
20.4±23.2***
LowNoise, LowHit, LowTurn
-333.6±316.5
-166.1±206.9***
Table 3.2: Direct comparison between mean rewards (with standard deviation ±) obtained by the RL-based and best performing hand-coded policy for each environment with results from a paired t-test; ** denotes p < .005, *** p < .001
Consider, for example, the pair of graphs in the top row of table 3.3. These show the differences between the monotonic and random DB cases, for the case HiNoise, LowHit, HiTurn. In the monotonic case, we can see that the learned policy has the fewest turns, but presents the longest lists, and outperforms all the hand-coded configurations. All policies perform worse in the more challenging random DB case, as expected, but the learned policy for the random case has learned that in some cases not all filled slots need to be confirmed (presumably because sometimes users provide new information when asked for confirmation, which can increase the number of DB hits in the random model), and to keep dialogues short. The learned policy here significantly outperforms all the hand-coded configurations (at p < .001 or p < .01).
3.5. Results
77
Table 3.3: Comparison of mean performance measures for learned and hand-coded policies, for monotonic (left) and random (right) DB models
Now consider the first column of table 3.3. These two graphs show the differences between the LowHit, HiTurn and HiHit, LowTurn cases for monotonic DBs in HighNoise. Moving from the LowHit, HiTurn (top left) to the HiHit, LowTurn (bottom left) case, we see that the learner earns more reward by increasing dialogue length and decreasing the number of presented items, as expected. In both cases the learned policies significantly outperform all the different hand-coded (threshold-based) configurations (p < .001). Finally, consider the top right (HiNoise, LowHit, HiTurn) and bottom right (LowNoise, LowHit, HiTurn) graphs, which are both for the random DB model. Moving down, we see
78
Chapter 3. Reinforcement Learning for Information Seeking dialogue strategies
that in the LowNoise case, the learner has settled on a policy of confirming fewer slots than in the high noise case (because filled slots are more reliable in low noise). Interactions are thus shorter, and more reward is gained. In both cases the learned policies significantly outperform all the hand-coded configurations (p < .001). Across all the results, the learned policies produce an average relative increase in reward of 86.78% over the various hand-coded baseline policies. In 93% of the cases the learned policies perform highly significantly better than hand-coded (p < .001). It is also interesting to note that amongst all the factors describing our application scenarios the DB model was the one with with the strongest impact on the strategies’ performance. A regression analysis on performance measures using noise levels,user type, screen size, and DB retrieval type as predictors showed that DB retrieval is the most important factor, see Table 3.4. factors
B
Std. Error
constant
6.44
.101
DB retrieval
-1.8
.034
-.57***
noise level
-0.25
.013
-.239***
β
Table 3.4: Multiple regression analysis on factors influencing strategy performance (reward); R2 = .4, excluded factors: user type, screen size
3.5.1
Qualitative description of learned policies
We now provide a qualitative description of the learned policies, based on examples. We report the number of database hits at each stage of the interaction (“db:”). In example 3.7 the policy trained for monotonic DB and HiNoise, LowHit, HiTurn has learned to attempt to fill all 4 slots and confirm them before presenting items. It has also learned not to explicitly confirm if the user rejects, if the dialogue becomes too long. This strategy prefers to present a list of results not including the rejected slot as an search constraint. For the HiNoise environment presenting a list of options rather than asking for explicit confirmation circumvents the speech recognition problem.
3.5. Results
79
(3.7) System: ‘‘Hello, how may I help you?’’ greet User:
‘‘I want a Radiohead song’’ provide_info(slot1)
System: ‘‘Ok, a Radiohead song. From what album?’’ implConf(slot1)AskASlot(slot2) (db: 77) User:
‘‘From OK Computer’’ provide_info(slot2)
System: ‘‘OK from OK Computer. What song title?’’ implConf(slot2)AskASlot(slot3) (db: 12) User:
‘‘Paranoid Android’’ provide_info(slot3)
System: ‘‘Did you say Karma Police?’’ explicitConfirm(slot3) (db: 1) User:
‘‘No’’ no_answer
System: ‘‘OK, there are 12 items you might be looking for, which are now shown on the screen.’’ presentList(slot1,slot2)(db:12)
Example 3.8 shows an example of the policy learned for random DB, LowNoise, LowHit, and HiTurn. The learned policy here fills one slot and then immediately presents the list, since it has already found a relatively low number of hits, and for a random DB filling more slots does not necessarily result in a lower number of DB hits. Due to the LowNoise condition it has also learned not to confirm the slot in this situation. This strategy has learned to “take its chance" in this type of situation, once a relatively small number of results has been retrieved. (3.8) System: ‘‘Hello, how may I help you?’’ greet User:
‘‘I want a Radiohead song’’ provide_info(artist_name)
System:
‘‘OK, there are 22 items you might be looking for, which are now shown on the screen.’’ presentList(artist_name,album_name)(db:22)
80
Chapter 3. Reinforcement Learning for Information Seeking dialogue strategies
3.6
Summary
Machine Learning methods such as Reinforcement Learning are recently explored as an alter- native to hand-coding dialogue strategies. In this Chapter we provide the general proof-of-concept that RL-based strategies significantly outperform manually tuned heuristics for a wide range of possible application scenarios. The RL-based policies produce an average relative increase in reward of 86.78% over the various hand-coded baseline policies. In 93% of the cases the learned policies perform highly significantly better than the hand-coded ones (p < .001). We also demonstrate how to use a statistical policy learning framework (RL with the SARSA
algorithm and linear function approximation) to address a complex problem:
what questions to ask the user, how many database search results to present to the user, and when to present them, given the competing trade-offs between the length of the answer list, the length of the interaction, the type of database, and the noise in the speech recognition environment. One of the major strength of RL-based strategies is that they “intelligently" adapt their behaviour to the local representation of the dialogue context in order to satisfy an overall objective. One can think of this as locally adaptive “thresholds" which are globally optimised. The standard technique for hand-coded threshold-based policies, in contrast, is to set a single “global" threshold which does not change over the whole interaction. This Chapter also demonstrates that RL-based strategies learn to adapt to the simulated learning environment in very subtle ways. Thus, the correct representation of the learning environment is one of the key challenges for this framework. When constructing a simulated learning environment by hand, one might argue that the problem is only transferred to another level of manual tuning. Data-driven methods to construct such a learning environment should therefore be preferred. In cases where a system is designed from scratch, however, it is often the case that no suitable in-domain data is available. Collecting dialogue data without a working (hand-crafted) prototype is problematic, leaving the developer with a classic chickenand-egg problem. In the next Chapter we introduce an approach where the entire simulated learning environment is “bootstrapped" from Wizard-of-Oz data.
Chapter 4 The bootstrapping approach to developing Reinforcement Learning-based strategies
Figure 4.1: Baron Münchhausen escaping from a swamp by pulling himself up by his own hair; after a novel by (Raspe, 1785), illustration by Hosemann (1840) – The first ‘bootstrap’.
81
82Chapter 4. The bootstrapping approach to developing Reinforcement Learning-based strategies
4.1
Introduction
This Chapter motivates and introduces a procedural method to automatic strategy learning from Wizard-of-Oz (WOZ) data. Note that this Chapter will only present the approach on a conceptual level, while the concrete practical realisation of the individual steps will be further elaborated in the subsequent chapters. It should be noted that the following steps are not unique to the method introduced in this thesis, but most of the defined steps are required for any simulation-driven approach to strategy learning (though the last step is specific to our method). The contribution of this thesis is that all these steps are now performed starting with a limited WOZ data set, and specific methods are introduced to build and validate the obtained simulations.
4.1.1
Motivation
One of the key advantages of statistical optimisation methods, such as Reinforcement Learning (RL), for dialogue strategy design is that the problem can be formulated as a precise mathematical model which can be trained on real data. In the previous Chapter 3 we show that RL-based strategies outperform hand-coded strategies with manually tuned thresholds for a wide range of application scenarios. One of the major strength of RL-based strategies is that they “intelligently" adapt their strategies to the (local) representation of the dialogue environment in order to satisfy an overall objective. Thus, the correct representation of the learning environment is one of the key challenges for this framework, and data-driven methods to construct such a simulation should be preferred over hand-carfting (as done for the proof-of-concept study in Chapter 3 ). In cases where a system is designed from scratch, however, there is often no suitable in-domain data. Collecting dialogue data without a working prototype is problematic, leaving the developer with a classic chicken-and-egg problem. We propose to learn dialogue strategies by simulation-based RL, where the simulated environment is learned from small amounts of WOZ data. Using WOZ data rather than data from real Human-Computer Interaction (HCI) allows us to learn optimal strategies for domains where no working dialogue system already exists. To date, automatic
4.1. Introduction
83
strategy learning has been applied to dialogue systems which have already been deployed in the real world using handcrafted strategies. In such work, strategy learning was performed based on already present extensive online-operation experience, e.g. Singh et al. (2002); Henderson et al. (2005, 2008). In contrast to this preceding work, our approach enables strategy learning in domains where no prior system is available. Optimised learned strategies are then available from the first moment of online-operation, and tedious handcrafting of dialogue strategies is fully omitted. This independence from large amounts of in-domain dialogue data allows researchers to apply RL to new application areas beyond the scope of existing dialogue systems. We call this method ‘bootstrapping’.
4.1.2
Term definition
The term to ‘bootstrap’ has various different meanings in the fields of computer science (to ‘boot’ a system), linguistics (theory of language acquisition), statistics (sample with replacement for statistical inference), physics, law, business and many more. We use the term in a sense which is closer to its original meaning of “pulling oneself up by one’s own bootstraps". The term is said to have come from a tale from the adventures of Baron Münchhausen who, according to the story, escaped from a swamp by pulling himself up by the straps of his boots. Although in other versions of the story he pulled his hair (Raspe, 1785), see Figure 4. In this thesis the term is used to describe the problem of how to learn an optimal strategy before a working system or prototype exists, and thus circumvent the chickenand-egg problem. The bootstrapping method conceptually contrasts with dialogue strategies being manually “uplifted" by a by a human expert. Note that “bootstrapping" was also used to determine other aspects of dialogue system design: Weilhammer et al. (2006) “bootstrap" the ASR language model from WOZ data. Fabbrizio et al. (2004, 2008) “bootstrap" various dialogue components from out-of-domain data. In general, the term “bootstrapping" is used to describe the problem of how to build dialogue components in a data-driven manner without having in-domain data available.
84Chapter 4. The bootstrapping approach to developing Reinforcement Learning-based strategies
4.1.3
Related work
In general, RL-based dialogue policy learning is based on trial-and-error learning from seeing as many interactions as possible (see Sections 2.3.4 and 2.4.2.3). There are two main techniques for addressing this problem: generalisation of state spaces, e.g. Henderson et al. (2005, 2008) , and simulation-based learning. Nevertheless, both techniques require initial data to start with. In cases where a system is designed from scratch, however, there is often no suitable in-domain data. Learning dialogue strategies from human-human interaction data (if available) is not an option, as humans behave differently towards machines than with other people (Jönsson and Dahlbäck, 1988; Moore and Morris, 1992; Doran et al., 2001). Furthermore, human-human interaction is usually less affected by channel noise as humans are much better in handling uncertainty (see Section 2.1). It is also not considered an option to use several disparate data sets to build different simulated components from. This approach assumes that simulated dialogue components are independent from each other, which clearly is not the case for most of the simulations. For example, this approach assumes that the user behaviour is independent from the channel noise. It is common practise in current research to obtain all the simulated components from one data set, e.g. (Schatzmann, 2008), (Singh et al., 2002; Henderson et al., 2005, 2008). (Prommer et al., 2006) also experiment with using data from an isolated data collection to retrain some of the simulated components. However, the results indicate that this can easily lead to experimental conditions which are inconsistent with the environment of the final task setup. Nevertheless, some sub-components can be learned from out-of-domain data. For example, a phoneme confusion matrix for ASR modeling can be learned on any (big and representative enough) data set (Stuttle et al., 2004). In sum, there is a strong indication that we need one consistent data set of human machine interaction for building a simulated learning environment. When building a system from scratch, however, there is often no suitable in-domain data available. Different approaches have been suggested to address the problem of lacking initial training data: handcrafting the simulated components (Schatzmann et al., 2007a), online learning (Chickering and Paek, 2007), transfering policies from another domain (Lemon et al., 2006a; Lemon and Liu, 2007), and also starting learning from a limited amount of WOZ data (Williams and Young, 2004b; Prommer et al., 2006).
4.1. Introduction
85
Schatzmann et al. (2007a) suggest to manually set the initial parameters of a simulated environment to learn a policy. This policy is then used to gather initial data, which then can be used to re-train the parameters of the simulation and then re-train the policy. We argue that that data-driven methods should be preferred in order to assure consistent, realistic behaviour (see discussion Section 3.6). Chickering and Paek (2007) circumvent the data problem by using online RL. However, online learning requires many iterations with real users to have noticeable effect. In addition, it requires the continuous use of exploration during online operation, which can result in a quite confusing and frustrating interaction for real users. Furthermore, it is not clear how to infer a reward function during online operation. Hence, online learning can be used to constantly improve/adapt a reasonably well-performing strategy, but it is not suited to design a strategy from scratch. Another approach is to learn a policy on out-of-domain data and “port" this policy to the domain of interest (Lemon et al., 2006a; Lemon and Liu, 2007). Lemon and Liu (2007) conduct a principled study to investigate conditions under which strategies are portable. Their results suggest that some conditions transfer, while others don’t. For example, a strategy trained in a high noise scenario transfers well to lower noise, but not the other way round. Also strategies learned on different user types don’t seem to transfer well. We therefore conclude that learning from in-domain data is still preferable. In recent work the use of WOZ data has been proposed in the context of Reinforcement Learning (Williams and Young, 2004b; Levin and Passonneau, 2006; Prommer et al., 2006) (for a description of WOZ see Section 2.5.1). Usually, a WOZ study is conducted at the beginning of the conventional life-cycle approach (see Section 2.2.1) and has been used to train and test various aspects of dialogue systems. For example, Weilhammer et al. (2006) develop the ASR language model from WOZ data; Whittaker et al. (2002) do initial strategy testing; and Okamoto et al. (2001) learns a supervised policy (cf. Section 2.3.2). In the context of RL-based strategy learning, WOZ was used for different purposes. Williams and Young (2004b) utilise WOZ data to discover the state and action space by manual annotation. Similarly, Levin and Passonneau (2006) discuss a WOZ variant which is meant to investigate the wizards’ error handling strategies as a basis for RL. Work by Prommer et al. (2006) is the most extensive study on using WOZ data for RL
86Chapter 4. The bootstrapping approach to developing Reinforcement Learning-based strategies
to date. Prommer et al. use a small amount of WOZ data (82 dialogues, 314 utterances) to build a user and error simulation for automatic strategy learning. The learned policy outperforms a hand-crafted baseline in terms of task completion and dialogue length when testing the strategy in simulation and with real users. Unfortunately, the learning framework by Prommer et al. (2006) still contains many hand-crafted aspects, which makes it hard to decide whether the success of the learned strategy indeed originated from the WOZ data. In the following sub-sections we discuss the general advantages and challenges of RL-based dialogue strategy learning when the simulated learning environment is obtained from WOZ data.
4.1.4
Advantages for learning from WOZ data
There are several advantages when learning RL-based dialogue strategies from WOZ data, which makes this approach an attractive alternative to the other approaches outlined above. First of all, the data collection in a WOZ experiment does not require a working prototype. This allows us to learn optimal strategies for domains where no working dialogue system already exists. Optimised learned strategies are then available from the first moment of online-operation, and tedious handcrafting of dialogue strategies is fully omitted. This independence from large amounts of in-domain dialogue data allows researchers to apply RL to new application areas beyond the scope of existing dialogue systems. Furthermore, WOZ data can be used to explore human strategies as a basis for automatic optimisation. For example, the state and action set for learning can then be defined based on observing human behaviour first, as also suggested by Williams and Young (2004b) and Levin and Passonneau (2006). In addition, a WOZ experiment includes a controlled experimental setup which can be designed to closely anticipate the final system setup. Subjects are also asked to fill out a questionnaire (see Section 2.5.1). In conventional system development these user ratings are analysed by an expert and used to guide the design process. Alternatively, these scores can also be utilised to learn an automatic evaluation function using the PARADISE
framework (see Section 2.2.2). In RL-based strategy development this
4.1. Introduction
87
function can then be directly used to train and test the dialogue strategy.
4.1.5
Challenges for learning from WOZ data
However, using WOZ data for RL-based strategy development also generates some challenges. In the following we discuss two problems in particular: how to learn simulated components from small data sets, and how to account for the fact that a WOZ study only simulates real Human-Computer Interaction. First of all, WOZ experiments are expensive and usually only produce small amounts of data. Thus, the bootstrapping approach requires methods to learn simulated environments from little data. In order to find methods which are “appropriate" one needs to remind oneself of the purpose of a simulated environment for strategy learning. This is usually to two-fold: On the one hand it has to provide realistic feedback to the learner. This “experience" gathered in the simulated environment is then reflected in the learned Q-function (see Section 2.4.2). On the other hand a simulated environment also needs to cover a wide state-action space in order for the learner to explore all possible situations in the dialogue. Exploration is necessary to guarantee robust strategies (see Section 2.2.4). In previous work, the simulated components of these learning environments are either hand-crafted or learned via Supervised Learning (SL). The problem when applying SL to small data set is that the resulting models often suffer from “data sparsity", which is defined as follows (Alpaydin, 2004). 1 In general, SL is learning to infer a general mappings from seen example (see Section 2.3.1). If training examples are rare, the learner tends to “overfit" the data, i.e. it adjust to very specific random features of the training data. Models which overfit do not generalise well to unseen events and are also not realistic, in a sense that they are only representing the behaviour of a small population. Thus, the major challenge when constructing simulated learning environments from small amounts of WOZ data is to construct simulated components which generate realistic and wide-coverage behaviour. 1 Note
that corpus size is not the only factor which can cause data sparsity. A corpus also need to be representative of the real distribution, which does not necessarily depend on the size.
88Chapter 4. The bootstrapping approach to developing Reinforcement Learning-based strategies
Previous work on learning simulated environments from WOZ data used hand-crafted components in combination with “low conditioned" models (Prommer et al., 2006), i.e. models which do not cover the entire policy space. For example, the bi-gram user simulation used by Prommer et al. includes a lot of zero frequencies (see Section 6.8.1.3). In Chapter 6 we will introduce appropriate methods for building and evaluating simulated components from small data sets. Another major problem in this framework is that a WOZ study only simulates real HCI. That is, a simulated environment learned from this data is a “simulation of a simulation". We thus explicitly show that the learned simulations are a sufficient estimate of real HCI by post-evaluating the the simulated environment in Chapter 8. We also show that a policy trained in this simulated environment “transfers" to real HCI, i.e. we test whether the obtained results are compatible. We do this by including an extra post-evaluation step in the general simulation-based RL framework. In sum, developing RL-based dialogue strategies from WOZ data offers a number of important advantages over previous approaches, such as learning without a working prototype, the ability to study wizard behaviour, and the availability of user ratings. The major challenges are the data sparsity problem for SL and the fact that a WOZ study only mimics real HCI. In the next Section we describe a general method which addresses these challenges.
4.2
The bootstrapping method
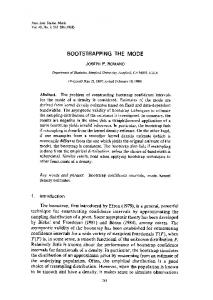
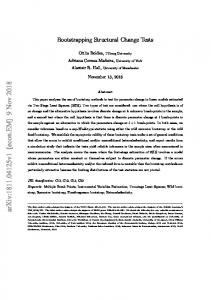
In this thesis we introduce a method to train an optimised policy from WOZ data. Note that these different steps are not unique to the method introduced in this thesis, but most of the defined steps are required for any simulation-driven approach to strategy learning (cf. (Schatzmann et al., 2006), (Pietquin, 2004), etc.). The contribution of this thesis is that all these steps are now performed starting with a limited WOZ data set, and specific methods are introduced to build and validate the obtained simulations, as we explain in the next Sections. We call this method bootstrapping, because an optimised strategy exists even before a working prototype system (see Section 4.1.2). In particular we follow a 5-step procedure (see Figure 4.2): We start by collecting data in a WOZ experiment. From this data we train and test different components of our simulated environment (such as the noise simulation and the simulated user)
4.2. The bootstrapping method
89
using Supervised Learning techniques. We then train and evaluate dialogue policies by interacting with the simulated environment using Reinforcement Learning. Once the learned policies are “good enough" we test them with real users. In addition, we introduce a final phase where we explicitly evaluate whether the models and policies obtained by bootstrapping from WOZ data are a valid estimate of real HCI (see step 5 in Figure 4.2). The next Sections provide an overview of the specific methods used in each of the steps. We also include pointers to the respective Chapters which report on these steps in more detail.
Figure 4.2: Development cycle for bootstrapping RL-based dialogue policies from WOZ data.
4.2.1
Step 1: Data collection in a Wizard-of-Oz experiment
The first step in our framework is to collect data in a WOZ experiment. In order to use WOZ data as an initial corpus for dialogue strategy learning we apply the following changes to the conventional WOZ setup (as described in Section 2.5.1).
90Chapter 4. The bootstrapping approach to developing Reinforcement Learning-based strategies
First of all, we are not only interested in the users behaviour, but also what kind of strategies human wizards would apply. That is, the wizard also becomes a subject of our study. We therefore have several different wizards participating in our study and explore “intuitive" strategies applied by the wizards. We therefore do not restrict the wizard to follow a script (as done by other WOZ experiments, e.g. (Türck, 2001; Prommer et al., 2006)), but the wizard can interact freely with the user. Based on these initial insights about human behaviour we define the state and action set for learning, following (Williams and Young, 2004b). These initial strategies should also account for noise in the interaction, as they should be suited to be applied in spoken dialogue systems (which are much more sensitive to noise). Error or uncertainty handling strategies (such as implicit or explicitly confirming what was said) are much less frequent in standard human-human communication, as we previously found in a comparative corpus study of human-human interaction (Rieser and Moore, 2005). We therefore artificially introduce simulated noise by randomly deleting words in the user transcripts before presenting it to the wizard. The application domain of the experiment are multimodal, information-seeking dialogue strategies in the MP3 domain for in-car systems (see Section 2.6). In total we collected data from 21 sessions, containing 72 dialogues with ca. 1600 turns in this setup. A detailed overview of the experiment follows in Chapter 5 (also see (Rieser et al., 2005)). Note that the experiments were conducted in the larger context of the TALK project. 2 The resulting corpus is known as the SAMMIE-23 corpus (also see (KruijffKorbayová et al., 2005b,a, 2006a,b)).
4.2.2
Step 2: Build a simulated learning environment
In the second step we use the WOZ data to construct a simulated learning environment. In particular we model the following components: The action set and state space for learning, the user and noise simulation, and the objective function for learning and evaluation. All these components are constructed using data-driven methods. 2 TALK
(Talk and Look: Tools for Ambient Linguistic Knowledge; www.talk-project. org) was funded by the EU as project No. IST-507802 within the 6th Framework program. 3 SAMMIE stands for Saarbrücken Multimodal MP3 Player Interaction Experiment.
4.2. The bootstrapping method
91
The action set and state space are retrieved by exploring the wizards’ actions. The user and noise simulations are both constructed using frequency-based approaches. The objective function is a predictive model of user ratings obtained by a regression analysis, following the
PARADISE
framework (see Section 2.2.2). Here one of the
major questions is how to construct simulations from small amounts of data, as discussed before in Section 4.1.5. More detail will be provided in Chapter 6 (also see (Rieser and Lemon, 2006c,b,a)).
4.2.3
Step 3: Train and test a strategy in simulation
In the third step of our framework, we train and test a policy by interacting with the simulated environment using Reinforcement Learning. We formulate the problem as a hierarchical Markov Decision Process (MDP) which reflects the structure of information-seeking dialogues (i.e. the information acquisition and the subsequent presentation phase). For strategy training we use the SHARSHA algorithm with linear function approximation. We test the RL-based strategy against a baseline which is constructed by using Supervised Learning (SL). This comparison allows us to measure the relative improvement of the RL-based policy over the strategies contained in the initial training corpus. The supervised baseline will be explained in Section 6.6 in more detail. The simulatedbased learning experiments will be presented in Section 6.11 (also see (Rieser and Lemon, 2008d)).
4.2.4
Step 4: Test with real users
In the fourth step of our framework the strategy is tested with real users. We therefore develop a MP3 dialogue system using a rapid development tool. The learned strategy is implemented using a table look-up between states and learned actions. In the user tests 17 subjects interact with the system, solving 2 × 6 tasks with each policy (SL and RL). At the end of each task they also fill out a questionnaire. The experiments will further be described in Chapter 7 (also see (Rieser and Lemon, 2008c)).
92Chapter 4. The bootstrapping approach to developing Reinforcement Learning-based strategies
4.2.5
Step 5: Post-evaluation and error analysis
In the final step of our framework we address the problem that a WOZ experiment itself is only a simulation of real HCI. We therefore compare different aspects of the 3 corpora gathered so far: the WOZ study, the dialogues generated in simulation, and the final user tests. We first compare dialogue strategy performance obtained in simulation with the results obtained when testing with real users. We also compare the experimental conditions of the different studies, where we discuss the noise model in particular. We furthermore explore whether the objective function used for learning is a realistic estimate of real user preferences. In addition, we conduct a detailed error analysis where we test the relationship between improved user ratings and dialogue behaviour, i.e. we investigate which factors lead the users to give higher scores, and whether this was correctly reflected in the original reward function. In Chapter 8 we will provide more detail (also see (Rieser and Lemon, 2008a)).
4.3
Summary
In sum, this Chapter introduced an motivated a 5-step procedure model to bootstrap a optimised strategy from WOZ data using Reinforcement Learning. One of the key advantages of statistical optimisation methods, such as Reinforcement Learning, for dialogue strategy design is that the problem can be formulated as a precise mathematical model which can be trained on real data. In cases where a system is designed from scratch, however, there is often no suitable in-domain data. Collecting dialogue data without a working prototype is problematic, leaving the developer with a classic chicken-and-egg problem. Different approaches have been suggested to address the problem of lacking initial training data: handcrafting the simulated components (Schatzmann et al., 2007a), online learning (Chickering and Paek, 2007), transfer policies from another domain (Lemon et al., 2006a; Lemon and Liu, 2007), and also start learning from a limited amount of WOZ data (Williams and Young, 2004b; Prommer et al., 2006). There are several advantages when learning RL-based dialogue strategies from WOZ data: no working prototype is required, one can explore human (wizards’) strategies before defining the action set and state space for learning, and it allows to gather initial
4.3. Summary
93
insights about user behaviour and user preferences for a specific (anticipated) task setup. However, using WOZ data for RL-based also generates some challenges: how to learn simulated components from small data sets (the “data sparsity problem"), and how to account for the fact that a WOZ study only simulated real Human-Computer Interaction. We therefore introduce a variant of the standard simulation-based RL framework, which especially accounts for these two problems. We also include another final setup in the framework which especially evaluates whether WOZ data can replace data from real HCI for simulation-based RL strategy learning. In particular, we introduce a 5-step procedure model including the following steps: We start with a data collection in a modified WOZ setup. In this setup the wizard also turns into a subject and channel noise is artificially introduced. We then construct a simulated learning environment from this data, where all the simulated components are constructed using data-driven methods suited for learning from small data sets. The strategy is then trained and tested by interacting with this simulated environment. We compare RL against a supervised baseline which mimics the wizards’ behaviour. This comparison allows us to measure the relative improvements over the training data. We also evaluate the strategy with real users. Finally, we post-evaluate the policy and the simulated environment by comparing the WOZ, the simulated, and the real user corpus. We also conduct a detailed error analysis. Annotated examples dialogues from the 3 different corpora can be found in Appendix B: Appendix B.1 contains dialogues from the WOZ study, Appendix B.2 simulated dialogues, and Appendix B.3 examples from the user study. 4 This Chapter presents and summarises the approach on a conceptual level, while the concrete practical realisation of the individual steps is further elaborated in the subsequent Chapters (where step 1 corresponds to Chapter 5, step 2 and 3 to Chapter 6, step 4 to Chapter 7, and step 5 to Chapter 8).
4 Note
that we will refer to these example dialogues in different chapters throughout this thesis. We therefore decided to put the example dialogues in the Appendix in order to facilitate consistent reference and allow the reader to directly compare dialogues from different corpora more easily.
Chapter 5 Data Collection in a Wizard-of-Oz experiment
Figure 5.1: An engraving of Kempelen’s chess “automaton" The Turk from Karl Gottlieb von Windisch’s 1784 book “Inanimate Reason”.
95
96
Chapter 5. Data Collection in a Wizard-of-Oz experiment
It is a common approach within the area of Artificial Intelligence to have a human being simulate the intelligent behaviour of a machine, before one is able to build a full working system. This method is used for different reasons. Either one needs to collect initial data before a system is designed, or one needs to produce more intelligent behaviour than currently possible by machines. One example for the latter is The Turk, see Figure 5, constructed and unveiled in 1770 by the Austrian-Hungarian Wolfgang von Kempelen (1734 - 1804) to impress the Empress Maria Theresa. Note that Wolfgang von Kempelen also was the first to invent Speech Synthesis (see Chapter 2). The Turk was a chess-playing machine of the late 18th century, promoted as an automaton but later proved to be a hoax (Standage, 2002). Publicly promoted as an ‘intelligent’ automaton, the Turk was in fact a mechanical illusion that allowed a human chess master to hide inside and operate the machine. With a skilled operator, the Turk won most of the games played. In this Chapter we simulate interaction between a human and a machine for the purpose of data collection. In particular, we simulate real Human-Computer Interaction (HCI) in a Wizard-of-Oz (WOZ) experiment (Fraser and Gilbert, 1991; Dahlbäck et al., 1993), which follows a similar idea as the Turk. In a WOZ experiment a human operator, the so-called “wizard", simulates partially or completely the behaviour of a dialogue system, while the user is left in the belief that s/he is operating with a real system (see Section 2.5.1). Within the context of the thesis we use WOZ data to ‘bootstrap’ a optimised presentation strategy using Reinforcement Learning (RL). Using WOZ data, as opposed to data from real HCI, allows us to study the behaviour of the human operator before specifying the system’s functionality. We therefore make several changes to the conventional WOZ setup (which is described in Section 2.5.1). First of all, we are interested in the actions a human wizard intuitively employs in a specific context. We therefore do not restrict the wizards by a script (as done by other WOZ experiments, e.g. Türck (2001); Prommer et al. (2006)), but the wizards can interact freely with the user (see Section 5.1). In addition, the wizard only “sees what the system sees", i.e. features which are available for decision making at system runtime. In particular we simulate channel noise, as introduced by Automatic Speech Recognition, as described in Section 5.2. Furthermore, we convert the data into a special data format, which facilitates analysis and annotation, as described in Section 5.3. Finally, we analyse the quality of the employed strategies, as described in Section 5.4.
5.1. Experimental setup
97
The experiments described in the following chapter were conducted in the larger context of the
TALK
project.
1
The resulting corpus is known as the
SAMMIE -22
corpus.
5.1
Experimental setup
The experimental setup for a WOZ study should resemble the intended application domain as closely as possible. In our case, we simulate a multimodal in-car dialogue systems for interactive search in a MP3 database (see Section 2.6.3). In the following we describe some of the details of the experiment. Different aspects of the experiment are also described in Kruijff-Korbayová et al. (2005a); Rieser et al. (2005); Becker et al. (2004); Korthauer et al. (2006).
Figure 5.2: Multimodal Wizard-of-Oz data collection setup for an in-car music player application, using the Lane Change driving simulator. Top right: User, Top left: Wizard, Bottom: transcribers.
The experimental setup is shown schematically in Figure 5.2. There are five people involved in each session of the experiment: an experiment leader (not shown), two transcribers, a user and a wizard. The interactions were carried out in German. 3 The wizards play the role of an intelligent interface to an MP3 player and are given access 1 TALK
(Talk and Look: Tools for Ambient Linguistic Knowledge; www.talk-project. org) was funded by the EU as project No. IST-507802 within the 6th Framework program. 2 SAMMIE stands for Saarbrücken Multimodal MP3 Player Interaction Experiment. 3 However, most of the titles and artist names in the music database are in English.
98
Chapter 5. Data Collection in a Wizard-of-Oz experiment
Figure 5.3: Screenshot from the FreeDB-based database application, as seen by the wizard.
5.1. Experimental setup
99
to a database of music information (but not actual music) of more than 150,000 music albums (almost 1 million songs), extracted from the FreeDB database. 4 Figure 5.3 shows an example screen shot of the music database as it is presented to the wizard. The database also returns partial matches, e.g. if the wizard searches for ‘Subterranean Homesick’ the song ‘Subterranean Homesick Alien’ by Radiohead as well as the the song ‘Subterranean Homesick Blues’ by Bob Dylan are retrieved. The users are given a set of predefined tasks and are told to accomplish them by using a MP3 player with a multimodal interface (as further described in Section 5.1.2). In a part of the session the users also get a primary driving task, using the Lane Change driving simulator (Mattes, 2003) in order to resemble the in-car eyes-busy driving situation (see Section 2.6.3). The wizards can speak freely and display the search results or playlists on the screen. The users can also speak, as well as making selections on the screen. The user’s utterances are immediately transcribed by a typist and are also recorded. The transcription is then presented to the wizard. This was done in order to deprive the wizards of information encoded in the intonation of utterances (as in current dialogue systems), and in order to be able to corrupt the user input in a controlled way, simulating understanding problems at the acoustic level (as further described in Section 5.2). The wizard’s utterances are also transcribed (and recorded) and presented to the user using the speech synthesiser system Mary. 5 The transcription is also supported by a typing and spelling correction module to minimise speech synthesis errors and thus help maintain the illusion of a working system. Since it would be impossible for the wizard to construct layouts for screen output on the fly, s/he gets support for his task from the WOZ system: The system automatically computes four possible screens, as shown in Figure 5.4. The wizard can chose one of the offered options to display to the user, or decide to clear the user’s screen. Otherwise, the user’s screen remains unchanged. It is therefore up to the wizard to decide whether to use speech only, display only, or to combine speech and display. The types of screen output are (i) a simple text-message conveying how many results were found, (ii) output of a list of just the names (of albums, songs or artists) with the corresponding number of matches (for songs) or length (for albums),(iii) a table of the complete search results, and (iv) a table of the complete search results, but only 4 Freely 5 The
2008)
available at http://www.freedb.org/ (22. April 2008) Mary system for German TTS is available at http://mary.dfki.de/ (22. April
100
Chapter 5. Data Collection in a Wizard-of-Oz experiment
Figure 5.4: Screenshot from the display presentation tool offering options for screen output to the wizard for second-level of choice what to display an how.
5.1. Experimental setup
101
displaying a subset of columns. These four screens are presented to the wizard in different quadrants on a monitor (cf. Figure 5.4), allowing for selection with a simple mouse click. This setup is technically realised using the Open Agent Architecture (OAA) (Cheyer and Martin, 2001), which is a framework for integrating a community of software agents in a distributed environment. Each system module is encapsulated by an OAA wrapper to form an OAA agent, which is able to communicate with the OAA community. The experimental system consists of 12 agents, all of them written in Java.
5.1.1
Recruited subjects: wizards and users
In our study we are interested in the behaviour of two types of subjects: users and wizards. We recruited 5 wizards (2 female, 3 male)
6
in total, all native speakers
of German with good English skills (in order to understand and search for English titles), all between 20 and 35 years old, and all had no prior experience with language technology or dialogue systems. Each wizard contributed about equal portions to the corpus (16.4 − 25.4%). In addition we recruited 21 user subjects (11 female, 10 male). Most of them are between 20-30 years old (66.7%) and their field of study is equally spread between subject areas (social science: 23.8%, languages: 23.8%, natural science: 28.6%, arts: 17.1%). Each subject received a compensation of 15.- e. The wizards were paid per hour.
5.1.2
Experimental procedure and task design
The experiment proceeds as follows. First the wizard are trained to use the database interface and they are also given general instructions about how to interact with the user (see Appendix A.1). For example, that they should avoid to rely on their own music knowledge, but rather ask the user for missing values. User and wizard are placed in separate rooms. When the user arrives s/he also first receives a sheet of instructions to read through (see Appendix A.2). Then s/he is introduced to the driving 6 Originally
we had 6 wizards performing the task. Due to data loss caused by technical failure, complete data only exists for 5 of our 6 wizards.
102
Chapter 5. Data Collection in a Wizard-of-Oz experiment
simulator and has to perform a short test drive. The users solve two sets of tasks with two tasks each. The task description is handed out on separate board cards, one for each task, so that the user can decide to solve the tasks in any preferred order. After each task the user fills out a task specific questionnaire, where the user indicates perceived task success and task satisfaction on a 5-point Likert Scale. The first task set is performed without driving. For each task set the user has a time limit of 15 minutes to solve the two contained tasks. When the time is over, the experiment leader stops the interaction and asks the user to start with the other task set, where s/he now has to operate the driving simulator in parallel. In the end the user is interviewed by the experiment leader following a questionnaire (as further described in Section 5.4.2). We designed 10 task sets in total. Every task set was used at least twice, and the wizard never got the same task twice. Each task set contains 4 tasks of 2 different types. One task type asks the user to search for a specific title or album, the other one asks the user to build a playlist which has to satisfy a number of constraints (see examples in Appendix A.3). The tasks are paired into 2 compatible sets, containing one task of each task type.
5.2 5.2.1
Noise simulation Related work
One major difference between real HCI and WOZ experiments is that the wizard usually has full understanding of the user’s utterance, whereas the interaction with a real dialogue system is affected by channel noise (see Section 2.5.1). Hence, recent work has suggested to introduce artificial noise in the WOZ setup in order to get a closer estimate of real HCI. Skantze (2003, 2005) was the first to introduce channel noise in a WOZ setup. He uses a real ASR system to study different error handling strategies as applied by the wizards. Stuttle et al. (2004); Williams and Young (2004a) follow this method, but simulate ASR errors in order to control the error rate and thus to be able to investigate how the wizards adapt to different levels of noise. Results by Williams and Young (2004a) show that even with high WER conditions the wizards are able to parse ASR output well and assimilate contextual knowledge about what user actions are likely
5.2. Noise simulation
103
to follow. Such abilities are currently unrealistic for spoken dialogue systems (but see Gabsdil and Lemon (2004)). In order to prevent the wizard from using too much contextual knowledge, we deleted parts of the user’s input completely, as described in the following.
5.2.2
Method
To approximate speech recognition errors we used a tool that randomly “deletes” parts of the transcribed utterances. Due to the fact that humans are able to make sense of even heavily corrupted input, this method not only covers non-understandings, but wizards also built up their own hypotheses about what the user really said, which can lead to misunderstandings. The word deletion rate varied: 20% of the utterances were weakly corrupted (= deletion rate of 20%), and 20% were strongly corrupted (= deletion rate of 50%). In 60% of the cases the wizard saw the transcribed speech uncorrupted. Example 5.1 illustrates the kind of corrupted utterances the wizard had to deal with. (5.1) uncorrupted: Zu dieser Liste bitte Track ’Tonight’ hinzufügen. [ Add track ’Tonight’ to this list.] weakly corrupted: Zu dieser Liste bitte Track Tonight . . . . [. . . track ‘Tonight’ to this list.] strongly corrupted: Zu . . . Track Tonight . . . . [. . . track ‘Tonight’ to . . . .]
5.2.3
Results and Discussion
Altogether, only 30% of the corrupted utterances had a noticeable effect on the interaction, i.e. the wizard did indicate some problem with understanding what was said (see corpus-based example in Appendix B.1, Table B.2). The non-understanding and misunderstandings are manually annotated as described in (Blaylock et al., 2006). In total 7% of all the user turns lead to a communication error, which is much lower than the current WER for spoken dialogue systems, where error rates are around 30% (see Chapter 6.7). On the other hand, the error rate is higher than for human-human communication. For example, when people talk over a telephone line only 1.5% of
104
Chapter 5. Data Collection in a Wizard-of-Oz experiment
all utterances are followed by an acoustic communication error (Rieser and Moore, 2005). In contrast to real ASR errors, our deletion method has the potential to elicit the most ‘natural’ behaviour from the wizards. Complete deletions are similar to transient noise, whereas substitutions and insertions as introduced by ASR (see Chapter 6.7) normally won’t happen in human-human communication. Therefore our method is better suited to study natural ways of dealing with noise. A major drawback of our method is the time delay introduced by transcribing the utterances (the user as well as the wizard utterance). On average, the user has to wait 6.7(±5.2) seconds for the wizard to reply. Most of the wizards reported that they adjusted their behaviour. For example, they would omit some questions in order to speed up the dialogue. On the other hand, it seemed that the slow interaction pace made the users believe in the illusion of interacting with a real system. 7 An alternative method for inserting deletions was later introduced by Schlangen and Fernandez (2007). Schlangen and Fernandez distort the acoustic signal by using white noise. While this method is less time (and cost) intensive, they do not prevent the wizard from using intonation – a feature which usually is not accessible for real HCI. Schlangen and Fernandez report similar results, where 71% of noise events did not have an noticeable effect. In sum, our results indicate that the applied method still does not prevent the wizards from using contextual knowledge to parse corrupted user input. Thus, too many utterances are correctly understood compared to real HCI. As such, this method is not suited to study detailed error handling. However, this method can be sufficient in order to study natural presentation strategies under the presence of noise, as we show in Chapters 6,7,8.
5.3
Corpus description
In total we gathered 21 sessions, containing 72 dialogues with ca. 1600 turns in this setup. Example dialogues can be found in Appendix B.1. The data for each session consists of a video and audio recording, the questionnaire data, transcripts, and a 7 Unfortunately we failed to include a question in the questionnaire asking the user explicitly
whether s/he believed that she interacted with a real system.
5.4. Analysis
105
log file. The gathered logging information per session consists of OAA messages in chronological order, each marked by a timestamp. The log files contain various information, e.g., the transcriptions of the spoken utterances, the wizard’s database query and the number of results, the screen option chosen by the wizard, etc. In addition, the speech data is manually transcribed using the Transcriber Tool. 8 The corpus is marked-up and annotated using the Nite XML Toolkit (NXT) (Carletta et al., 2005). The NXT format allows multi-layered annotation, where each layer is annotated independently, but subsequent investigations can involve exploration and automatic processing of the integrated data across layers. In addition, NXT comes with a library of routines to build interfaces for manual annotation tasks, based on JAVA Swing.
We created the NXT-based corpus in several steps: First we automatically
converted the transcriptions and information from the log files. Then, we added various features using a mixture of manual and (semi-)automatic annotation techniques (cf. Kruijff-Korbayová et al. (2006b,a)). For example, we manually annotated Clarification Requests (CRs), as described in Chapter 6.3. We therefore created several annotation tools, based on the NXT core library to facilitate complex manual annotation tasks (see Figure 5.3 for CR annotation). In addition, we also manually annotated task success as described in Blaylock et al. (2006). Task success is calculated as the percentage of information slots defined by the task and the information slots filled and confirmed during the interaction. Furthermore, we annotated many contextual dialogue features, as further described in Section 6.4. Many of them are automatically annotated using NXT indexing (Carletta et al., 2005).
5.4
Analysis
In the following we present the results of the corpus analysis for multimodal presentation strategies. We first give a qualitative analysis of the wizards’ and users’ behaviour. We then summarise the results from the user questionnaire. 8 http://trans.sourceforge.net/
(22. April 2008)
106
Chapter 5. Data Collection in a Wizard-of-Oz experiment
Figure 5.5: NXT-based tool for annotating Clarification Requests
5.4.1
Qualitative analysis
In this Section we describe the multimodal behaviour of the dialogue participants in more detail. A detailed analysis of the frequencies of annotated wizards’ actions can be found in Section 6.3. An analysis of the annotated user’s actions can be found in Section 6.8. In this Section we are especially interested in the presentation strategies applied by the wizards. Overall, the wizards choose to present a screen output in 48.0% of all the wizard turns. The table option is presented most frequently (78.6%). The option to present a list is chosen less frequently (17.5%), and the option to present text only is hardly ever used (0.04%). The presented lists and tables contain 167.9(±177.7) items on average, with the maximum number of 1711 items (see Example 5.2) and the minimum of 1 item displayed on the screen. For multimodal presentation the wizards commonly name the number of results while displaying the chosen screen output, e.g. “The song is retrieved. There are 142 different versions.” (see Appendix B.1, Table B.1). 9 9 Note
that the database used in the WOZ experiments contained over a million songs and
5.4. Analysis
107
(5.2) User: Please search for music by Madonna . Wizard: I found seventeen hundred and eleven items. The items are displayed on the screen. [displays list] User: Please select ‘Secret’. For verbal presentation the wizards only present 1.6(±.45) items on average, with a maximum of 3 items verbally enumerated. A common pattern observed for verbal presentation is that the wizard summarised the results by presenting the options for most distinctive feature to the user, e.g. “ The song exists by ‘Eric Clapton’ or by ‘Derek & the Dominos’.” (see Appendix B.1, Table B.1). Overall, the tasks are solved with 87.6%(±25.14) task success. One dialogue takes on average 14.5(±8.8) turns. A turn is defined is defined as in Paek and Chickering (2005): it begins at the start of each new user action (since all system actions respond to user actions). A user action can be an utterance, or a click (i.e. the user selected an item on the screen). As we want to use the data for learning, it is important to know whether the individual wizards applied significantly different strategies. We therefore apply a one-way ANOVA followed by a planned comparison in order to compare the mean value of different dialogue performance features across wizards. Dialogue length only varies slightly across wizards (F(4) = 2.84, p = .04). Wizards also present about the same amount of information on the screen (F(4) = .76, p = .55). Most of the wizards are equally successful in completing the tasks. Only wizard 4 was significantly better (p < .001) than wizard 2, as wizard 4 completes all the tasks with 100% task success whereas wizard 2 only compeltes the tasks with 78.4% success rate. Overall, one can say that all the wizards apply similar strategies with respect to average measures. Note, that this does not mean that wizards reacted the same way in a specific dialogue context. The users’ multimodal behaviour is very limited. Only 3 users selected an item on the screen by clicking. We only observe 11 clicking events in total. However, the user verbally referred to the displayed list on average 0.5(±.96) times per dialogue. is searched with partial string match. Therefore the retrieved items for ‘Layla’ can be as high as 142.
108
5.4.2
Chapter 5. Data Collection in a Wizard-of-Oz experiment
Subjective ratings from the user questionnaires
At the end of the interaction the user is interviewed using a questionnaire (see Appendix A.4). Filling out the questionnaire in an interview has the advantage that the questions can be explained to the user. The questionnaire contains 28 questions in total, many of them targeted to different research questions within the
TALK
project. We are
interested in the questions targeting User Satisfaction as defined by PARADISE (see Section 2.2.2) (questions 1,2,6,8,12,13,15,16,24,28) and the multimodal presentation strategy (questions 14,18,19,20,21, 22). The results for the mean
PARADISE
user ratings are displayed in Figure 5.6. ASR
performance is rated highest with 3.9(±.4) points on a 5-point Likert Scale. Expected Behaviour and Interaction Pace are rated worst with 1.8(±.6) due to the time delay introduced by transcribing. The other ratings are between 2 and 3 points which is about average on the 5-point scale. In order to compare the performance to other systems we calculated the overall user satisfaction as the sum of five core metrics (TTS performance, Task Ease, User Expertise, Expected Behaviour, and Future Use) following (Walker et al., 2002a). 10 The mean for user satisfaction across all dialogues is 15(±2.9). Walker et al. report an average user satisfaction of 16.2 for 9 Communicator systems. These results indicate that the performance of our human wizards is perceived to have a comparable quality to current dialogue systems. To measure task experience we elicit data on perceived task success and satisfaction on a 5-point Likert scale after each task was completed (as described before in Section 5.1.2). Subjects rate both measures above average: the mean perceived task success is 3.4 ± .8) and the mean perceived task satisfaction is 3.8(±.8). These high ratings indicate that the WOZ ‘system’ is perceived to be very usable in general, and the users are under the impression that they are able to accomplish most of their tasks. The mean user ratings for the multimodal presentation strategy are shown in Figure 5.7. Multi-modal presentation strategies are perceived to be helpful in general, having a mean of 3.1(±1.7) for switching between different modes within one dialogue and a mean of 2.9(±1.2) for combining different modes within one dialogue on a 5-point Likert scale. 10 Note
that Hone and Graham (2000) criticise that taking the sum of different dimensions produces meaningless results. We therefore only use this measure to compare our results to other systems, and not engaging in the discussion of the interpretation of this score.
5.4. Analysis
109
Figure 5.6: User Ratings on the PARADISE questions on a 5-point Likert Scale
Figure 5.7: User Ratings on the multimodal presentation questions on a 5-point Likert Scale
110
Chapter 5. Data Collection in a Wizard-of-Oz experiment
However, the subjects report that too much information is being displayed, especially for the tasks with driving. Users also find that the interaction distracted them from driving (see Figure 5.7 ‘cognitive load’, note that the scale is reversed). 85.7% of the subjects report that the screen output (sometimes) distracted them. The amount of information presented on the screen is rated low with a mean of 2.2(±.8) (see Figure 5.7, ‘multimodal info’). 76.2% of the subjects would prefer to more verbal feedback, especially while driving. The amount of information presented verbally is rated as being appropriate (mean of 2.9 ± 1.0). In sum, the user ratings indicate that multimodal presentation was only perceived to be appropriate in a certain context and screen outputs should only contain an ‘appropriate’ amount of information. In other words, we need to find a strategy which decides on how many database search result to present to the user, and when to present them, and which modality to use for presentation, in a context dependent ‘optimal’ manner. Finally, we are interested in whether there are significant differences in how the different wizards are rated by the users. We need this information in order to decide which data to use for the learning experiments, i.e. wizards performing significantly worse might be excluded. We therefore perform a Kruskal-Wallis Test (the nonparametric equivalent to a one-way ANOVA) for all the subjective measures listed above (PARADISE, multimodal, and task related questions). None of the performed tests showed significant results, which shows that all the wizards are rated as equally good. Therefore we can use all the data for our learning experiments described in the next Chapter 6.
5.5
Summary and Discussion
The analysis of the WOZ data shows that the users perceive the wizards’ behaviour to be sub-optimal. Especially, the amount of multimodal information as displayed on the screen is often perceived to be inappropriately large. For example, the wizards choose to show up to 633 items on the screen. On the other hand, user prefer strategies which are short and efficient. We therefore need to find a policy which addresses the problem of how many database search results to present to the user, and when to present them, and which modality to use for presentation, given the competing trade-offs between the number of results (large lists are difficult for users to process especially when
5.5. Summary and Discussion
111
only presented verbally), the length of the dialogue (long dialogues are tiring, but collecting more information can result in more precise results). In order to obtain this policy we will optimise presentation strategies with respect to user preferences, using simulation-based Reinforcement Learning, as described in the next Chapter 6. We obtain this simulation using all the WOZ data, as our results indicate that there is no significant difference in wizard performance and mean behaviour. Given our small data set, we apply the following simplification for strategy learning: We do not distinguish between different types of screen outputs (i.e. the 4 output options available to the wizards cf. Figure 5.4), but only use the table as the only multimodal option available (as this was the one chosen most frequently by the wizards). For the learning experiments we simplify the decision to verbal vs. multimodal presentation. The option that the wizard only present a screen output without verbal commentary did not occur in the data (as we will show in Section 6.3). A short-coming of the WOZ setup described in this Chapter is that the questionnaire is only taken at the very end of the experiment. User ratings only exist for the whole interaction, including driving and non-driving scenarios. Thus, the obtained user ratings do not distinguish between the condition for driving and not driving. On the other hand, it seems to be the case that wizards seem not to pay attention to the fact whether the user is driving when choosing their presentation strategy. Only 2 of our 5 wizards reported that they (sometimes) took into account whether the user was driving or not when presenting search results. Another short-coming is that we do not log information about the users’ driving performance. Other work chooses ‘cognitive load’ as the measure to be minimised by in-car dialogue strategies, e.g. (Wada et al., 2001; Kun et al., 2007). We consider learning presentation strategies which optimise driving performance as an interesting direction for future work. Another direction for future work is to create a WOZ setup which is more realistic with respect to the final application. In this WOZ study the components for multimodal presentation do not resemble a real car environment. For example, the screen used to display the results has the size of a standard computer screen, whereas for an in-car dialogue the available screen size usually is much smaller. Furthermore, in the current experiments the user has to select the items with a mouse click, which is rather difficult when driving (in fact, only 3 users used the mouse, see Section 5.4.1). However, in
112
Chapter 5. Data Collection in a Wizard-of-Oz experiment
this thesis we assume that the conditions of the WOZ experiments closely correspond to the conditions of the final application. In the next Chapter we use the WOZ data to ‘bootstrap’ different aspects of the simulated learning environment for RL-based strategy development.
Chapter 6 Building a simulated learning environment from Wizard-of-Oz data
Figure 6.1: Wooden mechanical horse simulator during World War I – Learning with simulated environments.
113
114
6.1
Chapter 6. Building a simulated learning environment from Wizard-of-Oz data
Introduction
Chapter 6 describes a framework for training and testing a RL-based policy in simulation, where the simulated environment is obtained from limited amounts of Wizard-ofOz (WOZ) data.
6.1.1
Dialogue strategy learning with simulated environments
Why do we need simulated interaction? In general, a simulation is an imitation of some real thing, state of affairs, or process. Learning in simulation allows the exploration of various strategies in a “cheap" environment where trying different things out has a low risk. For example, during World War I soldiers were trained with a physical simulation of a horse, see Figure 6; whereas nowadays soldiers are trained with virtual environments, e.g. (Traum et al., 2008). The same is true for dialogue strategy optimisation using Reinforcement Learning (RL). Instead of having real users interacting with the system we let the system “practise" in a “low risk" simulated environment until it is skilful enough to interact with real users. RL-based strategy design is based on exploratory trial-and-error learning methods (see Chapter 2.4). In exploratory trial-and-error learning the learning agent may also explore polices which do not make sense to real users. Thus, exploratory trial-anderror learning with real users is a time-consuming and sadistic procedure, where real users easily get irritated and frustrated. (For an exhaustive discussion on advantages and disadvantages of simulation-based RL please see Chapter 2.4.3.) The quality of the learned strategy depends on the quality of the simulation in the sense that the strategy learns by interaction with the simulated environment, as results by (Schatzmann et al., 2005b) do indicate. Thus, building simulated environments for dialogue policy learning has become a field of research in its own right, e.g. (Schatzmann et al., 2006), (Pietquin and Dutoit, 2006b), (Georgila et al., 2006b), (Rieser and Lemon, 2006a), (Ai et al., 2007b) etc. Some of the research issues for simulation-based dialogue strategy learning are summarised in the following. First of all, there is no agreed definition of what a “simulated environment" really is. For example, it is not clear where to exactly draw the boundary between the RL agent
6.1. Introduction
115
and the learning environment. (Sutton and Barto, 1998) give the general guideline that “anything that cannot be changed arbitrarily by the agent is considered to be outside of it and thus part of its environment" (Sutton and Barto, 1998, p.53). Given this definition we take everything but the learning mechanism itself to be part of the environment. Furthermore, there is no general agreement of what components to include in the simulated environment. At least, a simulated user is needed for simulation-based dialogue strategy learning. Some work also includes a noise simulation which models errors as introduced by ASR, e.g. (Pietquin and Dutoit, 2006b), while other work ignored the error channel altogether, e.g. Levin et al. (2000); Schatzmann et al. (2007c). In general, it depends on the application domain of the strategy which dialogue components are required. In addition, it is also not clear how to obtain these simulated learning environments. Most of previous work uses a mixture between components which are data driven (especially the user simulation is often obtained from data), and components which are handcrafted (especially the reward function often is set manually). Different methods are used for different components. We will discuss them individually in the respective Sections of this Chapter. The data-driven methods used in general fall into the category of Supervised Learning (SL). We don’t think of handcrafting to be a valid option, as the resulting components are rather unlikely to reflect the application domain correctly, as discussed in Section 4.1. We suggest to learn supervised models from WOZ data, and we identified the following challenges: • how to obtain reliable models from a small data set, and • whether models obtained from simulated HCI are reliable estimates of real dialogue interaction. In the next Section we discuss the following related issues: we first discuss the question of “how much data is enough?" to obtain simulations for dialogue strategy learning. We then discuss different techniques used to evaluate simulated components. We also show how available corpus size, simulation technique, and evaluation are closely interleaved problems.
116
Chapter 6. Building a simulated learning environment from Wizard-of-Oz data
6.1.2
Method and related work
How much data is enough to build a simulated environment to train RL-based dialogue strategies? Different techniques have been used to assess the needed data quantity when learning RL strategies from fixed data sets (see Chapter 2.3.4). For example, people report on how many times a state was visited during training, e.g. (Singh et al., 2002; Spitters et al., 2007; Henderson et al., 2008); measure whether obtained V-values converge (Tetreault and Litman, 2006); or measure the confidence interval for the learned transition function (Tetreault et al., 2007). Also see discussion in Section 2.3.4. For simulation-based learning, however, no such measure exists as one assumes that for RL the simulated environment can produce an infinite amount of training data. Here the question is how much data is enough to build simulated components using data-driven techniques. In general, SL is less “data-hungry" than RL, but still some initial data is needed. 1 Prior work has trained different types of supervised models on corpora of different quantity. Schatzmann et al. (2005b) and Georgila et al. (2006b) for example build user simulations from richly annotated dialogues from the COMMUNICATOR corpus (Walker et al., 2002b). Georgila et al. (2006b) utilise 1683 annotated dialogues; Schatzmann et al. (2005b) utilise a subset of 697 dialogues. They both use different SL techniques (such as n-gram modelling), where they show that more complex models outperform simpler ones. For evaluation they choose different metrics like the (expected) accuracy, recall and precision. Other work has used much smaller corpora to train their simulated models. Prommer et al. (2006), for example, learn from limited data (82 dialogues, 314 utterances). They produce simulations which are “sufficiently accurate". Unfortunately, their simulated learning environment also includes a lot of hand-crafted aspects. And the user models are what they call “low conditioned" as they also contain several states with zero frequencies (as we will further discuss in Section 6.8.1.3). 1 However,
for SL “There is no data like more data" (a quote attributed to Bob Mercer, former researcher of the IBM speech group). More data always helps supervised models to become more accurate and robust, as results by (Banko and Brill, 2001) indicate.
6.1. Introduction
117
However, there is also recent work that shows the limitations of learning from small data sets. Results by Ai et al. (2007b) indicate that user simulations learned from a small data set (130 dialogues) can fail to provide enough coverage in the strategy training phase. And in fact, random models might even be superior (as we will further discuss in Section 6.8.1). Taken together, there is no fixed threshold or standard recommendation for how much data is enough. The required data size also depends on the complexity of the problem we try to learn and the required accuracy – a fact which is described as the “triple trade-off problem" for SL (Dietterrich, 2003). Thus, in order to choose methods for building simulations, we first address the question about the “required accuracy". A number of different metrics have been suggested for evaluating different simulated components (see Table 6.1 for an overview). In general, the applied metrics assess two main objectives: accuracy towards the initial data set, or its utility for policy learning. Schatzmann et al. (2006) call this distinction direct vs. indirect evaluation. However, by measuring the accuracy towards the initial data we assume that there is a large and representative enough data set which allows to learn realistic behaviour. Furthermore, measuring the utility has the draw-back that we only know about the quality of the simulations after we have trained the policy, and it would be beneficial to have an estimate even before training. So, what is an objective function suited to build and test simulated environments? In Section 4.1.5 we defined the purpose of simulated learning environments to provide realistic feedback to the learner, while covering all the state-action spaces that need to be explored. Thus, random models, as suggested by Ai et al. (2007b) are not an option, as they do not give realistic feedback. Models with zero frequencies, as used by Prommer et al. (2006) are also not an option as they don’t cover all the possible state-action spaces. Furthermore, models which overfit the data (see definition Section 4.1.5) are also unlikely to produce behaviour which is representative and general enough. Overfitting is especially problematic when learning from small data sets (Alpaydin, 2004). Thus, we define our overall objective for building simulated components from small data sets as to meet the trade-off between facilitating coverage, while providing realistic feedback, and being general enough to not overfit the data.
118
Chapter 6. Building a simulated learning environment from Wizard-of-Oz data
Evaluation
DIRECT
INDIRECT
error model:
• similarity of generated user utterances
• policy performance in simulation
between simulated and real (initial) cor-
(Pietquin and Beaufort, 2005;
pus (Schatzmann et al., 2007b)
Pietquin and Dutoit, 2006a)
user simulation:
• (expected) accuracy, recall, and preci-
• policy performance in simulation
sion with respect to the user population
(Schatzmann et al., 2005b), (Ai
in the initial data set (Schatzmann et al.,
et al., 2007b), (Lemon and Liu,
2005a), (Georgila et al., 2006b).
2007)
• perplexity (Georgila et al., 2005a) • ‘high-level’ comparison of generated and real corpora (Scheffler and Young, 2001), (Schatzmann et al., 2005a), (Ai and Litman, 2006). • HMM similarity of real and generated dialogues (Cuayáhuitl et al., 2005). • Cramér-von
Mises
divergence
(Williams, 2007) reward function:
• goodness-of-fit (Möller et al., 2007), (Ai and Litman, 2007).
• prediction performance (Walker et al., 2000), (Engelbrecht and Möller, 2007).
whole
sim.
environment:
• transferability of policy performance when testing with real users (Lemon et al., 2006a)
Table 6.1: Utilised evaluation metrics for different simulated components used for RL-based strategy learning
6.1. Introduction
119
In addition, we need to take into account that simulated environments are used in two different contexts: on the one hand they are used for strategy training, and on the other hand they are used for strategy testing. We argue that for strategy training it is more important that the simulated environments guarantees enough coverage, while for testing it is more important that the simulated environment is more realistic. Furthermore, the evaluation should also account for the fact that the simulations are learned from WOZ data. We therefore introduce three separate evaluation phases to assure the quality of our simulated components: 1. We directly evaluate each single component when learning them form WOZ data (as described in the rest of this Chapter). 2. We indirectly evaluate the simulated learning environment (as a whole) when testing strategy performance (as described in Section 6.11 and Chapter 7). 3. We post-evaluate single components as well as the whole simulated environment by comparing dialogue generated in simulation with dialogues obtained with real users (as described in Chapter 8).
6.1.3
Outline
This Chapter describes a framework for training and testing a RL-based policy in simulation, where the simulated environment is obtained from limited amounts of WOZ data. We learn an optimised policy addressing the complex and challenging problem of how many database search results to present to the user, and when to present them, and which modality to use for presentation, given the competing trade-offs between the number of results (large lists are difficult for users to process especially when only presented verbally), the length of the dialogue (long dialogues are tiring, but collecting more information can result in more precise results), and the noise in the speech recognition environment (in high noise conditions accurate information is difficult to obtain). 2 We therefore obtain a simulated learning environment from WOZ data, where all the simulated components are constructed in a data-driven manner. In particular, we create 2 Note
that here we extend the problem addressed in Chapter 3, in a sense that we also address the question of which output modality to choose for generation. We see this a first step towards optimising output strategies for Natural Language Generation.
120
Chapter 6. Building a simulated learning environment from Wizard-of-Oz data
the action set by exploring the actions taken by the wizards, as described in Section 6.3. We use automatic feature selection techniques in order to define the state space, as described in Section 6.4. We then formulate the problem as an hierarchical Markov Decision Process (MDP), as explained in Section 6.5. In Section 6.6 we describe the baseline strategy obtained via Supervised Learning. In Section 6.7 we present a method for simulating channel noise if training data is sparse. In Section 6.8 we also introduce methods to build and evaluate user simulation from small data sets. The applied reward function is obtained using a modified version of the PARADISE framework, as described in Section 6.9. In Section 6.10 we explain how and why some parts of the state space need to be quantised. In Section 6.11 we test and present the learned optimised policy, and we conclude in Section 6.12. In the next Section we describe the employed database.
6.2
Database description
We learn a strategy for a specific application environment with one fixed database. (In contrast to Chapter 3 where we provided a general proof-of-concept by simulating various kinds of database retrieval.) The employed database is similar in ambiguity and structure to the one used in the WOZ experiment, but is smaller in size. Ideally, one would use the same database, however, the WOZ database contains over one million songs, which is (currently) unrealistic for a Spoken Dialogue System, as the lexicon for ASR and language modelling would exceed current system capabilities. Furthermore, the WOZ database contains many German names and titles, and the language of the implemented system is English.
3
However, the created database
contains a high level of ambiguity, which is comparable to the ambiguity in the WOZ database. In other words, the returned number of matching items for an ambiguous user request stays about the same for both experiments. The created database contains 3 genres, 10 artists, and 36 albums and 438 songs. The database contains ambiguities of two different types: semantic and referential. For learning we deal with the latter. With ‘referential’ ambiguity we mean ambiguity which is caused by under-specification of the user’s goal. For example, if the user asks 3 This
switch of languages is simply because the WOZ tests are conducted at Saarland University in Germany, whereas the user tests are performed at Edinburgh University in the UK.
6.3. Action set selection
121
for a Blues song, there are 142 possible candidates. Referential ambiguity exists for every database feature (genre, artist, album, and song title). For example, here are 60 song names which are ambiguous between different artists or albums (6 of them being triply ambiguous and 1 song title is quadruple ambiguous), plus ambiguities which arise if the user only specifies partial information (or only a few words are being recognised). For example, if the system only recognises the first two words of ‘Subterranean Homesick Alien’ by Radiohead, the song ‘Subterranean Homesick Blues’ by Bob Dylan is returned as well. With ‘semantic’ ambiguity we refer to parsing ambiguities, where an entity can specify an album name or a song name (e.g. ‘Kid A’ is a song title as well as an album title by the artist Radiohead). Semantic ambiguities can also result from partial parses, for example, when a string is part of two different database categories, such as a song title referring to the artist (e.g. ‘Bob Dylan’s Blues’) or an album name referring to the artist (e.g. ‘The Freewheelin’ Bob Dylan’). In this thesis semantic ambiguities are resolved using hand-coded strategies. Every time more than one possible interpretation is returned from the parser the system engages in a clarification dialogue listing all the possible interpretations (e.g. “Do you mean album or song name?").
6.3 6.3.1
Action set selection Method and related work
The action set defines the set of possible choices available to the learner at each state (see Chapter 2.4.1). Conventionally, the action space is predefined by the system the training data is taken from. Previous research either only optimise a sub-set of this predefined scope, e.g. (Singh et al., 2002; Walker, 2000), or optimise all actions available to the system, e.g. (Henderson et al., 2008). In this thesis, however, we use WOZ data where the wizards talk freely, i.e. they are not constrained by a script but react intuitively. Hence, we are not limited to a predefined set of actions, but we are able to study human behaviour first, before we fix the system’s functionality (a method which is also suggested by Williams and Young (2004b) and Levin and Passonneau (2006) ). This approach also provides the advantage that it allows us to discover new action choices for system design. For
122
Chapter 6. Building a simulated learning environment from Wizard-of-Oz data
error handling and clarification, for example, humans employ a much wider range of strategies than current systems do (Rieser and Moore, 2005). We therefore hope to gain insight about natural ways to seek and present information for dialogue systems from WOZ data. In particular, we are interested in the kind of information acquisition and multimodal presentation strategies human wizards (intuitively) apply. We use manual annotation in order to discover the action set from WOZ data, following a method by (Williams and Young, 2004b). One challenge is here to find an adequate level of abstraction in order to describe the wizards’ actions as a set of speech acts (SAs). On the one hand the SA taxonomy should cover the complexity of human behaviour. On the other hand, it should be simple enough to learn from a small data set. In the following we propose a multilayered and multifunctional annotation scheme. This scheme is based on semantic annotations reflecting the discourse function of an utterance. The WOZ data is annotated with this scheme and a gold-standard annotation is obtained by measuring inter-annotator agreement. These low-level functions are then mapped / summarised into higher level dialogue acts, as described in the following.
6.3.2
Annotation scheme
In order to classify the wizards’ actions, we start out with a very fine-grained classification scheme which describes semantic discourse functions of so-called “Clarification Requests". The scheme was first introduced by (Purver et al., 2003a) and (Rodriguez and Schlangen, 2004) and extended by (Rieser and Moore, 2005). We found this scheme also to be suited for describing information acquisition and presentation strategies. We use a slightly modified version of the scheme, where we only use a subset of the suggested annotation tags, while adding another level describing the output modality, as summarised in Figure 6.2. In particular, the suggested annotation scheme describes wizard actions in terms of their communication level, which describes the linguistic target after (Clark, 1996). We distinguish between utterances which aim to elicit acoustic information (e.g. “Sorry, can you please repeat?") and utterances which aim to elicit further information to uniquely identify the user’s goal (e.g. “By which artist?"). As well as utterances
6.3. Action set selection
123
� � level contact | acoustic | goal/reference | intention � � WIZARD SA : severity: confirmation | repetition/elaboration | both � � modality: multimodal | verbal
Figure 6.2: Annotation scheme of discourse functions for wizard’s actions
trying to establish contact (e.g. “Can you hear me?"), and utterances about the user’s intention (e.g. “What do you want me to do?"). The problem severity describes which type of feedback the system requests from the user, i.e. asking for confirmation, for elaboration/repetition, or for both. The modality of the dialogue act can either be verbal or multimodal. Example 6.1 shows how a wizard action is annotated according to the scheme. (6.1) User: “Please search for titles by Madonna.” Wizard: “Please wait a moment [...] I found seventeen hundred and eleven items. The items are displayed on the screen” level= goal, severity= confirm, 4 modality= multimodal
One advantage of the applied scheme is that the described functions are strongly related to surface forms, as shown by (Purver et al., 2003a; Rodriguez and Schlangen, 2004; Rieser and Moore, 2005). Thus, once the dialogue manager decided on the function, the corresponding surface generation can be easily determined Nevertheless, this detailed annotation scheme is likely to cause severe data sparsity, when learning from small data sets. For example the learned user simulation has to be responsive to (at least) 24 system actions. We therefore summarise the detailed description of discourse functions into higher level dialogue acts based on the action combinations most frequently observed in the data, resulting in 6 distinct system actions, as defined in Table 6.2. (Also see Table 6.3 for examples from the corpus for each of the introduced SA categories.) Note that the chosen actions are a subset of the Speech Acts defined by the prominent DATE scheme (Walker and Passoneau, 2001). 4 Note
that asking the user to select an item on the screen is annotated as confirm.
124
Chapter 6. Building a simulated learning environment from Wizard-of-Oz data
The contact and intention level are excluded, as those levels are rarely observed in the data (also see next section). speech act
level
severity
reject
acoustic repetition
modality verbal
explicitConfirm acoustic confirmation verbal askAQuestion
goal
implicitConfirm goal
elaboration
verbal
both
verbal
presentVerbal
goal
confirm
verbal
presentMM
goal
confirm
multimodal
Table 6.2: Reduced action set: System speech acts and corresponding discourse functions
6.3.3
Manual annotation
We first evaluate the reliability of the low-level annotation scheme (Figure 6.2) via inter-annotator agreement. A standard technique is to first produce an annotators’ handbook, which contains detailed instructions for how to classify the utterances (Carletta et al., 1997). The corpus is then annotated (at least) twice, by an ‘expert’ and by a ‘naïve’ coder. The resulting annotations are then compared using the kappa (κ) statistics (Carletta, 1996). Annotations with κ ≥ .8 are said to allow strong conclusions to be drawn, and annotations with .8 > κ ≥ .67 allow tentative conclusions. These ‘magical’ thresholds are heavily discussed and criticised, e.g. (Eugenio and Glass, 2004), (Craggs and McGee-Wood, 2005), (Reidsma and Carletta, 2008). In this thesis, we use the kappa statistics not only to evaluate the resulting annotation itself, but also to (indirectly) evaluate the reliability of the underlying coding scheme. In particular, we apply an iterative approach of annotation and re-annotation until the desired κ score is reached and a gold-standard annotation can be constructed. The reasoning behind this method is that linguistic categories are often arbitrarily assigned in a top-down manner. In order to discover the action set for learning, we want to create categories which have their foundation in the real data, i.e. they are created in a bottom-up approach.
6.3. Action set selection
125
In particular, we proceed as follows: Two annotators code all the instances in the data. 5 The cases where the annotators disagree are resolved through discussion. The coding scheme and the annotator’s handbook are updated accordingly. A final version of the annotators handbook can be found in (Blaylock et al., 2006). The annotations reached a kappa score of κ = .78 for the level dimension, and κ = .71 for severity . The modality chosen by the wizard was automatically annotated/logged as described in Section 5.3. The resulting annotations were then merged to a gold-standard annotation. This gold-standard annotation was then summarised into 6 distinct Speech Acts (based on the action combinations most frequently observed in the data), as listed in Table 6.2 and corpus-based frequencies and examples are given in Table 6.3 (see discussion Section 6.3.2). 22.3% of the 793 wizard turns were annotated as presentation strategies, resulting in 177 instances for learning, where the six wizards contributed about equal proportions. Note that this relatively small percentage of presentation strategies, is mainly due to the following reasons: First, the majority of the wizards speech acts are related to providing task-related feedback, e.g. “OK, I’m searching", “OK, I’ve done that", “Just a moment please". We also did not annotate sub-dialogues considered with playlist building as we are only interested in simple search tasks.
6.3.4
Action set for learning
From the 7 high level acts we selected action 1-4b for learning as these decisions involve complex trade-offs between different dialogue parameters (as further described below). The actions reject and actions related to intention recognition are excluded from learning. For the system action reject we decided to implement system behaviour which is based on hand-coded heuristic, as this thesis does not specifically target error or uncertainty handling (see Chapter 2). Questions concerning intention recognition are also not addressed in this thesis. In general, the intention level is difficult to model, as discussed in (Ginzburg, 2008). Actions 1-4b are organised to reflect the structure of information-seeking dialogues, as introduced in section 2.6.1. The actions 1-3 belong to the information acquisition phase, where the wizards tried to gather new constraints from the user (with different 5 Many
thanks to the second annotator Michael Wirth.
126
Chapter 6. Building a simulated learning environment from Wizard-of-Oz data
#
action type
freq %
1
askAQuestion 30
2
explConfirm
5
example (original)
translation
16.9 Von welchem Künstler?
By which artist?
2.8
Are you searching for the
Du suchst das Lied ‘Smile’?
song ‘Smile’? 3
implConfirm
34
29.2 Kannst du mir den Küstler
Do you know the artist of the
des Stücks ‘Summertime’ song ‘Summertime’? nennen? 4a presentInfo
57
32.2 Ich habe drei Alben. zeige sie dir an.
-multimodal 4b -verbal
Ich
28
I have three (different) albums. I display them for you.
15.8 Es gibt das Lied von ‘Eric
This song exists by ‘Eric
Clapton’ oder von ‘Eric
Clapton’ or by ‘Eric Clapton
Clapton & The Dominos’
& The Dominos’.
?
reject
14
7.9
Wie bitte?
Pardon?
?
intention
9
5.1
Was genau soll ich tun?
What exactly do you want me to do?
177 100% Table 6.3: System action types and frequencies as annotated in the data. (?) indicates the action types that won’t be learned.
emphasis on confirming the acquired information). The actions 4a and 4b belong to the information presentation phase and are different realisations for presenting a search result. Wizards present the results by either displaying a list while naming the number of search results verbally (presentInfo-multimodal), or they give a verbal summary of what was found (presentInfo-verbal). The case that the wizard only presented the items on the screen without saying anything does not occur in the WOZ data. The learning problem is therefore defined as (a) when in the dialogue to present a list of items and how many items to present to the user and (b) how to present them (in which modality). In Section 6.5 we explain how to action set is formalised as a learning problem (using the Markov Decision Process framework).
6.4. State space selection
6.4
State space selection
6.4.1
Method and related work
127
The state space defines the agent’s view of the environment (see Chapter 2.4.1). Two main issues related to state space design are its scalability and that it is often selected manually (Paek, 2006). The state space for learning has to be specified in advance by the dialogue designer. This is usually done manually. Choosing which state space features to include is non trivial, as there is a trade-off between power of expression (many state space features can describe more complex problems) and keeping the learning problem tractable. This dilemma is also refereed to as the “curse of dimensionality" (see Chapter 2.4.2.3), which describes the fact that the number of possible states grows exponentially with the number of state variables (Young, 2002). Previous research used different approaches to address this problem for state space design. Most of the previous work has used only a limited representation of the dialogue context, where the chosen features are mainly related to the task, for example a representation of slots that need to be filled and grounded for this task, e.g. (Levin et al., 2000), (Singh et al., 2002), (Pietquin and Dutoit, 2006b), (Williams and Young, 2007a). In addition to these task-based state features dialogue designers explored the use of enriched representation of dialogue context. One can distinguish between two approaches. One approach is to use a rich set of features, but reduce the possible state-action combinations by imposing some structure on the state space (cf. Chapter 2.4.2.3). Henderson et al. (2005, 2008), for example, utilise the full dialogue context available and employ linear feature combination to group similar states together. Other research has investigated which individual context features help to learn better strategies, e.g. (Frampton and Lemon, 2006), (Tetreault and Litman, 2006). How to select these features in the first place, however, is left to the designer’s intuition and is still a manual task. In the following we distinguish between quasi-standard task-based state features, and additional domain-specific state features. The former are a representation of the task as needed for dialogue management. Task-based features commonly represent the
128
Chapter 6. Building a simulated learning environment from Wizard-of-Oz data
task-related slots, which are straightforward to enumerate manually, whereas selecting domain-specific features becomes the ‘art’ of state space design. It might take many iterations of training and testing (in simulation) until the ‘right’ feature combination (and their representation) is determined. In this thesis we investigate possible features for state space designs by first exploring the contextual features that human wizards condition their decisions on, and we use these features for state-space design.
6.4.2
Task-based state space features
We first manually enumerate a set of task-based variables which encode the dialogue task for learning. Task-oriented dialogue systems often use a simple semantic representation of the task as pairs of slots and fillers (also known as feature-value pairs). This representation is necessary for the dialogue manager to keep track of the task progress, i.e. how many slots have been filled, and their confirmation status. We choose a domain-independent representation of a 4-slot problem, corresponding to the task features genre, artist, album, track for the MP3 music domain (see Figure 6.3). In MDP-based strategy learning interpretation uncertainty is encoded in the confirmation (or “grounding") status of the slot values. POMDP-based strategy learning, in contrast, explicitly represents uncertainty in the state space representation, as described in Section 2.4.1.3. For MDP-based strategy learning it is standard practise to use slot-status categories such as “empty", “filled", “confirmed", because if all possible values of each slot would be considered as separate states, the number of states easily becomes unmanageable. We choose a representation where the filledSlot feature holds a binary value indicating whether a slot is filled. Equally, the state feature confirmedSlot holds a binary value indicating whether a slot is confirmed.
� � filledSlot 1 | 2 | 3 | 4 | : 0,1 � � task representation: confirmedSlot 1 | 2 | 3 | 4 | : 0,1
Figure 6.3: State space selection: task representation
In general, there are two possible representations for this problem: Either to encode filling and grounding status into one variable, e.g. slotN={empty|filled|confirmed}, or to encode this information into two separate variables, e.g. filledSlotN={0|1},
6.4. State space selection
129
confirmedSlotN¯ {0|1}. We choose the latter binary encoding approach, even though it results in a larger state space. However, binary encoding allows us to learn with linear function estimators (see Chapter 2.4.2.3). Linear estimators learn a preference scale over the attributes of one variable. That is, when encoding grounding information as {empty|filled|confirmed} one could either learn that confirmed is preferred to filled, and filled is preferred to empty, or the other way round. However, the preferred grounding status of a task variable highly depends on the current context, and therefore it can’t simply be described by a linear ranking (as also illustrated in Chapter 3). Furthermore, the state space size for the binary representation is also limited by the fact that not all combinations of indicator truth values can occur in practise (e.g. a slot cannot be confirmed before it is filled).
6.4.3
Feature selection techniques for domain-specific state space features
In Section 5.4 we formulate the hypothesis that good wizard multimodal strategies are context dependent. We now investigate whether wizards follow a specific context-dependent pattern, i.e. whether there are specific contextual features which influence the ‘average’ wizard’s behaviour. We use these features to design the state space for RL. In particular, we are interested in features which are related to when the wizards present the search results and how they present them. We therefore annotate the corpus with a rich set of dialogue context features using semi-automatic methods, as described in Section 5.3. We then use different feature selection techniques (see (Guyon and Elisseeff, 2003) for an introduction) to automatically select a subset of these features. A similar approach to state space selection is also followed by (Chickering and Paek, 2007), who utilise Bayesian model selection techniques in order to choose state features from a large number of candidate variables. In contrast to the approach followed in this thesis, (Chickering and Paek, 2007) are not interested in exploring human behaviour, but they select features from a human-computer dialogue, which predict the (immediate) utility of an action.
6.4.3.1
Context/ Information-State Features
We first enumerate a rich set of dialogue context features to choose from. A state or context in our system is a dialogue “information state” as defined in (Lemon et al., 2005). We divide the types of information represented in the dialogue information state into local features (comprising low-level and dialogue features), dialogue history features, and
130
Chapter 6. Building a simulated learning environment from Wizard-of-Oz data
user model features. We also defined features reflecting the application environment (e.g. driving). The information state features are shown in Tables 6.4, 6.5, and 6.6, and further described below. All features are automatically extracted from the XML log-files (as described in Section 5.3), and are available at runtime in ISU-based dialogue systems.
Local features:
First, we extracted features present in the “local" context of a wizard action,
as shown in Table 6.4, such as the number of matches returned from the data base query (DB), whether any words were deleted by the corruption algorithm (see Chapter 5.2), the previous user speech act (SA-type) of the antecedent utterance, and its argument (SA-argument). Speech act type and action are manually annotated following a similar procedure as for annotating the system action set (see Section 6.3), with κ = 0.68 for SA-type and κ = 0.76 for SA-argument.
Local features DB: database matches (integer) deletion: words deleted (yes/no) SA-type: command, confirm, correct, request, provide SA-argument: genre, artist, album, song, playlist, two arguments, three arguments, other, NULL Table 6.4: Contextual/Information-state features: Local Features
Dialogue history features:
The history features account for events in the whole dialogue
so far, i.e. all information gathered before entering the presentation phase, as shown in Table 6.5. We include features such as the number of questions the wizard asked so far (questHist), how often the screen output was already used (screenHist), the corruption rate so far (delHist), the dialogue length measured in turns (dialogueLength), the dialogue duration in seconds (dialogueDuration), and whether the user reacted to the screen output, either by verbally referencing (refHist), e.g. using expressions such as “It’s item number 4", or by clicking (clickHist).
User model features:
Under “user model features" we consider features reflecting the
wizards’ responsiveness to the behaviour and situation of the user. Each session comprises four dialogues with one wizard. The user model features average the user’s behaviour in these dialogues so far, as shown in Table 6.6, such as how responsive the user is towards the screen output, i.e. how often this user clicks (clickUser) and how frequently s/he uses verbal
6.4. State space selection
131
Dialogue History Features questHist: number of questions (integer) screenHist: number screen outputs (integer) delHist: average corruption rate (real) dialogueLength: length in turns (integer) dialogueDuration: time in sec (real) refHist: number of verbal user references to screen output (integer) clickHist: number of click events (integer) Table 6.5: Contextual/Information-state features: History Features
references (refUser); how often the wizard had already shown a screen output (screenUser) and how many questions were already asked (questUser); how much the user’s speech was corrupted on average (delUser), i.e. an approximation of how well this user is recognised; and whether this user is currently driving or not (driving). This information was available to the wizards.
User model features clickUser: average number of clicks (real) refUser: average number of verbal references (real) delUser: average corruption rate for that user (real) screenUser: average number of screens shown to that user (real) questUser: average number of questions asked to user (real) driving: user driving (yes/no) Table 6.6: Contextual/Information-state features: User Model Features
Note that all these features are generic over information-seeking dialogues where database results can be displayed on a screen; except for driving which only applies to hands-andeyes-busy situations. Table 6.7 shows a context for the dialogue in Example 6.1, assuming that it was the first utterance by this user. This potential feature space comprises 16 features, many of them taking numerical attributes as values. Including them all in the state space for learning would make the RL problem unnecessarily complex. In the next two sections we describe automatic feature selection techniques, which help to reduce the feature space to a subset which is most predictive of when and how to present search results.
132
Chapter 6. Building a simulated learning environment from Wizard-of-Oz data
LOCAL FEATURES DBmatches: 1711 deletion: 0 SA-type: command SA-argument: artist HISTORY FEATURES [questHist, screenHist, delHist,refHist,clickHist]=0 duration= 10s length= 1 turn USER MODEL FEATURES [clickUser,refUser,screenUser,questUser]=0 driving= true Table 6.7: Example: Features in the context after the first turn in example 6.1
6.4.3.2
Feature Selection
Feature selection describes the problem of selecting a subset of features that are most predictive for a given outcome. We use feature selection techniques to identify the context features which are most predictable for the wizards choosing a specific action. We choose to apply forward selection for all our experiments in order to not include redundant features, given our large feature set. We use 2 different types of selection techniques: We use the following feature filtering methods: correlation-based subset evaluation (CFS) (Hall, 2000) and a decision tree algorithm (rule-based SL). We also apply a correlation-based χ2 ranking technique. Filtering techniques account for inner-feature relations, selecting subsets of predictive features at the expense of saying less about individual feature performance itself. Ranking techniques evaluate each feature individually. For our experiments we use implementations of selection techniques provided by the WEKA toolkit (Witten and Frank, 2005). First, we investigated the wizards’ information acquisition strategy, i.e. which features are related to the wizards’ decision when to present a list (presentInfo), i.e. the task is to predict presentInfo vs. all other possible dialogue acts. None of the feature selection techniques was able to identify any predictive feature for this task. Hence, we conclude that there is no distinctive pattern the wizards follow for when to present information. Next, we investigated the wizards’ information presentation strategy, i.e. which features are
6.5. MDP and strategy design
133
related to the wizards’ decision to present a list verbally (presentInfo-verbal) or multimodally (presentInfomultimodal). All the feature selection techniques consistently choose the feature DB (number of retrieved items from the database). Note that in Chapter 3 this information was already shown to be valuable for when to present the search results. Here the wizards primarily utilise this feature for how to present the results. This result is maybe not very surprising, but it approves the idea that using feature selection on WOZ data delivers valid results. Relevant features for other domains may be less obvious. For example, Levin and Passonneau (2006) suggest the use of WOZ data in order to discover the state space for error recovery strategies. For this task, many other contextual features may come into play, as shown by Gabsdil and Lemon (2004) for automatic ASR re-ranking. In sum, the dialogue state is now represented as follows. There are 8 binary state variables (for 1 ≤ N ≤ 4): filledSlotN for whether each slot number N is filled, confirmedSlotN for whether each slot number N is confirmed, and one variable DB for the current number of DB hits, which takes integer values between 1 and 438, resulting in 28 × 438 = 112, 128 distinct dialogue states. In the next section, we combine the chosen state space (as described in this Section) with the chosen action space (as defined in Section 6.3) into a Markov Decision Process model in order to learn optimal, context dependent action selection using RL.
6.5 6.5.1
MDP and strategy design Motivation
A basic prerequisite to apply RL to dialogue strategy learning is to formulate the learning problem as a Markov Decision Process (MDP) model, or alternatively, as a Partially Observable Markov Decision Process (POMDP). This thesis uses MDPs for strategy presentation, as discussed in Section 2.4.1.3. Chapter 2.4.1 gives a brief overview on MDPs, introducing the main elements, namely the state space S, the action set A, the state transition function T , as well as the reward function R . In the following Section we present different techniques to impose additional structure on MDP models for dialogue strategy learning. Adding structure helps to reduce the possible state-action space and thus makes the learning problem more tractable (cf. Section 2.4.2.3). In particular, we investigate hierarchical RL, also known as sub-goal or sub-strategy learning (see (Barto and Mahadevan, 2003)) and learning with preconditions, implemented as Information State Update Rules (also see (Heeman, 2007)). These techniques can be used to encode prior knowledge which otherwise had to be learned in
134
Chapter 6. Building a simulated learning environment from Wizard-of-Oz data
more complex ways.
6.5.2
Implementation
We use the REALL - DUDE development tool (Lemon et al., 2006c) for implementing the learning problem. REALL
combines reactive planning and hierarchical RL (Shapiro, 2001). REALL is a language
for defining reactive agent behaviour (i.e. reactive to a rapidly changing environment). It consists of a representation for expressing hierarchical, goal-oriented plans, together with an interpreter for evaluating those plans. REALL is also a learning system, containing different algorithms for simulation-based RL. Programmers can access this capability by writing plans with disjunctive elements, and embedding those choice points into hierarchical plans for learning. A plan is defined by the following elements. Each plan has an objective, which is the purpose of the plan, or the (sub-)strategy goal. It has requirements, which are the preconditions for action. For us, these preconditions are defined by Information State Update (ISU) rules. A plan can also have different means which are alternate methods for achieving the objective. For us, the different means correspond to the action set as defined in Section 6.3. Furthermore, the execution of a plan is based on a number of features, which correspond to the state space for learning (see Section 6.4). The ISU rules are encoded by using the DUDE tool. DUDE is a “Dialogue and Understanding Development Environment" for rapid system development (Lemon and Liu, 2006). Chapter 7.1.1 provides a more detailed description of the tool. The ISU rules share the same state features with REALL. Thus, the implemented dialogue logic in DUDE directly triggers the preconditions for (sub-)plan execution in REALL.
6.5.3
Hierarchical Reinforcement Learning in the ISU approach
We formulated the learning problem as follows, following the hierarchical structure of the identified action set (see Section 6.3.4). The available state features correspond to the feature set identified in Section 6.4. The problem is represented as an information acquisition plan with an information presentation sub-plan (see Figure 6.4). For the information acquisition phase four alternative actions are available to the learner. The state space comprises the task-related state features (see Section 6.4.2), as well as a feature representing the number of retrieved database items (see Section 6.4.3). If the action presentInfo is chosen in the acquisition phase, the information presenta-
6.5. MDP and strategy design
135
� � askASlot filledSlot 1 | 2 | 3 | 4 | : 0,1 � � implConfAskASlot acquisition action: state: confirmedSlot 1 | 2 | 3 | 4 | : 0,1 explConf � � DB: 1-438 presentInfo � � DB low: 0,1 � � presentInfoVerbal presentation action: state: DB med: 0,1 presentInfoMM � � DB high 0,1
Figure 6.4: State-Action-Space for hierarchical RL
tion sub-plan gets activated. For information presentation two actions are available. These actions represent different ways of realising the presentInfo action, namely presenting the list verbally (presentInfoVerbal) or multimodally (presentInfoMM). For the presentation phase only the DB feature (as automatically selected in Section 6.4.3) is available to the learner. For information presentation, the DB feature is quantised into three distinctive ranges. The method for quantisation will be further described in Section 6.10. Note that for the acquisition phase the state-action space is still continuous. In total there are 4112,128 (theoretically) possible policies for information acquisition. For the information presentation phase there are (only) 3
22 = 256 possible policies. (Note, that the number of policies which are practically possible is much lower, due to different types of domain-specific and logical constraints, as further discussed in Section 6.11.4.) The automaton in Figure 6.5 illustrates the action choices available to the learner at different times in the dialogue. The chosen system prompts for the final systems are modelled after the wizard utterance found in the corpus (see Table 6.3, also see example dialogues in Appendix B.3). Note that dialogue policy learning takes place at the intention level, i.e. system and user simulation are ‘communicating’ on the speech act level as shown in the example dialogues in Appendix B.2. From a dialogue system perspective, the two sub-plans correspond to the Dialogue Management task of choosing an action (‘what to say’) and the Natural Language Generation (NLG) task of realising the action (‘How to say it/How to choose the output’). For information seeking dialogues, Dialogue Management and NLG are two closely interrelated problems: the decision of when to present information depends on the available options for how to present them, and
136
Chapter 6. Building a simulated learning environment from Wizard-of-Oz data
Figure 6.5: Dialogue system automaton
vice versa. We therefore optimise NLG and Dialogue Management policies in an integrated fashion. Most of the previous work learned strategies where the policy chooses between different utterances with one fixed surface form. In this thesis we de-couple form and function of a speech act, by learning in an hierarchical manner. First, the optimal function is determined, and then the optimal output medium. We currently only concentrate on whether to realise the presentation phase in an multimodal or verbal manner, while the surface realisation is still template-based. In future work we will optimise more fine grained decisions for linguistic surface generation. 6 6 See
Computational Learning in Adaptive Systems for Spoken Conversation (www. classic-project.org) funded by the European Community’s Seventh Framework Programme (FP7/2007-2013) under grant agreement no. 216594.
6.5. MDP and strategy design
6.5.4
137
Further system behaviour
It is common practise to restrict the learning space of a policy by integrating prior domain knowledge in order to not have to learn the obvious (see for example (Lemon et al., 2006a), (Heeman, 2007)), e.g. always greet the user at the start of the dialogue. We implement this further system behaviour as ISU rules using the DUDE dialogue engine. The implemented rules encode simple restrictions on the available action choices, for example that only filled slots can be confirmed. An exhaustive list of preconditions for each action is shown in Table 6.8. Action
Description
Precondition
greeting
Self-introduction and mixed-initiative opening
Only available at the beginning
(e.g. “Hi this is iTalk, your talkative music
of the dialogue.
player. How my I help you today?") askASlot
Ask for the next unfilled slot (default ordering) At least one slot still empty. (e.g. “Which genre would you like?")
implConf-
Implicit confirm the most recent filled slot
AskASlot
while asking for the next empty slot (e.g. be filled but not confirmed; at “Searching for Rock music. By which artist?")
explConf
The last provided slot value must least one slot still empty.
Explicit confirm the most recent filled slot (e.g. The last provided slot value must “Did you say Rock?")
be filled but not confirmed.
presentInfo Present information (and enter the informa- At least one slot must be filled. tion acquisition phase) (choose between multimodal or verbal presentation) endDialogue Serve the best matching item and end the dia- User selected an item in the prelogue. If the user rejects, the dialogue re-starts. sentation phase. (e.g. “You will now hear ‘Mozambique’ by Bob Dylan. Are you happy with this option? ") Table 6.8: Available system actions and their preconditions.
The task level is implemented assuming the following default ordering of slots: genre → artist → album → song. A similar ordering is also used by related work on MP3 player applications for in-car, e.g. (Forlines et al., 2005), (Wang et al., 2005), (Schulz and Donker, 2006), (Varges et al., 2006). In future, work we plan to learn the optimal ordering of tasks using RL, as discussed in Section 6.11.5. The database is queried every time the user provides a new slot value, where all the filled slots serve as constraints for database retrieval. The retrieval also returns partial matches of strings,
138
Chapter 6. Building a simulated learning environment from Wizard-of-Oz data
as discussed in Section 6.2. Once the system decides to present the information, it automatically fills all empty slots, where a unique value can be retrieved. In example 6.2 the system identifies a unique artist and genre for the song, whereas the album still is ambiguous. Therefore, the system automatically fills genre and artist. (6.2) User: Search for the song “Layla" please. State: filled [slot4], confirmed [], db:2 System: There are 2 results matching your query: all by the artist Eric Clapton, all from the genre Blues, all having the song title Layla, but a different album. You have the following options: Clapton Chronicles and MTV Unplugged. Which album would you like? State: filled [slot1,slot2,slot4], confirmed [], db:2 This basic system functionality exists independently from the learned strategy, i.e. the baseline strategy accesses the same basic functionality.
6.6 6.6.1
Supervised Baseline Strategy Method and related work
A baseline system is a benchmark used as a basis for comparison. In order to make sensible claims, one must be aware that one compares dialogue policies which are commensurable (and not “apples with oranges"). Furthermore, the observed differences in strategy should be informative, i.e. the differences should have a clear interpretation. In the following we discuss different options for a baseline strategy. The most common practise is to compare the RL-based strategy against a hand-coded rulebased strategy, e.g. (Walker, 2000), (Scheffler and Young, 2002), (Frampton and Lemon, 2006), (Lemon et al., 2006a), (Heeman, 2007), (Spitters et al., 2007) etc. For hand-crafted strategies, to be a fair basis for comparison, they must be tuned to the same objective function, as criticised by (Paek, 2006). That is, their parameters need to be manually optimised with respect to the same dialogue performance metric. We have followed this approach in Chapter 3, where we compared RL-based policies against various manually tuned hand-coded polices. Here, we choose an alternative baseline which allows us to measure relative improvements
6.6. Supervised Baseline Strategy
139
over strategies in the training data, as well as it allows to compare human and optimised strategies. (Paek, 2001) suggests to compare dialogue performance against WOZ data, where the wizard’s strategy serves as a “gold-standard". Human performance is clearly superior for error recovery or NLU tasks, however, the wizards’ strategies cannot be regarded as being “gold standard" for information seeking tasks, as discussed in Chapter 5.4. Nevertheless, this comparison is still interesting as it allows to measure the difference between strategies intuitively applied by human wizards and strategies which are automatically optimised. Another baseline is suggested by (Singh et al., 2002). Singh et al. measure the relative improvement of the optimised model-based policy towards the initial exploratory strategies in the training data for the NJFun system. This comparison allows to measure the relative performance gain when applying RL to automatic strategy optimisation. A similar approach is followed by (Henderson et al., 2008). They compare the learned policy against 8 expert systems, on whose data the policy was trained on. In order to measure the relative improvement over the training data, Henderson et al. had to ‘average’ over the different system strategies. This ‘average’ (or ‘multi-expert’) strategy is constructed using Supervised Learning, which models the majority decision the different systems take in a specific dialogue state (cf. Section 2.3.4). Similarly, our data includes strategies of 5 different wizards, see Section 5.1. Thus, we first have to construct a baseline that reflects the ‘average’ wizard strategy in order to measure the relative the relative improvement over the initial data. We therefore follow the approach introduced by Henderson et al. (2008) and apply Supervised Learning (SL), as described in the following.
6.6.2
Supervised Learning: Rule-based Classification
The following SL experiments are all conducted using the WEKA toolkit (Witten and Frank, 2005). As machine learners we choose a decision tree algorithm and a rule induction classifier as they are the easiest to interpret and also to implement in standard rule-based dialogue systems. Furthermore, both models are known to work well with relatively small data sets (Alpaydin, 2004). We learn with the decision tree J4.8 classifier, which is WEKA’s implementation of the C4.5 system (Quinlan, 1993), and rule induction JRIP, which is the WEKA implementation of (Cohen, 1995)’s “Repeated Incremental Pruning to Produce Error Reduction” (RIPPER). In particular, we want to learn models which predict the following wizard actions:
140
Chapter 6. Building a simulated learning environment from Wizard-of-Oz data
• Presentation timing: when the ‘average’ wizard enters the presentation phase, i.e. we learn to predict presentInfo versus any other wizard action; and • Presentation mode: how the list is presented, i.e. for every instance of presentInfo we learn to predict whether the information is presented in a multimodal or verbal mode. As input features we use the full list of ISU-based features as described in Section 6.4.3.1.Both models are trained and tested using 10-fold cross validation. For presentation timing we train on 177 instances (85 do presentInfo/ 92 do not); for presentation mode on 85 instances (28 verbal/ 57 multimodal), cf. Table 6.3. majority baseline
JRip
J48
presentation timing
51.99±2.20
50.23±9.70
53.49±11.72
presentation mode
51.00±7.04
93.53±11.47*
94.63±9.96 *
* statistically significant improvement, p < .05 Table 6.9: Predicted accuracy for presentation timing and mode (with standard deviation
±) Table 6.9 presents the results for comparing the accuracy of the learned classifiers against the majority baseline, constructed by always predicting the majority class in the data (which is a stadard technique to compare SL classifiers). For presentation timing, none of the classifiers significantly improves over the majority baseline (confirming the results from feature selection in Section 6.4.3.2). Hence we conclude that there is no distinctive pattern the wizards would follow for when to present information. For presentation mode, both classifiers significantly outperform the baseline. The learned models (decision trees and induced rules) both only take the number of retrieved database items as input feature (again confirming the results from feature selection), and can both be rewritten as in Algorithm 2. The learned rules are used to implement a rule-based baseline strategy (SL policy) by controlling the choice points of the implemented automaton (see last Section Figure 6.5). As just noted, there is no common pattern in the data for when to start the presentation phase. We therefore employ a frequency-based approach following the distribution in the WOZ data: in 0.48 of the time the baseline policy decides to present the retrieved items; for the rest of the time the system randomly chooses between the 4 available actions for information acquisition (where the implemented system constraints assure that the strategy is still sensible).
6.7. Noise simulation: Modelling the effects of mis-communication
141
Algorithm 2 SupervisedStrategy Require: An integer DB ≥ 1. 1: DB ⇐ number of retrieved database items 2: if DB ≤ 3 then 3:
return presentInfoVerbal
4: else 5:
return presentInfoMM
6: end if
An example for the SL baseline policy (deployed in the simulated environment) can be found in Appendix B.2, Table B.2.
6.7 6.7.1
Noise simulation: Modelling the effects of mis-communication Method and related work
One of the fundamental characteristics of Human-Computer Interaction is an error prone communication channel, as discussed in Chapter 2.1. Therefore, the simulation of channel noise is an important aspect of the simulated learning environment. In spoken dialogue systems, the channel noise, as introduced by Automatic Speech Recognition (ASR), is often measured in terms of word error rate (WER). WER is defined as in Equation 6.3, where S is the number of substitutions, D is the number of the deletions, I is the number of the insertions, N is the number of words in the reference. W ER =
S+D+I N
(6.3)
Previous work on dialogue strategy learning either ignores the error channel altogether, e.g. (Levin et al., 2000; Schatzmann et al., 2007c), or simulates errors using (statistical) models of different complexity. One can distinguish between two strands of research: methods that model noise at a globally fixed error rate, and methods which compute the word error rate for every utterance. The former assumes a fixed distribution of errors for the whole interaction. (Pietquin and Renals, 2002), for example, condition the error rate on the type of the task (e.g. word vs. digit recognition). (Prommer et al., 2006) set a fixed error rate per individual speaker. The simulated word error rate can also be set to approximate the distribution found in the training data: In (Georgila et al., 2005a; Lemon et al., 2006a), for example, 70% of all
142
Chapter 6. Building a simulated learning environment from Wizard-of-Oz data
utterances are transmitted via a WER of 0%, 10% of with a WER of 100%, and 20% with a varying rate between 0 and 100%. In (Scheffler and Young, 2001), the user’s dialogue behaviour is modelled as a network of interconnected states, with user actions corresponding to state transitions and errors corresponding to special “mumble" or “null" transitions, which occur with a certain (globally fixed) frequency. The other strand of research explicitly models the confusability of individual words and utterances to overcome the assumption of a globally fixed error rate. Error simulation based on phone-level confusions is explored by in different work, including (Pietquin, 2004), (Stuttle et al., 2004), (Deng et al., 2003). While experiments with phone-level confusions show to produce promising results, the amount of training data needed to model context-dependent phone confusions for a typical tri-phone based recogniser is often very large. Computationally less expensive word-level confusion methods have been suggested by (Pietquin and Dutoit, 2006b) and (Schatzmann et al., 2007b). In this thesis we model channel noise on a level of abstraction which is adequate to the task and the available data: The introduced model is complex enough to learn a presentation strategy which is sensitive to the noise level, while it is obtainable from a small data set. This thesis does not focus on learning a (sophisticated) error handling strategy, but to learn an information seeking strategy under the presence of noise. In particular, we require a framework for modelling the effects of misunderstandings (as introduced by insertions and substitutions) and non-understanding (as introduced by deletions) on formulating a database query. Not all the the approaches listed above do distinguish between substitution, deletion, and instertion, e.g. Pietquin and Dutoit (2006b); Prommer et al. (2006) only model word confusions/substitutions. Furthermore, we consider it to be desirable if the noise simulation model is language independent. The language of the WOZ data is German, while the user tests are conducted in English. It is therefore problematic to directly train a detailed noise simulation (e.g. based on word-level confusion) on the recorded WOZ interaction. In the following we present a task-based error model which simulates the general presence of noise and its effects on the interaction, rather than simulating the noise itself.
6.7.2
Simulating the effects of non- and mis-understandings
In the following we describe a framework for simulating how non- and misunderstandings effect the behaviour of the user, as well as the system and the task. We first estimate a (global) error distribution from the data, following (Georgila et al., 2005a; Lemon et al., 2006a). In the WOZ experiment 20% of the user utterances were corrupted by low noise and 20% by high noise. This is averaged into a 30% chance of the input being mis-recognised. In the WOZ
6.7. Noise simulation: Modelling the effects of mis-communication
143
setting only 7% of the user utterances lead to a (noticeable) communication error (see Section 5.2.3). However, the performance of present speech and language processing technology cannot be compared to human performance, especially not when communicating in noisy environments. A 30% error rate is a realistic assumption for deployed dialogue systems. For example, (Carpenter et al., 2001) find that in the COMMUNICATOR corpus 33% of over 4.5k user utterances had some kind of processing error. This is consistent with the findings by Georgila et al. (2005a) who estimated a 30% error rate on 697 dialogues from the same corpus. (Hirschberg et al., 2001) report on similar results for the TOOT corpus by (Litman and Pan, 1999): 29% of over 2.3k user utterances were corrections of system turns. For non-understandings we estimate a rejection rate of about 4% of the utterances. We model non-understandings by assigning a 4% probability of generating out-of-vocabulary (OOV) utterances to the user model (similar to Scheffler and Young (2001)’s “mumble" state transition). OOV utterances lead to an empty parse. Corpus studies report on similar OOV rates (Bazzi and Glass, 2000). While the simulation of non-understandings is pretty straight forward, the simulation of misunderstandings requires a more complex model. Where non-understandings are recognised immediately by the system (as well as by the user), misunderstandings might not be detected until a later turn or might not be detected at all. Results from a corpus study by (Bohus and Rudnicky, 2005a) for example show that there is a discrepancy of up to 51.5% between what is mis-recognised by the system and what is corrected by the users: users may correct right hypothesis and may leave errors uncorrected. In order to model such discrepancies, we separately model how misunderstandings effect the user and the system side. For the user side, the noise model sets the probabilities of the user rejecting or accepting the system’s hypothesis for the user simulation. In general, the probabilities for the user simulation are learned from data (as described in the next Section 6.8). Note that the user speech act labels in the WOZ data are held on an abstract level, i.e. they still need to be realised in a context-specific way, e.g. with respect to the current noise level. In particular, the two abstract user speech acts repeat content and yes-no answer are differently realised depending on the noise model, as shown in Table 6.10. For example, if the user simulation predicts a user’s speech act as a yes-no answer, the noise model sets the probability for the user agreeing with yes, or rejecting with no. That is, while the noise model follows a fixed error rate, the user simulation determines the probability of individual speech acts in a data-driven context dependent manner.
For the system side, the effects of misunderstandings are modelled by how we estimate task completion in the reward function. We estimate a 30% chance for each slot which
144
Chapter 6. Building a simulated learning environment from Wizard-of-Oz data
annotated in corpus
no error
semantic error
repeat content
confirm and re-provide same negate and re-provide different
y/n answer
yes-answer
no-answer
Table 6.10: Action mapping from corpus annotation to user acts including the noise model
is filled but not confirmed for being incorrect due to mis-recognition. We account for this fact when calculating task success in the reward function, as described in Section 6.9. For slots which are filled but confirmed we always assume that those are correct. In future work we will refine this assumption. In sum, the noise model is realised in the reward computation and the user simulation. It models the effects of (semantic) non- and misunderstandings on system accuracy and user behaviour. The applied level of abstraction and the model’s simplicity allows to estimate learn an error simulation from small data sets. Furthermore, the model is easily adjustable for different levels of noise. (Lemon and Liu, 2007), for example, use a similar implementation for the noise model in order to investigate the effects of training and testing a strategy in environments with different noise levels. The drawback of the applied technique is that noise is modelled at a globally fixed error rate. It does not adjust the ASR quality according to the local (e.g. phonetic) context. One direction for future research is to simulate a context-dependent semantic error rate following work by (Bohus and Rudnicky, 2002), which predicts semantic confidence levels, rather than simulating WER.
6.8 6.8.1
User simulation Method and related work
The so-called user simulation is a predictive model of real user behaviour used for automatic dialogue strategy development. It should be noted that user simulation is different to user modelling, although these two terms are often used interchangeably in the literature. The main difference is that they serve different functions on the
6.8. User simulation
145
system side. The purpose of user modelling is to adapt strategies to different user types. For example, dialogue strategies are adapted to user expertise (Hassel and Hagen, 2005), or information is presented according to user preferences (Demberg and Moore, 2006). Note that RL can also be used for user modelling in order to learn user type specific strategies. For example, different user profiles can be incorporated in the reward function, as demonstrated in Chapter 3.2.5. Recent work on user simulation for strategy learning differs from user type in various respects. The role of user simulation is a synthetic dialogue partner which generates behaviour representative for a diverse user population. As such, the user simulation must be able to predict user responses that real users might give in the same or a similar context. In addition, it must also represent the statistical distribution over all possible types of user behaviour in order to account for natural variety in real human user behaviour. These requirements clearly favour a statistical approach, where the model’s parameters can be estimated from real data.
6.8.1.1
Section outline
This (very long) Section proceeds as follows. We first review user simulations in the context of dialogue strategy learning. We then explain how user acts are annotated in the WOZ data in Subsection 6.8.2. In Subsection 6.8.3 we then show that building a simple bi-gram model is not an option, as it leads to severe data sparsity. We therefore introduce two different methods for building user simulations for learning from small data sets: in Subsection 6.8.3 we present a novel technique for cluster-based user simulations; in Subsection 6.8.5 we apply smoothing to the bi-gram model. We then introduce a metric to evaluate user simulations with respect to their suitability for strategy training and testing, as explained in Subsection 6.8.6. In Subsection 6.8.7 we describe how the user actions are realised with respect to the current user goal.
6.8.1.2
User simulation for dialogue strategy learning
Statistical user simulation for dialogue strategy learning is explored by a number of research groups, not only in the context of RL, but also in combination with supervised techniques for strategy optimisation, e.g. (Filisko and Seneff, 2005, 2006), or in order to identify weak spots during (manual) strategy development (Chung, 2004),
146
Chapter 6. Building a simulated learning environment from Wizard-of-Oz data
or also for automatic dialogue evaluation (Watanabe et al., 1998), (López-Cózar et al., 2003), (Möller et al., 2006). (Also see (Schatzmann et al., 2006) for a review of user simulation for dialogue strategy learning.) The major advantage of user simulation is that they are less cost intensive than experimenting with real users. For simulation-based (also known as model-free) RL, the dialogue system learns online during the interaction with the simulated user. One of the major advantages of simulation-based RL is that a vast state-action space can be explored, as discussed in Chapter 2.4.3. A simulated user allows any number of training episodes to be generated, so that the learning dialogue manager can exhaustively explore the space of possible strategies. In general, one can distinguish user simulations according to the employed level of abstraction, their intended purpose, and the utilised modelling technique. The level of simulated interaction can either be the acoustic level, e.g. (López-Cózar et al., 2003; Chung, 2004; Filisko and Seneff, 2005, 2006), the word-level, e.g. (Araki et al., 1997; Watanabe et al., 1998), or the intention level, as first introduced by (Eckert et al., 1997). Simulations on the word and acoustic level are mainly used for dialogue system testing (including the ASR and NLU module). Simulations on the intention level are most popular for RL-based strategy learning, as they outperform the lower level approaches in terms of robustness, portability and scalability. A variety of different statistical techniques are applied to build such intention-based simulations. All of them exploit the Markov assumption, i.e. the next user action is assumed to be independent from the dialogue history and can be predicted based on some representation of the current dialogue state. This is formalised as a sequence of state transitions and dialogue acts: at any time t, the user is in a state S, takes action au , transitions into the intermediate state S, receives system action as , and transitions into the next state S0 where the cycle restarts.
S → au → as → S0 → . . .
(6.4)
Eckert et al. (1997, 1998) pioneered the research area by using simple bi-gram models to predict the next user action based on the previous dialogue state. Much current work followed, e.g. (Scheffler and Young, 2001, 2002), (Georgila et al., 2005a, 2006b), (Cuayáhuitl et al., 2005), (Pietquin, 2004; Pietquin and Dutoit, 2006b,a), (Schatzmann et al., 2005b,a, 2007a,c), (Ai and Litman, 2006, 2007; Ai et al., 2007b), (Rieser and
6.8. User simulation
147
Lemon, 2006a), etc. Many of these methods define a “user goal" in order to ensure that the simulation model generates realistic behaviour in a consistent and goal-directed manner. In this context, “user goal" usually refers to a concrete task the user tries to accomplish by using the system. It is commonly assumed that the user goal is an instance of the task space defined by the possible slot values. One major issue for user simulation is to assure “consistent" behaviour. This can either mean consistency with respect to the current user goal. For example, Schatzmann et al. (2007a,c) introduce agenda-based models where the user goal is modelled as a hidden variable to assure consistency. For other domains, such as tutoring, Ai and Litman (2007) introduced knowledge-consistent user simulations. Consistent user behaviour also means to be to be concordant with the dialogue history. Due to the Markov assumption the user simulation is “memory-less" towards its own previous behaviour. For example, a user simulation might first confirm a certain value and than negate it later. (Note that real user behaviour can also be in-consistant to a certain degree, as shown by (Bohus and Rudnicky, 2005a)). Previous work has addressed this issue by modelling longer sequences of interactions. For example, Scheffler and Young (2002) propose the use of graph-models in order to improve temporal consistency. Georgila et al. (2005a, 2006b) combine higher level n-gram models with linear feature combination techniques, and thus are able to learn with a rich representation of dialogue context and dialogue history. Work by Cuayáhuitl et al. (2005) utilises Hidden Markov Models to simulate user behaviour as a sequence of actions. Pietquin (2004); Pietquin and Dutoit (2006b,a) use Bayesian Networks to allow multiple dependencies between dialogue states and user actions. However, the drawback to all these methods is that they need to be trained on large amounts of data.
6.8.1.3
Learning user simulations from small data sets
In this thesis, we are challenged by learning user simulations from a small data set. Previous work has also addressed the question of how to learn user simulations when training data is sparse. (Prommer et al., 2006) for example learn simple a bi-gram model from a data set comprising 82 dialogues, 314 utterances. The bi-gram model comprises 4 user actions and 8 system actions, where 53.13% of the possible combinations have zero frequency. As a consequence the user simulation will never
148
Chapter 6. Building a simulated learning environment from Wizard-of-Oz data
generate the full range of user actions (after a specific system action), and thus fails to let the learner sufficiently explore the state-action space (also see discussion Section 6.1.2). An approach to overcome the data-sparsity problem is suggested by Schatzmann et al. (2007c). They use a summary-space mapping approach to learn a user simulation from 160 dialogues, 6452 turns. In the summary space mapping approach similar states are summarised (using the Expectation-Maximisation algorithm), and a distribution of possible user behaviour is assigned to a set of states. This method allows to generate the full range of possible user behaviour in every state. In (Rieser and Lemon, 2006a) we introduced similar approach to Schatzmann et al. (2007c), which is described in the following.
6.8.1.4
Training and testing with simulated users
A common strategy is to first get promising results in simulation, before testing with real users, e.g. (Lemon et al., 2006a; Frampton, 2008; Filisko and Seneff, 2006). However, it was criticised that training and testing on the same user simulation is “cheating" (Paek, 2006). As pointed out by Schatzmann et al. (2005b), policies trained with a poor user simulation model may appear to perform well when tested on the same model, but fail when tested on a better user simulation model. Fortunately, the converse is not true: policies learned with a complex model will still perform well when tested on a less complex model. Lemon and Liu (2007) confirm that policies for “worst case scenarios" (e.g. an uncooperative user, or noisy conditions) transfer well to “easier" situations, but not the other way round. In sum, these results indicate that in general training and testing should be done with two separate user simulations which meet different requirements. Evaluating simulated components is a difficult issue, as already discussed in Section 6.1.2. On the one hand the evaluation metric needs to assess the coverage provided by the simulation (in order to learn robust strategies); on the other hand the metric needs to assess how realistic the simulation is in order to produce realistic feedback. These issues become even more prominent when learning from small data sets. Furthermore, the importance of coverage and realism seem to be differently weighted for strategy testing and strategy training. Results by (Ai et al., 2007b) indicate that for strategy training strategy coverage is
6.8. User simulation
149
even more important that realistic feedback. ((Ai et al., 2007b) show that random models perform better than more accurate ones if the latter fail to provide enough coverage.) The main purpose of user simulation used for strategy testing is to get a realistic estimate of strategy performance when tested with real users, see for example (Lemon et al., 2006a). Hence, user simulation for strategy testing needs to be more realistic. In the following we also introduce an evaluation metric to assess the Simulated User Pragmatic Error Rate (SUPER) which allows to assess coverage and realism provided by simulated user behaviour, and also allows to weight these aspects differently for strategy training and testing.
6.8.2
User actions
In order to learn user actions from data, they first have to be annotated, and an action set for annotation must be defined, similar to the system action set described in Section 6.3. Similarly, the user model’s action set must achieve a trade-off between adequately covering the complexity of human behaviour and being simple enough for its parameters to be trainable on a limited amount of corpus data (in analogy to the system action set). We therefore employ the same iterative manual annotation method as for the system actions (see Section 6.3.3). In addition, we had to define adjacency pairs/ question-answer pairs, i.e. for every user act the corresponding system act had to be annotated. This was done semi-automatically from the log-files. The annotations reach a kappa score of κ = .70. #
action type
freq %
1
add
54
30.5 äh, Ella Fitzgerald
er, Ella Fitzgerald
3
repeat
57
32.2 ja, Smile ja
yes, Smile yes
2
y/n
14
7.9
ja, in Ordnung
yes, that’s OK
4
change
17
9.6
dann machen wir was anderes
Let’s try something different
und zwar hätte ich gern eine
then. I would like a playlist
Playlist mit drei Liedern
with three songs.
others
35
example (original)
19.8 —
translation
no answer, comment aside
Table 6.11: User action types and frequencies as annotated in the data.
In particular, we annotated four types of user actions as shown in Table 6.11. The user
150
Chapter 6. Building a simulated learning environment from Wizard-of-Oz data
can either add information (add), repeat or paraphrase information which was already provided at an earlier stage (repeat), give a simple yes-no answer (y/n), or change to a different topic by providing a different slot value than the one asked for (change). The majority of user speech acts are to add or to repeat information. Topic change and yes-no answers are less common. Instead of providing a simple yes-no answer the users often repeat or paraphrase the information. Note that the speech acts subsumed under others are not (only) out-of-domain utterances (like giving no answer, making a comment aside), but also any user action which is handled by hand-coded strategies in the final system, e.g. the user asking for help, repeat, or quit (see Section 7.1.1). The users also had the option to select an item by clicking on the screen. As clicking only is observed 11 times over the whole WOZ experiments (as discussed in Chapter 5.4), user clicks are subsumed under the action add (adding information).
6.8.3
A simple bi-gram model
We first construct a simple bi-gram model in order to explore quality of the data. Bi-gram (or more general n-gram) models for user simulations are first introduced by Eckert et al. (1997, 1998). An n-gram based user simulation predicts the user action abu,t at time t that is most probable given the dialogue history of system and user actions (see Equation 6.5 where as,t denotes the system action at time t). In practise, data sparsity may prohibit the use of long dialogue histories. Therefore, the full history can be approximated using a bi-gram model by using the Markov assumption, as in Equation 6.6.
abu,t = argmaxau ,t P(au,t |as,t−1 , au,t−1 , ..., au,0 , as,0 )
(6.5)
≈ argmaxau ,t P(au,t |as,t−1 )
(6.6)
Although the bi-gram model only relates one state/feature to one action, it still can result in data sparsity for small data sets. As mentioned before, (Prommer et al., 2006) use bi-gram modelling on small data sets where 53.13% of the state-action pairs have zero frequencies.
6.8. User simulation
151
Figure 6.6: User action frequencies following a system act (bi-gram model): 25% zero frequencies for state-action pairs due to data sparsity
The bi-gram model obtained from our WOZ data and the observed frequencies are shown in Figure 6.6. When examining the distributions of user replies per system turn for the bi-gram model, we can see that in 25% of the state-action pairs have zero frequencies. As discussed in the introduction, user simulations for automatic strategy learning need to cover the whole variety of possible user action for each state in order to produce robust strategies. (Note that for n-gram models the trade-off between coverage and accuracy/data fit is also known as the bias-variance trade-off (Alpaydin, 2004).) We therefore apply two learning methods to deal with data sparsity (for n-gram models): First, we develop a user simulation which is based on a new clustering technique; second, we apply smoothing (which is the standard technique applied to account for zero frequencies in n-gram models).
152
6.8.4
Chapter 6. Building a simulated learning environment from Wizard-of-Oz data
Cluster-based user simulation
In the following Subsection we introduce what we call a “cluster-based" user simulation. This technique allows us to build user simulations from small data sets by summarising similar states. Cluster-based models generate explorative user behaviour which is similar but not identical to user behaviour observed in the data. In contrast to the bi-gram model, where the likelihood of the next user act is conditioned on the previous system action, the likelihood for cluster-based model is conditioned on a cluster of similar system states, see Equation 6.7.
abu,t ≈ argmaxau ,t P(au,t |clusters,t−1 )
(6.7)
The underlying idea is that, with sparse training data, we want user simulations to be “similar to real users in similar situations" but not identical, as we do not want to overfit the data. This user simulation should generate any kind of observed user behaviour in a context (as opposed to the zero frequencies in the bi-gram model), while still generating behaviour which is realistic/ pragmatically plausible in this situation. That is, we want our user simulation to generate behaviour which is complete and consistent with respect to the observed actions. We also want our model to generate actions which show some variability with respect to the observed behaviour, i.e. a controlled degree of randomness. This variance will help us to explore situations which are not observed in the data, which is especially valuable when building a model from sparse training data, cf. (Ai et al., 2007b). Cluster analysis is a un-supervised machine learning technique (see definition Section 2.3.1) which partitions the data into subsets (clusters). In contrast to supervised learning there are no predefined class labels, but the labels are constructed in a bottom-up manner by grouping feature vectors based on their similarity. For building such clusters we apply the Expectation-Maximisation (EM) algorithm. The EM algorithm is an incremental approach to clustering (Dempster et al., 1977), which fits parameters of Gaussian density distributions to the data. The first step, calculation of the cluster probabilities (which are “expected" class values) is “expectation"; the second, calculation of the distribution parameters, is “maximisation" of the likelihood of the (Gaussian) distributions given the data. The EM algorithm was later also applied by Schatzmann et al. (2007c) for their ‘summary-space mapping’ for user simulations.
6.8. User simulation 6.8.4.1
153
Semantic annotation of system acts
Clustering is applied in order to identify more general situations than the previously annotated system speech acts by grouping them according to their similarity. In order to define similarity between system actions, we need to describe their (semantic) properties. In Section 6.3 we explained that for the incremental annotation of system acts we start out with a fine grained scheme of “Clarification Requests" (Rodriguez and Schlangen, 2004; Rieser and Moore, 2005), which is then summarised to a smaller set of more general system acts (cf. Figure 6.2, Section 6.3). We now reverse this process and decompose the system actions into a more detailed semantic description. 7
Figure 6.7: Clustered System Actions
6.8.4.2
Results
The EM algorithm generates three state clusters, as shown in Figure 6.7. The system acts askAQuestion and implConfirm are summarised into cluster 1; explConf and reject are in cluster 2; and presentListVerbal and presentListMM are in cluster 3. For every cluster we assign the observed frequencies of user actions (i.e. all the user actions which occur with one of the states belonging to that cluster), as shown in Figure 6.8. We observe the following differences when comparing the cluster-based frequencies with the ones from the original bi-gram model (see Figure 6.6): First, 7 Note
that such a flexible, tree-based approach to utilise multifunctional and multidimensional dialogue act annotation schemes is also suggested by Bunt (2007).
154
Chapter 6. Building a simulated learning environment from Wizard-of-Oz data
there are no zero frequencies for any of the possible user-system act combinations. The cluster-based user simulation generates the full range of possible user acts in any state, and thus allows to learn robust strategies. Second, the previously 6 states are now summarised into 3 states. Consequently, the cluster-based user simulation will generate the same behaviour for the system acts being in one cluster. 8
Figure 6.8: User action frequencies from the cluster-based user simulation
6.8.5
Smoothed bi-gram user simulation
Smoothing is a standard technique applied to n-gram models to account for zero frequencies observed in the data. Smoothing assigns a non-zero probability to zeroprobability and low-probability n-grams. We implement a simple smoothing technique called “add-one smoothing" (Jurafsky and Martin, 2000). This technique discounts some non-zero counts in order to get probability mass that will be assigned to the zero counts. We apply this technique to the original frequency-based bi-gram model. The resulting model is shown in Figure 6.9. In comparison to the original bi-gram 8 Note
that for each two system acts the user simulation now reacts with the same likelihood. Nevertheless, the learner needs to experience the different consequences/feedback on his actions, in order to learn distinctive behaviour. These differences still do exists by the different effects a user action has on the state space (dependent on the previous system act). These effects are implemented by logical constraints and update rules for system behaviour, as presented in Section 6.5.3. For example, if the user adds new information after implConfirm a slot gets filled and another gets confirmed in the system state space, whereas after askAQuestion a slot only gets filled. These different sate space representations have different expected rewards, thus the strategy learns distinctive behaviour.
6.8. User simulation
155
model the smoothed model has no zero frequencies. In contrast to the cluster-based model, the smoothed model still has 6 distinctive states, but for some state-action combinations the predicted frequencies are still low. We therefore expect this model to produce less exploratory behaviour. Furthermore, the frequency for the non-zero states are modelled from data from a relatively small user population. Thus, this model is more likely to overfit. In general, the smoothed model seems to be closer to the original data than the cluster-based one (thus being more realistic at the expense of allowing less exploratory behaviour). In the next section we introduce an evaluation metric which allows us to assess the level of exploratory versus realistic user behaviour as predicted by the different user simulations.
Figure 6.9: User action frequencies from the smoothed bi-gram user simulation
6.8.6
Evaluation: Simulated User Pragmatic Error Rate
6.8.6.1
Motivation
The evaluation of statistical user simulations is an active research area and many different metrics are suggested by the literature (see discussion Section 6.1.2 and methods listed in Table 6.1). However, none of the suggested metrics gives an indication which user simulation is better suited for testing and which for training. In this thesis we introduce a metric that allows to measure the utility of a user simulation for strategy training as well as for testing. The ability of the user simulation to explore
156
Chapter 6. Building a simulated learning environment from Wizard-of-Oz data
the state space (while still being reasonably close to observed user behaviour) reflects its utility for strategy training. The ability to produce results which are close to real user behaviour (while still allowing for a certain amount of variance) reflects its utility for strategy testing.
6.8.6.2
Method
In the following we evaluate the different user simulations with respect to a proposed Simulated User Pragmatic Error Rate (SUPER). For evaluating user simulations (from small data sets) we don’t want to measure how well we are able to resemble behaviour of an ’average’ user, i.e. we don’t want to measure accuracy in order not to overfit sparse data, but as argued by Schatzmann et al. (2005a) the evaluation must cover aspects of naturalness and variety of user behaviour. Furthermore, we want a mechanism to measure the utility for training and testing: for training we want more varying, for testing more natural user behaviour. In (Schatzmann et al., 2005a) three different aspects (as opposed to measuring accuracy) to evaluate user simulations are suggested: (1) high-level dialogue features, such as dialogue length; (2) dialogue style, such as the frequency of the different speech acts; and (3) success rate and efficiency of the dialogues. These measures were also adapted by (Ai and Litman, 2007; Ai et al., 2007b) While these measures allow a certain degree of variation, none of these features capture whether a user action is appropriate in a certain situation: i.e. that we want a user simulation to show varying behaviour, but also to be complete and consistent for a specific context. A simulated user which is contextually complete is able to generate the full range of actions in a context as observed in the data. A simulated user which is consistent does not introduce actions which were not observed in a specific context. These principles are captured by the SUPER score as described in the following. The SUPER score captures a number of principles similar to the one of Word Error Rate for speech recognition (cf. Equation 6.3), but with variation allowed (cf. the BLEU score for Machine Translation (Papineni et al., 2002)). In order to control the amount of desired variation we introduce two parameters as described in the following. • Variation: The user simulation should behave like the real users but not duplicate the average behaviour with 100% accuracy (in order to account for natural variations in user population). Therefore we define a lower boundary ε
6.8. User simulation
157
which reflects the desired variation (V), and an upper boundary δ which reflects undesired variation. The values ε and δ are used to specify the different needs of testing and training, i.e. weight the need for realistic feedback vs. exploration. • Consistency: The user simulation should not do things that real users wouldn’t do in this context. i.e. it should not generate insertions (I). • Completeness: The user simulation should generate the full range of observed action, i.e. it should not generate deletions (D). These principles are captured by the SUPER score rule set shown in Algorithm 3 where P0 is the observed user action probability for one system action (i.e. a context) and P1 the probability assigned by the simulated user. Algorithm 3 SUPER 1: for user action aui , in a specific context C j do 2:
First check consistency by penalising insertions:
3:
if P0(aui ,C j ) = 0 and P1(aui ,C j ) > 0 then
4:
I := I-1
5:
end if
6:
Then check completeness by penalising deletions:
7:
if P0(aui ,C j ) > 0 and P1(aui ,C j ) = 0 then
8: 9:
D := D-1 end if
10:
Award desired variation:
11:
if |P0(aui ,C j ) − P1(aui ,C j )| > ε then
12:
V := V+1
13:
end if
14:
Tolerate some variation:
15:
if |P0(aui ,C j ) − P1(aui ,C j )| < δ then
16:
V := V+0
17:
end if
18:
Penalise if there is too much variation:
19:
if |P0(aui ,C j ) − P1(aui ,C j )| ≥ δ then
20:
V := V - |P0(aui ,C j ) − P1(aui ,C j )|
21:
end if
22: end for
158
Chapter 6. Building a simulated learning environment from Wizard-of-Oz data
For evaluation we compare the probability for one user action type predicted by the user simulation against the probability of that user action for a specific context observed in the original data. For every instance in the corpus the following steps are carried out (cf. Algorithm 3): We compare the probability distribution of user actions in this context assigned by the user simulation (P1) to the observed probability distribution (P0). For each action in each context we apply the evaluation rules listed in Algorithm 3, and then sum and normalise over actions and contexts, resulting in a SUPER
score. SUPER
=
1 m V +I +D ∑ n m k=1
(6.8)
The SUPER score evaluation technique can be expressed as in equation 6.8, where n is the number of actions in a context (e.g. possible user actions), m is the number of contexts (e.g. number of system action types), and where V, I, and D are defined as above for each context Cm . The SUPER score is defined over [−1, +1].
6.8.6.3
Evaluation Results
For evaluation we compare the cluster-based and the smoothed user simulation against a random model and a majority baseline. The random model is constructed by assigning equal frequency to all four actions. The majority baseline always predicts the most frequent action in one context. The comparison against the random baseline tests the hypothesis that our user simulations are more consistent with the observed data than random behaviour. The majority baseline represents the hypothesis that our user simulation explores a significantly wider range of behaviour than the most frequent user action in one context. The figures in Table 6.12 illustrate the probability distributions for user actions as generated by the different models per previous system action. For evaluation we set the
SUPER
parameters ε and δ according to the different re-
quirements for training and testing. The user simulation employed for training should generate more varying behaviour, thus we set ε = 0.1 and δ = 0.4. The user simulation employed for testing should generate behaviour which is more consistent with observed behaviour, thus we set the parameters more strictly to ε = 0.05 and δ = 0.1. The results are shown in Table 6.13. Both user simulations significantly (p < .001) outperform the majority and the random baseline model. We therefore conclude that both simulations show consistent as well as varying behaviour. The
6.8. User simulation
Table 6.12: SUPER evaluation – User action distributions per system act
159
160
Chapter 6. Building a simulated learning environment from Wizard-of-Oz data
smoothed user simulation shows significantly (p < .001) more consistent behaviour than the cluster-based simulation (for ε = 0.05 and δ = 0.1), whereas the cluster-based simulation shows behaviour which significantly (p < .01) varies more (for ε = 0.1 and δ = 0.4). We therefore choose to train with the cluster-based model and save the smoothed bi-gram model for testing. user simulations: SUPER
parameters
smoothed
cluster
random
majority
ε=.05, δ=.1
59.47
19.15
-4.89
-24.90
ε=.1, δ=.4
-5.74
-0.83
-17.38
-29.90
Table 6.13: SUPER scores
6.8.6.4
Discussion
In sum, the SUPER score allows to measure naturalness and variety of simulated user behaviour. In contrast to previous research measuring these two aspects (Schatzmann et al., 2005a; Ai and Litman, 2007; Ai et al., 2007b),
SUPER
allows us to assess
variance and naturalness in a context-sensitive manner. It also helps to decide whether a user simulation is better suited for training or for testing. The major draw-back of the invented measure is that it only accounts for consistency with respect to specific contexts. In Section 6.8.1 we discussed the need for user behaviour which is also coherent with respect to the dialogue history and the current user goal. The SUPER score does not penalise a “memory-less" user. Another issue with SUPER is that it is sensitive the the size of the initial training corpus (e.g. insertions are more likely to happen if the corpus is small, whereas deletions are less likely). However, this is a general problem which also holds for the evaluation metrics suggested by previous research (cf. list in Table 6.1). In the next Section we explain how we incorporate the current user goal in the simulated user behaviour.
6.8. User simulation
6.8.7
161
Speech Act realisation dependent on the user goal
The user speech acts generated by the user simulations are still on an abstract (semantic) level. In Section 6.7.2 we have already explained how user speech acts get differently realised with respect to the noise model. In the following subsection we explain how the speech acts are realised with respect to the current user goal.
6.8.7.1
Over-answering
Most current dialogue systems allow the user to provide more than one value within the same turn. This is called “over-answering". We model over-answering for our user simulations by realising the speech act add as “provide asked slot value" (prvAsked) and “provide two slots values" (prvTwo) following the frequencies as observed in the data: in 75.12% of the times the user provides only one value, in 23.88% the user provides two values within one turn. The final probabilities for the user simulations, after integrating noise and overanswering, are shown below. Table 6.14 presents the probabilities for the cluster-based user simulation. Table 6.15 shows the probabilities for the smoothed bi-gram model. In each cell, the first number represents the probability assigned by the statistical model, the two numbers below represent how the user actions are realised depending on noise and over-answering. Annotated examples for the user speech acts can be found in the Appendix B.1 and B.3.
6.8.7.2
User goal modelling
In Section 6.8.1 we have discussed that a user simulation should generate behaviour which is consistent with the current user goal. Previous work has addressed the problem in various ways. For example, by constraining the users actions by paths through a graph-based dialogue model (Scheffler and Young, 2001), or by integrating task-based information into the state which conditions the user action, e.g. (Pietquin, 2004; Georgila et al., 2006b). The draw-back of these previous approaches is that a substantial amount for training data is needed to learn user speech acts and goaldirected behaviour in a goal-directed manner. In this thesis we introduce an approach which separates the user goal from learning.
162
Chapter 6. Building a simulated learning environment from Wizard-of-Oz data
system act/user reply
explConf implConfAskASlot askASlot presentListSpeech presentListMM
add
repeat
y/n
prvAsked/prvTwo
same/diff
yes/no
20.1
51.6
20.1
15.3/4.8
36.1 /15.5
11.2/8.8
43.7
35.9
12.2
33.2/10.5
25.1/10.8
8.5/3.7
43.7
35.9
12.2
33.2/10.5
25.1/10.8
8.5/3.7
37.8
37.8
9.0
28.7/9.1
26.5/11.3
6.3/2.7
37.8
37.8
9.0
28.7/9.1
26.5/11.3
6.3/2.7
change
OOV
4.3
4.0
4.2
4.0
4.2
4.0
11.4
4.0
11.4
4.0
Table 6.14: Final probabilities for generating user actions from the cluster based model
system act/user reply
explConf implConf askASlot presentListSpeech presentListMM
add
repeat
y/n
prvAsked/prvTwo
same/diff
yes/no
10.1
21.2
54.56
7.7/2.4
14.8/6.4
38.2/16.4
40.7
32.3
15.7
31.0/ 9.7
22.6/9.7
11.0/4.7
40.2
34.3
13.7
30.7/ 9.6
24.0/10.3
9.5/4.1
33.4
30.2
27.1
25.4/8.0
21.1/9.1
19.0/8.1
38.3
39.9
1.8
29.2/ 9.11
27.9/12.0
1.3/0.5
change
OOV
10.1
4.0
7.3
4.0
7.8
4.0
5.3
4.0
16.0
4.0
Table 6.15: Final probabilities for generating user actions from the smoothed model
The user goal is represented as a record of state-value pairs, corresponding to a (randomly chosen) database entry. Every time the user simulation generates a speech act, the corresponding value is chosen from the goal record, as illustrated in the following example. Let us assume the user’s goal is instantiated with the following database record:
6.8. User simulation
163
genre= Alternative artist= Radiohead user goal: album= In Rainbows title= Videotape Let us also assume that the user already provided the artist and the genre, and the genre is also confirmed. The next slot the system asks for is album name (the system follows the implemented default ordering of slots). The system next tries to implicitly confirm the artist and asks the user to provide a value for album: System: “Searching for music by Radiohead. Which album?" implConf(artist=Radiohead),askSlot(album=?) The possible user actions are instantiated with values from the goal record as in Figure 6.10. The statistical user model then chooses one of these actions according to the probability distributions.
ADD : prvAsked(album=In Rainbows): e.g. “From the album In Rainbows." provideTwo(album=In Rainbows,title=Videotape): e.g. “Videotape from the album In Rainbows." confirmReprovideSame(artist=Radiohead): “Yes, by Radiohead." REPEAT: negateReprovideDifferent*(artist=Red Hot Chili Peppers): “No, by the Chili Peppers." yes-answer(artist=Radiohead): Okay. Y / N ANSWER : no-answer*(artist=Red Hot Chili Peppers): No, I want something else. � � CHANGE : provideOtherSlot(title=Videotape): “The song Videotape." � � OOV: silence Figure 6.10: Example for context-dependent realisation of possible user speech acts
The goal instantiation of the user acts no-answer and negateReprovideDifferent (marked by *) follows special rules. Both of these user actions aim to correct a value which is mis-recognised by the system. The (hypothesised) user goal therefore does not correspond to the represented user goal anymore. In order to model this misalignment, we change the record of the presented user goal by choosing another entry from the database. However, the database search is constrained by the slot values which were already confirmed by the user (as we assume that these are already
164
Chapter 6. Building a simulated learning environment from Wizard-of-Oz data
representing the ‘true’ user goal). This simple mechanism of goal updating allows us to integrate grounding information in the user simulation without having to learn this behaviour from data (i.e. this method is suited for small data sets). For the given example, the entries in the possible subset are all database entries which fulfill the constraint genre=Alternative. Note that we do not aim to model (phonetic) word confusions, but we rather model the effects of mis-understanding on the interaction (as discussed in Section 6.7). Therefore it is possible to randomly choose between the subset of retrieved database entries, not having to consider phonetic similarity. Note that this technique of instantiating the user speech act from a separate goal record was also later introduced by (Schatzmann et al., 2007a,c) under the name “agenda-based models". The major advantage in the approach used in this thesis is that we also model misalignment and grounding. We also do not need to learn the ordering of slot values, as we encode this information in the user speech acts (provideAsked vs. provideOther/change). In addition to the task-based constraints, the user behaviour also follows some logical constraints, similar to the implemented preconditions for system actions (see Section 6.5.3). In particular, we constrain the possible user actions when there is only one hit in the database. In this case, the user simulation can only accept or reject the presented information. In the case where there is only one hit and all the slots are filled and confirmed, the user simulation can only accept (as we assume that for confirmed slots the chance to be mis-recognised is zero and therefore the presented information is identical to the user goal). In sum, this Section presented methods to build user simulations from limited amounts of training data, as well as methods to evaluate and realise them with respect to the current user goal. One simulation is built for training and one for testing dialogue strategies. We also introduced the
SUPER
evaluation metric measuring levels of
variation, completeness, and consistency of the simulated user sactions with respect to the real data. The user simulation which shows more variance is used for training, the user simulation which shows more consistency is used for testing. So far, we have only evaluated individual simulated components (such as the user simulation). In the next Section we introduce the objective function (also known as the “reward" for RL) which is used to evaluate the overall dialogue strategy.
6.9. Reward and objective functions
6.9 6.9.1
165
Reward and objective functions Method and related work
In this thesis we use the two terms “reward function" and “objective function" with slightly different connotations. The term reward function refers to the function which specifies how the dialogue goal is implemented in RL. Recall the definition from Section 2.4: it assigns a scalar reward value which represents the degree to which a state or action is desirable, i.e. it defines a mapping r(d, i) from a dialogue d and a position in that dialogue i to a reward value r. The reward function penalises actions or states which do not contribute to the goal, and rewards actions or states which do. The learner does not try to maximise the immediate reward (which is just a indication of the goal), but the final reward (which is a measure whether the goal was reached). Also see Chapter 2.4. The term objective function is a mathematical term, describing a function associated with a general optimisation problem which determines how good a solution is. It is also used in the context of RL-based dialogue strategy learning, where the term is used to stress the fact that for RL-based dialogue systems the same function can be used for strategy training and as well as for strategy evaluation (Walker, 2005; Paek, 2006). We use the term “objective function" to describe the (abstract) overall goal/ objective of a dialogue. The term “reward function" is used to refer to the concrete implementation of how this goal is expressed. For example, if the objective of a dialogue is to be efficient, the reward function penalises long dialogues, for example by assigning a negative value of −1 to each turn, e.g. (Henderson et al., 2008). The same objective function is used for evaluation, i.e. the efficiency of the learned strategy will be compared against the efficiency of a baseline strategy, e.g. (Lemon et al., 2006a). In contrast to other fields of computational linguistics and speech research which apply optimisation methods (such as speech recognition or spoken language understanding), the objective function for dialogue strategies is less clear. The ultimate goal when building dialogue systems is to satisfy the needs and preferences of real users. However, needs and preferences of real users are often hard to measure and to estimate. For example, users change their needs and preferences dependent on the context (Hu et al., 2007). Furthermore, it is nor clear how to encode/ translate this abstract goal into design principles (e.g. what is the equivalent of a “satisfied user" in terms
166
Chapter 6. Building a simulated learning environment from Wizard-of-Oz data
of implemented system behaviour?). In the following we review dialogue design principles used by previous research, in particular we review different approaches for scoring multimodal presentation in information-seeking dialogue.
6.9.1.1
Scoring information presentation
In most multimodal dialogue systems the number of verbally and multi-modally presented items indicates is scored with respect towards some scoring function. In the following we review some “best practices" for information presentation as suggested by Human-Computer Interaction (HCI) literature, threshold-based strategies implemented in current information-seeking dialogue systems, and work based on RL. There is a substantial amount of literature on HCI which recommends “best practises" for dialogue strategy design (see Chapter 2.2.2). The recommended strategies for information presentation are usually based on universal “human factors", i.e. lower cognitive processes such as perception, attention, and memory capacity. They give general guidelines such as “reduce short-term memory load" (Shneiderman, 1997), as well as very specific suggestions on how many items to present and when to present them. The recommended menu size for spoken output is 3 to 4 items, e.g. (Balogh et al., 2004; Weinschenk and Barker, 2000). For presenting lists on the screen the “magic number"9 is 7+ − 2 items, e.g. (Dix et al., 1998; Herczeg, 1994; Larson, 2003). Furthermore, most of the HCI literature recommends to always use both modalities in parallel. This recommendation is based on the assumption that providing the same information in multiple ways will increase information reception and memorability (following the dual-encoding theory by Paivio (1990) and the Multiple Resource Theory by Wickens (2002)). These guidelines still seem to have a great impact on how information presentation is realised in current multimodal systems, e.g. (Landragin, 2008; Cao and Nijholt, 2008). Information seeking dialogue strategies are often implemented as rule-based systems with hand-coded thresholds. We now discuss two in-car information seeking systems in particular. Varges et al. (2006), for example, only use verbal output. For controlling information presentation they use the following thresholds: fewer than 3 retrieved database items are verbally enumerated, 3 to 8 items are verbally summarised, and for any number higher than 8 the system asks for more constraints. The speech-controlled 9 “The
magic number" refers to a popular study by Miller (1956).
6.9. Reward and objective functions
167
in-car MP3 player by Forlines et al. (2005) in contrast always uses multimodal output for every system turn, which may contain up to 10 items maximum. Multimodal presentation is also addressed in the context of RL-based dialogue strategy learning, e.g. (Heeman, 2007; Levin et al., 2000). Heeman (2007) learns when to display search results using RL, where the reward function assigns increasing negative rewards in the following order: displaying less than 5 items receives 0 reward, 6-12 items gets mildly penalised, 13-30 is penalised more, and showing more than 30 items gets heavily penalised. Levin et al. (2000) don’t report the concrete numbers they use, but report that for a number of retrieved items N “[the cost] is zero for N smaller than a reasonable value, and increases rapidly thereafter, where N depends on the medium used to output information to the user (it is generally small for voice based communication, and higher for display)." In sum, previous work scored information presentation according to hand-coded heuristics, which (at best) are based on “best practises" recommended by HCI literature. One contribution of this thesis is a more principled approach to model the scoring function for information presentation, in contrast to the heuristics used by previous research. We use this function as a reward to automatically optimise dialogue strategies. It is obvious that multimodal presentation should always depend on the available screen size, and media allocation should also depend on the cognitive load of the driver, as discussed in Chapter 2.6 (also see (Becker et al., 2006)). In this thesis we assume fixed screen size (namely the one used in the experiments), as well as a constant cognitive load for the driver. In the following we first review different methods of how the reward function is determined in previous work on RL-based dialogue strategy learning.
6.9.1.2
Setting the reward function for dialogue strategy learning
A variety of techniques and measures are applied for setting the reward function for RL-based strategy learning. For model-based learning the reward can be directly read off from the data. For example, Singh et al. (2002) employ a binary reward measuring task completion for the NJFun system. Or alternatively, user scores from the questionnaires can serve as a reward, e.g. (Spitters et al., 2007). That is, modelbased RL has a realistic judgement associated with each dialogue in the training data.
168
Chapter 6. Building a simulated learning environment from Wizard-of-Oz data
For simulation based learning however, the reward function cannot be read off from the data, but needs to be explicitly set, as we only have simulated dialogue and no real users rating the system. Most current research manually constructs a reward function where the reward is represented as the weighted sum of task success, dialogue length penalty, and mis-recognition as a reward function, e.g. (Levin et al., 2000), (Prommer et al., 2006), (Frampton and Lemon, 2006), (Pietquin and Dutoit, 2006b). Setting these features and their respective weights by hand is usually done in a similar fashion as iterative threshold setting (as described in Chapter 3.3): the dialogue designer manually tunes the values until it allows to learn the desired behaviour. 10 This is why the reward function is also called “the most hand-crafted aspect of Reinforcement Learning" (Paek, 2006). However, it seems that setting a reward function by hand is non-trivial and the resulting strategies do not necessarily seem to reflect real user preferences. To date only Frampton (2008) can report on improved user satisfaction for RL-based policies. Other user studies only report on improved dialogue performance measures (such as dialogue length), but user scores do not significantly improve, e.g. (Singh et al., 2002), (Lemon et al., 2006a), (Prommer et al., 2006). In this thesis we design a reward function that reflects real user preferences by learning a model from data using the PARADISE framework (see description Section 2.2.2). To the author’s knowledge only Walker et al. (1998a); Walker (2000) and Henderson et al. (2005, 2008) utilise a reward function obtained from data.
6.9.1.3
Discussion of the PARADISE framework
PARADISE
has become a “de-facto standard" (Möller et al., 2007) for evaluating
spoken dialogue systems. However, various aspects of the PARADISE framework have been questioned by previous research: In general, models obtained by PARADISE only fit the data poorly (R2 ≈ 0.4) (Möller, 2005a; Möller et al., 2007).
PARADISE
utilises
linear regression, which is a form of Supervised Learning. For a supervised model the following parameters can cause a low data fit: inadequate target variable, missing 10 For
example, Prommer et al. (2006) hand-tune their reward function as follows. It is known from the user questionnaires that user prefer a dialogues in a range of 4 to 6 system turns. In order to adequately configure the trade-offs between the features in the reward function they iteratively test and design, until the reward function allows to learn dialogues which are 4-6 turns long.
6.9. Reward and objective functions
169
input features, lack of training data, and a wrong bias (Alpaydin, 2004). We discuss these factors in the following. The target variable of the regression model is the subjective user rating which should be predicted. In the original framework the target variable is “User Satisfaction" which is constructed by summing over different scores as obtained from a user survey. However, Hone and Graham (2000) argue that the resulting number is meaningless, as taking the sum over differet scores could only be justified on the basis that all items measure the same underlying construct (which can be determined by a factor analysis). Thus, in recent work often only a single target variable is used, e.g. (Möller, 2005b,a; Hajdinjak and Mihelic, 2006; Möller et al., 2007; Skantze, 2007a). Möller (2005b,a); Möller et al. (2007) also experiment with many different input features. They find that from a large set of potential dialogue performance measures only few correlated (weakly) with user judgements. Thus, finding predictive factors is non-trivial. Furthermore, the selected input features also clearly depend on the chosen target variable. These results confirm that setting a reward function is non-trivial when done by hand. Möller et al. (2007) also investigate the influence of the size of training data. Surprisingly, more training data only resulted in a very slightly increased model fit. Another factor which can cause low model fit is a wrong model bias, i.e. the assumptions made by a certain machine learning technique do not match the nature of the problem as represented in the data. (This problem is also shortly discussed in (Engelbrecht and Möller, 2007).) In this thesis we apply a modified version of the PARADISE framework and use it for reward modelling. We make the following changes in particular: • We use a single target variable, namely Task Ease. • We use a hierarchical reward model, reflecting the structure of the task for learning. • For the information presentation phase we design a non-linear reward function.
170
6.9.2
Chapter 6. Building a simulated learning environment from Wizard-of-Oz data
Linear regression for information acquisition
First of all, we construct the overall reward function using multiple linear regression as done by the standard PARADISE framework. In contrast to the standard PARADISE framework we set the target variable to be predicted to a single dimension, namely Task Ease. We choose Task Ease as target outcome for the following reasons. First, Task Ease is significantly correlated with most of the other questions from the WOZ user questionnaire (see Chapter 5.4.2). For example, Task Ease is significantly correlated with overall User Satisfaction (Spearman’s ρ = .840, p < .01) and Future Use (Spearman’s ρ = .475, p < .01). 11 Thus, Task Ease can be seen representative for other dimensions of user satisfaction. Furthermore, measures like Task Ease and Task Efficiency are most important for task oriented dialogue, according to the principle of the least effort (Clark, 1996) which says: “All things being equal, agents try to minimize their effort in doing what they intend to do". Finally, we intend our reward function to have a hierarchical structure, where the multimodal score of the presentation phase is a predictive factor for the overall reward. Taking Task Ease as the target variable allows us to construct such a model where the multimodal score is included in the overall regression model. Task Ease is constructed by taking the average of two user ratings on a 5-point Likert scale. The ratings from the following two questions are averaged (see Appendix A.4, translated from German): 12 1. The task was easy to solve. (question 2) 2. I had no problems finding the information I wanted. (question 6) 11 Spearman’s
rank correlation coefficient is used to measure correlation between two variables at the ordinal level. Spearman’s ρ is the the non-paramatric equivalent to Pearson product-moment coefficient. 12 We take the average of several questions to construct the Task Ease dimension, rather than only taking one single question. We do this in order to meet the assumptions made by the linear regression model. In linear regression input and target variables are assumed to be on a (at least) interval scale. The results from Likert-scales, however, are typically ordinal. By taking the average of several ordinal values we aim to approximate interval scale (see http://en.wikipedia.org/wiki/Likert_scale (22. April 2008) for a discussion). Note that the recommended method to construct dimensions from user questionnaires is via Factor Analysis (Hone and Graham, 2000; Möller et al., 2007). Nevertheless, we simply picked the corresponding questions by hand . One of the reasons was that In contrast to Hone and Graham (2000) or Möller et al. (2007) we did not perform a Factor Analysis to identify dimensions like Task Ease, but picked the corresponding questions by hand, which will be corrected in future work.
6.9. Reward and objective functions
171
For model selection we used stepwise linear regression. This technique combines forward and backward feature selection. Only feature which are significant predictors of the target variable are included in the model. Furthermore, we only choose input features which are not correlated with each other, (as two correlated variables explain the same variance in the model and thus hinders each other from being selected by stepwise regression). For example, dialogue duration (as measured in seconds) is positively correlated with dialogue length in turns (Pearson’s correlation r = .536, p < .01). Therefore dialogue duration is not entered into the model. The following dialogue performance measures are used as input feature to the stepwise regression model (see Section 6.4.3.1 for a more detailed description of these features): • Dialogue length in turns (dialogueLength) • Average corruption rate of the user input (delHist) • Task completion (manually annotated, see Blaylock et al. (2006)) • Multimodal score from user questionnaire (also see next Section) The resulting model selects dialogue length, task completion, and the multimodal user score, as shown in Equation 6.9. Dialogue length is a strong negative predictor, while task completion and multimodal score are positive predictors of the perceived task ease. 13
TaskEase = −20.2 ∗ dialogueLength + 11.8 ∗ taskCompletion + 8.7 ∗ multimodalScore; 13 It
(6.9)
is interesting to note, that the number of deleted (“mis-recognised") words did not influence the perceived Task Ease, where for most other studies the mean recognition score is one of the most prominent features, e.g. (Walker et al., 2000; Williams and Young, 2004a; Skantze, 2005; Möller et al., 2007). This might be an artefact of the fact that in a WOZ study the understanding of the human wizard was hardly affected by the corrupted input (only 30% of the corrupted utterances lead to a (noticeable) communication error, see Section 5.2.3). Similar results are reported by Hajdinjak and Mihelic (2006) when using WOZ data for PARADISE. Hajdinjak and Mihelic argue against including ASR-realted features in the regression model, as it’s influence on user ratings is so dominate that it hinders other relevant parameters to enter the regression model, and therefore it should be excluded altogether. We (partially) agree, as in a sense, it should be obvious to the designer that improving speech recognition quality improves user satisfaction. Thus, by including ASR measures into the regression not much would have been gained. On the other hand, ASR features are an important factor when optimising error handling strategies. For our task however, the PARADISE regression model as in Equation 6.9 contains all the relevant information.
172
Chapter 6. Building a simulated learning environment from Wizard-of-Oz data
The overall model fit is low (R2 = 0.144, R2ad justed = 0.123). 14 Despite the low fit to the initial data, it generalises well to unseen events, as we will show in Chapter 8.3
6.9.3
Non-linear rewards for information presentation
The results from feature selection now allow us to formulate the reward for the information presentation phase as a simple two-way relationship between two variables. In Section 6.4.3.2 we found that the wizards’ information presentation strategy is based on the number of retrieved items from the database (the DB feature). In order to design the reward function for information presentation we relate the number of presented DB items (independent variable) to the multimodal score from the user questionnaires (dependent variable). The multimodal score is measured by taking the average of the user ratings for the following questions (see Appendix A.4, translated from German): 1. I liked the combination of information being displayed on the screen and presented verbally. (question 18) 2. Switching between modes did not distract me. (question 22) 3. The displayed lists and tables contained on average the right amount of information. (question 21) 4. The information presented verbally was easy to remember. (question 14) The questions are rated on 5 and 3-point Likert Scales, and the scores are normalised for taking the average. For model selection we use curve fitting (also known as non-linear regression). Curve fitting is used when the relationship between two variables can also be non-linear. It allows us to choose the model/curve which is closest to the data. In contrast to linear regression, curve fitting does not assume a linear inductive bias, but it selects an appropriate inductive bias by function interpolation. The simplest model with the best data fit is the one which gets selected (due to Occam’s razor). The following models are fitted to the data – first relating verbally presented items to the multimodal score and then relating items presented on the screen to the multimodal score: 14 R2
R2
indicates how much variance is explained by the model; in this case 14.4%. Adjusted is a modification of R2 that adjusts for the number of explanatory terms in a model.
6.9. Reward and objective functions
173
• Linear (Y = b0 + (b1 × t)) • Logarithmic (Y = b0 + (b1 × ln(t))) • Inverse (Y = b0 + b1 t ) • Quadratic (Y = b0 + (b1 × t) + (b2 × t 2 )) • Cubic (Y = b0 + (b1 × t) + (b2 × t 2 ) + (b3 × t 3 )) • Power (Y = b0 × (t b1 ) or ln(Y ) = ln(b0) + (b1 × ln(t))) • Compound (Y = b0 × (b1t ) or ln(Y ) = ln(b0) + (ln(b1) × t)) b1
• S-curve (Y = e(b0+( t
))
or ln(Y ) = b0 + ( b1 t ))
• Logistic (Y = 1/( 1u + (b0 × (b1t ))) or ln( 1y − 1u ) = ln(b0) + (ln(b1) × t) where u is the upper boundary value) • Growth (Y = e(b0+(b1×t)) or ln(Y ) = b0 + (b1 × t)) • Exponential (Y = b0 × (eb1×t ) or ln(Y ) = ln(b0) + (b1 × t))
The best fitting model for relating the verbally presented items is a linear decreasing line (R2 = 0.24, R2ad justed = 0.21) assigning positive values to all strategies which present fewer than 4 items verbally, and a negative value to all strategies which present 4 or more items verbally (see Equation 6.10 where x is the number of presented database items, and see Figure 6.11). Note, that in the WOZ experiments the wizards never present more than 3 items verbally. For training the policy (where unseen state spaces also need to be explored) we extrapolate the fitted line to model unobserved behaviour. The best fit for the wizards’ multimodal strategy is a quadratic model (R2 = 0.12, R2ad justed = 0.103), (see Equation 6.10 and Figure 6.11). The resulting model assigns a maximal score to a strategy displaying 14.8 items (curve inflection point). For items higher than 30 it assigns negative values (intersections with x-axis at x1 = −0.1, x2 = 29.63). The two reward functions intersect at x1 = 2.62, x2 = 57.98.
( multimodalScore+ =
Verbal(x) = 5.259 + (−0.932 × x)
for x : [1, + inf[
MM(x) = 0.705 + 0.886 × x − 0.03 × x2
for x : [1, + inf[ (6.10)
174
Chapter 6. Building a simulated learning environment from Wizard-of-Oz data
reward function for information presentation 10
multimodal presentation: MM(x) verbal presentation: Speech(x)
0
turning point:14.8
-10 intersection point
user score
-20 -30 -40 -50 -60 -70 -80 0
10
20
30
40
50
60
70
no. items
Figure 6.11: Evaluation functions relating number of items presented in different modalities to multimodal score
Again, the fit to the initial data is rather low (other studies report on R2 up to 0.47). Nevertheless, these models make accurate predictions, as we will show in Section 8.3.
6.9.4
Final reward
Finally, we integrate the obtained models into one (hierarchical) reward function for learning. The final reward is calculated as in Equation 6.11a – 6.11d. The overall reward, as calculated at the end of each dialogue, corresponds to the reward for information acquisition, see Equation 6.11a. It is computed as follows. After each system turn the the dialogue length receives a penalty of (−1), see Equation 6.11b. The task completion is calculated according to the noise model, see Equation 6.11c, where Pc is the probability of a confirmed slot being correct, and P f is the probability of a filled slot being correct, where C and F are the number of confirmed slots and filled (but not confirmed) slots respectively. A more detailed explanation of how task completion is calculated can be found in Section 3.2.5.
6.9. Reward and objective functions
175
reward = 20.2 × dialogueLength + 11.8 × taskCompletion + 8.7 × multimodalScore;
(6.11a)
dialogueLength = numberO f Turns × (−1);
(6.11b)
taskCompletion = 10 × (Pc)C × (P f )F ;
(6.11c)
multimodalScore = Verbal(x) + MM(x);
(6.11d)
We illustrate how the final reward is calculated in the following examples. In the dialogue in Appendix B.2, Table B.3 the Supervised Learning policy receives a final reward of -18701.43. Following the equations above, this is calculated as follows. The dialogue is 7 turns long. Thus the length penalty is 20.2×[7×(−1)] = −141.4. All the slots are filled and confirmed. Thus the task completion is 11.8×[10×(1)4 ×(0.3)0 ] = 118. In the dialogue 142 items are presented multimodally and 1 item is presented verbally. Thus the multimodal score is 8.7 × [4.33 − 2151.23] = −18678.03, where Verbal(3) = 5.259 + (−0.932 × 3 = 4.33); MM(142) = 0.705 + 0.886 ∗ 142 − 0.03 ∗ 1422 = −2151.23. An example of a dialogue strategy which is rated high under this reward function can be found in Appendix B.3, Table B.8. Here the user immediately asks for a song called “Polly", for which two alternatives are found in the database. These alternatives are presented verbally (Verbal(2) = 3.4) and the user selects one of the options (Verbal(1) = 4.33). This results in a dialogue which is 3 turns long (lengthPenalty = 20.2 × (−3) = −60.6) and the task is fully completed (complVal = 118). The final reward for this dialogue is 124.6, which is close to the maximal possible reward which is 158.10. This maximal reward is achieved when the user immediately provides a slot value for which 15 items can be retrieved in the database. The system immediately presents multimodaly (MM(15)=7.25) and the user selects an item. Then, the system presents verbally (Verbal(1)=4.33), and the user confirms. This “optimal" interaction results in a dialogue which is 3 turns long (lengthPenalty = −60.6), where all the filled slots are confirmed (taskCompletion = 118). The learned policy in Appendix B.3, Table B.7, for example, almost achieves the maximal possible reward. To the author’s knowledge this thesis is the first to learn with non-linear reward functions. This also imposes new challenges for the RL framework. In the next Section we describe prerequisites for learning with non-linear reward functions.
176
6.10
Chapter 6. Building a simulated learning environment from Wizard-of-Oz data
State-space discretisation
We now explain why explain why we had to discretise the state space in order to facilitate learning with non-linear reward functions. The state space feature DB (representing returned database hits) is on linear scale. However, for information presentation substrategy learning it is discretised into 3 bins (low-medium-high), as mentioned in Section 6.5.3. The disrcretisation is necessary in order to learn with non-linear reward functions for the following reasons: The applied RL method applies linear function approximation which learns linear estimates between state-action pairs (s, a) and expected reward values (see Section 2.4.2.3). That is, it either can learn that “more is better and less is worse" (or the other way round). The reward for information acquisition though is non-linear (see Section 6.9.3) and thus it is problematic to learn linear estimates. We therefore quantise the database feature into 3 bins, taking the first intersection point between verbal and multimodal reward and the turning point of the multimodal reward as discretisation boundaries. In previous work it is common practise to quantise the database feature. Pietquin (2006) manually splits the number of retrieved database items into two bins (high-low). Levin et al. (2000) use 4 bins, and Heeman (2007) 5 bins. This discretisation is usually done by simple heuristics. The above quantisation technique in contrast, is more principled as it reflects user preferences for multi-modal output. Furthermore, database items in previous work are not only quantised in the state-space, but also in the reward function, resulting in a direct mapping between quantised retrieved items and discrete reward values. Our final reward function in contrast still operates on the continuous values (the features are only quantised in the state space), which allows are more flexible mapping, i.e. the quantisation boundaries are more flexible and don’t act as strict ‘thresholds’. In addition, the state space is still continuous for the decision when to present a list (information acquisition phase). In future work we will explore an alternative approach to handle non-linear reward functions.
REALL
allows to bind combined features values to a new variable. For
non-linear rewards, for example one can construct a new state variable that is the quadratic function of the number of database hits (DB2 ). The learned estimator is still a linear function of features, but the complexity is wrapped up in the new feature. Although this feature engineering technique is theoretically and technically sound, we were not able to learn optimal strategies in this setup. In future work we will further
6.11. Learning experiments
177
explore this option, first testing the idea in a less complex setup.
6.11
Learning experiments
We now have described all the necessary components of a simulated environment. We are now going to use this environment to train and test a information-seeking dialogue strategy. We first train the policy using the SHARSHA algorithm (Section 6.11.1). We then test the strategy using a different user simulation. We compare the performance of the RL-based policy against the supervised baseline (Section 6.11.2). And finally, we implement the learned strategies into a table-look-up (Section 6.11.4).
6.11.1
Training with
SHARSHA
The policy is trained by interacting with the cluster-based user simulation, as discussed in Section 6.8.6.3.
15
We use the REALL-DUDE environment (Lemon et al., 2006c)
for learning (see Section 6.5.2).
REALL
combines Reactive Planning and Hierarchical
RL (Shapiro, 2001), as explained in Section 6.5.3. Hierarchical RL is implemented using the SHARSHA algorithm (for State Hierarchy, Action, Reward, State Hierarchy, Action) (Shapiro, 2001; Shapiro and Langley, 2002; Langley et al., 2004). The SHARSHA
algorithm adds hierarchical structure to the well known SARSA algorithm
(see explanation in Section 2.4.2.2). For learning we use the following parameters (for a description of these parameters see Section 3.4.1): • numberOfCycles = 180k • learning rate α = 0.2 • discount rate γ = 0.95 • eligibility trace parameter λ=0.9 • exploration halving time ε= 16 × numberO fCycles = 30k 15 A
training run using the smoothed user simulation confirms our hypothesis: the learner gets stuck in local minima and does not discover the optimal policy due to a lack of exploration.
178
Chapter 6. Building a simulated learning environment from Wizard-of-Oz data
The policy is trained over 180k system cycles, which results in about 20k simulated dialogues. The two figures in Table 6.16 show a training run, where the graph on top shows the whole run for over 20k dialogues. The picture below zooms-in in the area between 5k and 13k training cycles, where the learner converges towards the optimal policy. The policy learns to reduce dialog length (black, -1 per turn) and database hits presented multimodal (pink, +1 per item) and presented verbally (blue, +1 per item) while getting a high task completion (green). Average dialogue reward, computed over windows of 50 dialogues, is shown in red.
6.11.2
Results for testing in simulation
We test the RL and SL baseline policy by running 500 test dialogues in simulation. We then compare quantitative dialogue performance measures performing a paired t-test (as we operate on continuous values on an interval scale). In particular, we compare mean values of the final rewards, number of filled and confirmed slots, dialog length, and items presented multimodally (no. items MM) and items presented verbally (no. items Speech). The ultimate evaluation is testing the dialogue policy with a user simulation which wasn’t used for training (Paek, 2006), which is in our case the smoothed user simulation. However, we decided to test with both user simulations the the smoothed user simulation as well as with the cluster-based user simulation (which we previously used for training) in order to compare the results. Our results show that for both RL and SL policy, there is no significant difference in the performance for the different user simulations (as measured in a independent t-test across user simulations, comparing RL to RL and SL to SL). Also see mean performance measures in Table 6.17 where the standard deviation is indicated by ±. The non-significant results for SL only indicate that it performs comparably badly for both user simulations (in addition the wide deviation of results might prohibit the differences to be significant). The similar good results for testing the RL-based strategy, in contrast, indicate that the learned strategy transfers well to less noisy situations. In other words, a strategy which is trained with the cluster-based user (which introduces more variance), performs well with the smoothed model (which is more realistic). Recall that variance and realism was measured by the SUPER score in Section 6.8.6). This is in line with results by Lemon and Liu (2007) which show that
6.11. Learning experiments
179
Table 6.16: Learning curve for training: whole training run (top), zoom-in between ca. 5k and 13k dialogues (bottom)
180
Chapter 6. Building a simulated learning environment from Wizard-of-Oz data
strategies trained on noisy conditions transfer well to situations with less noise. RL performs significantly better (p < .001) than the baseline strategy for both user models. The RL-based policy gains on average 50-times more reward when tested in simulation. The RL-based policy results in significantly shorter dialogues, where significantly fewer slots get confirmed, while about the same number of slots get filled. Furthermore the difference for the number of items presented verbally is also non-significant. Both RL and SL strategy settled on a threshold of less than 4 items for verbal presentation. policy/measure
cluster userSim
smoothed userSim
SL
RL
SL
RL
-1898.9
36.1
-1747.3
37.3
(±5629.5)
(±54.0)***
(±5527.6)
(±54.5)***
dialog length
8.6 (±3.3)
6.3 (±2.8)***
8.7 (±3.7)
6.3 (±3.1)***
filled slots
3.7 (±.7)
3.7 (±.7)
3.3 (±0.9)
3.2 (±1.0)
confirmed slots
3.7 (±.9)
2.3 (±1.1)***
3.5 (±1.1)
2.2 (±1.2)***
items Speech
1.1 (±.23)
1.1 (±.31)
1.1 (±.28)
1. (±.31)
items MM
59.34 (±73.9)
10.96 (±2.5)***
59.78 (±74.2)
11.5 (±2.2)***
overall reward
Table 6.17: Comparison of mean performance for learned and WoZ policies testing with a cluster-based and a smoothed user simulation (with standard deviation ±); *** denotes statistical significance at p < .001
The major strength of the RL policy compared to the SL strategy is that it learns the optimal trade-off between dialogue length (asking for more constraints) and presented items. It learns to keep the dialogues reasonably short (on average 6.3 system turns for RL versus 8.6 turns for SL) by presenting lists as soon as the number of retrieved items is within tolerance range (as reflected in the reward function). The SL strategy in contrast has not learned an upper boundary for displaying items on the screen. In sum, the results show that Reinforcement Leaning with an environment bootstrapped from WOZ data allows to learn robust strategies which significantly outperform strategies mimicking wizard behaviour in a supervised manner. In contrast to Supervised Learning, programming by reward allows to provide additional information in the reward function about which strategy behaviour (as present in the initial data) needs to be improved. Hence, RL allows to learn a policy which reflects the user preferences. In addition, RL also generalises to unseen situations as it explores the state-action
6.11. Learning experiments
181
space during training. In the next Section we give a qualitative description of the learned strategy.
6.11.3
Qualitative strategy description
In the following we give an example-based description of the RL-based and the SLbased strategy. We show that both policies originate from the same WOZ data set. We also give examples how the additional about user preferences (as obtained from the user ratings and modelled in the reward function) helps RL to rule-out the weak strategies in the data, whereas SL just mimics the data. The example dialogues can be found in Appendix B.1 and B.2. We first describe different strategies for information presentation. In the WOZ experiments the wizards display very long lists on the screen. In the WOZ dialogue in Table B.1, for example, the wizard displays a list with 142 items (Wizard: “The song is retrieved. There are 142 different versions." [Table with 142 entries is shown on the screen.]). This presentation strategy was rated low by the user (timing:2, mmPresentation:1, verbalPresentation:3). For RL-based strategy learning, these ratings are used to estimate the reward function with the PARADISE framework, as explained in Section 6.9.3. The SL policy in contrast only mimics the wizard’s behaviour. In the simulated dialogue in Example 6.12 and Table B.3, the SL policy also displays 142 items to the user (immediately after the user provided the first constraint). Here the number of current search results is shown by “db:”.
182
Chapter 6. Building a simulated learning environment from Wizard-of-Oz data
(6.12) SL policy:
greet (db:438)
sim.User: prvAsked-->genre(Rock) SL policy: implConf(genre),AskASlot(artist) (db:142) sim.User: confirmAndReprvSame-->genre(Rock) SL policy:
present[mm] -->genre (db:142)
sim.User: change-->artist(Jimi Hendrix) SL policy: implConfAskASlot-->artist, album sim.User: prvAsked-->album(Experience Hendrix: The Best of Jimi Hendrix)} SL policy: implConfAskASlot-->artist, album (db:4) sim.User: prvAsked-->song-title(Voodoo Child) SL policy: explicitConfirm-->song-title (db:1) sim.User: confirmAndReprvSame-->song-title(Voodoo Child) SL policy:
present[verbal] (db:1)
sim.User: yes-answer-->yes(yes) The RL policy in contrast learns to wait and first gather more constraints until an adequate number of items is retrieved. In the simulated dialogue in Example 6.13 and Table B.4 the RL policy displays 14 items, which according to the reward function, is gains the highest multimodal reward. (6.13) RL policy: greet (db: 438) sim.User:
prvAsked-->artist(Nirvana)
RL policy: implConf(artist)AskASlot(album) (db:26) sim.User: prvAsked-->album(MTV Unplugged) RL policy: present[mm] -->artist, album (db:14) sim.User: click-->song-title(On a Plain) RL policy: present[verbal] (db:1) sim.User: yes-answer-->yes(yes)}
We now describe different strategies for information acquisition and show how the RL and SL policies both originate from the WOZ data set. In the WOZ study the wizards sometimes fail to present results early enough in the information acquisition phase. In the WOZ dialogue Table B.2 in Appendix B.1, for example, the wizard does not present the retrieved items until the user explicitly asks
6.11. Learning experiments
183
to see the list (Wizard: “I am searching... I found four songs with only ‘Smile’ as the title."; User: “Very well then, why don’t you show it?"). The wizard then shows a list of 4 items, which the user rates with the maximal score (mmPresentation). Task Ease and presentation timing, however, are rated low (TaskEase : 2,timing : 3). The SL policy in the simulated dialogue in Example 6.12 (also see Table B.3 in Appendix B.2) replicates this behaviour and fails to present the retrieved items over several turns as well, even though the number of retrieved database items is already fairly low in the beginning (4 items are retrieved after the third turn). The RL policy in contrast learns to present as soon as the number of retrieved items is adequate for verbal or multimodal presentation. In the simulated dialogue in Example 6.13 (also see Table B.4 in Appendix B.2), for example, the RL policy displays 14 items on the screen in the third turn of the dialogue. In the simulated interaction in Example 6.14 (also see Table B.5) the RL policy presents 2 items verbally in the third turn. This action choice corresponds to the wizard’s behaviour in Table B.1 in Appendix B.1 (Wizard: “The song exists by ‘Eric Clapton’ or by ‘Eric & the Dominos’."), where the verbal presentation was rated high by the user (presentVerbal : 3). (6.14) RL policy: greet (db: 438) sim.User: prvAsked-->artist(Bob Dylan) RL policy:
implConf(artist)AskASlot(genre) (db:56)
sim.User: change-->song-title(Hurricane) RL policy: sim.User: RL policy:
present[verbal] -->album1,album2 (db:2) prvAsked-->album(Desire) present[verbal] -->artist, album, song-title (db:1)
sim.User: yes-answer-->yes(yes)
In sum, the dialogue examples demonstrate how information from the WOZ data is used by the different learning mechanisms: One major advantage of RL is that it allows us to provide additional information about user preferences in the reward function, whereas SL simply mimics the data.
184
Chapter 6. Building a simulated learning environment from Wizard-of-Oz data
6.11.4
Strategy implementation
The RL strategy has been operating in simulation so far. For strategy testing in the simulated environment, we set the RL agent’s learning rate to be zero. The Dialogue Manager calls the agent each time a strategy decision is needed. The same approach can be taken when integrating the learned strategy into a working dialogue system, e.g. by wrapping REALL as an OAA agent. A similar method has been used by e.g. (Lemon et al., 2006a) However, this method has been criticised as being a “black box which tells the system what to do" (Paek, 2006). Paek claims that for this reason, RL-based dialogue design is less attractive for industry, as it takes away the control from the system designer and makes it hard to change the strategy if required. An alternative method for strategy implementation is to transfer the learned strategy into a table, where the Dialogue Manager can look-up which action to take in which state. This method has also been used by previous research, e.g. (Walker, 2000; Singh et al., 2002). Both methods are appropriate under different circumstances. Implementing the strategy as an RL OAA agent has the advantage that it can handle large state-action spaces (given that the implemented algorithm is able to do so). Furthermore, the system has the option to learn online (i.e. while it is employed). Online learning has the major advantages that it can adapt to the individual user and also can constantly adapt to changing environmental conditions. However this kind of implementation faces the criticism of being a ‘black box’. The look-up table implementation, in contrast, is a clear and detailed description of what was learned, which allows the dialogue designer to understand and, if needed, change the policy. However, a table-look-up easily becomes intractable for large state-action spaces. 3
For the given strategy learning problem there are 4112,128 + 22 theoretically possible policies (see Section 6.5), the number of policies which are practically possible in the concrete application environment is much lower. This is due to the following constraints. First, preconditions (which are implemented as ISU rules) prohibit stateaction combinations which are inconsistent with the system logic (see Section 6.5.4). In addition, the possible values for the number of retrieved items (DB) are limited by the semantic relations between the database and the provided constraints, i.e. there are restrictions by the given “ontology". In our database, for example, there are only 3 genres (see Section 6.2). That is, if the only constraint provided by the user is ‘genre’
6.11. Learning experiments
185
there are only 3 possible partitions of the database, and the DB feature can only take the values DB = {175/142/34}, i.e. for “Blues" 175 items are retrieved, for “Rock" 142, and for “Alternative" 34. 16 The same is true for the other slots values and their combinations. For example, in our database an album contains 4-14 songs, and a song can be maximally quadruply ambiguous (see Section 6.2). Hence, the retrieval behaviour of the underlying database does influence strategy learning (as also shown in Chapter 3.2.2 by simulating different retrieval methods). The constraints from the database, together with the ISU update rules, leave us with a restricted set of possible state-action combinations, which is sufficiently small for a table-look-up implementation. As we (currently) do not learn online, we prefer this approach as it is easy to inspect and understand for the system developer as well as for the reader of this thesis. In total the learned strategy has 371 state action pairs as shown in Appendix C. This list is constructed by running the DUDE - REALL system in test mode (i.e. with zero learning and exploration rate). We generate a corpus of over 5k simulated dialogues, where we also log the corresponding system state. From this corpus we extract all possible state-action combinations. After ordering the state-action space (starting with no slots filled), one can observe stable patterns, as shown in the table in Appendix C. On an abstract level the state-action mappings can be described as in Algorithm 4. Of course, there are several context-specific exceptions from the general rule set. For example, the preferred confirmation act is an implicitConfirm. An exception is the case where the user has already provided the song name (slot4). The system then explicitly confirms rather than implicitly confirms, in order to end the dialogue as soon as possible. Note that strategies which are sensitive to the different semantic qualities of slots types can only be learned with a binary representation of slot state features (as discussed in Section 6.4.2). Furthermore, if there are too many slots which are filled but not confirmed, the system tries to get the user to confirm first, although the number of retrieved items may be already small enough to present. 16 Note
that for our simulated retrieval model in Section 3.2.2 did not encode such domainspecific constraints and therefore a larger policy space had to be explored.
186
Chapter 6. Building a simulated learning environment from Wizard-of-Oz data
Algorithm 4 Highlevel − Description − LearnedStrategy Require: An integer DB ≥ 1. 1: DB ⇐ number of retrieved database hits 2: repeat 3:
gather constraints by implConf whenever allowed by the system logic
4: until DB ≤ medium 5: if DB = low then 6:
return presentSpeech
7: else if DB = med then 8:
return presentMM
9: end if
6.11.5
Discussion and error analysis
In this thesis we have formalised the dialogue strategy problem as being task-independent, i.e. the user simulation as well as the system utilise a separate task model and discourse model. Only the discourse behaviour is learned, whereas the task model is set by hand following a default ordering (see Section 6.5.4). These types of model separation for Dialogue Management gained popularity in the dialogue management community (Xu and Rudnicky, 2000; Lemon et al., 2002; Bohus and Rudnicky, 2003; Lemon and Liu, 2006), as well as for user simulation (Schatzmann et al., 2007a,c). In the following we show the advantages and disadvantages of this separation for strategy learning.
6.11.5.1
Consistent user behaviour
In this thesis we introduce a separate user goal as an extension to simple bi-gram models. The bi-gram model is learned from data and generates discourse behaviour, while the user goal is defined as a record with default ordering (see Section 6.8.7). We illustrate the advantages of this separation in the following. Previous work has criticised bi-gram to be “memory-less" (see Section 6.8.1), e.g. (Schatzmann et al., 2005b; Pietquin and Dutoit, 2006b). 17 However, introducing a 17 Note
that our cluster-based user model (theoretically) allows to include dialogue history features, which enables this model to produce history-sensitive behaviour. In related work we show that cluster-based models including history features outperform models which do not (Rieser and Lemon, 2006a). In this thesis however, we the applied cluster-based model does
6.11. Learning experiments
187
separate model of user goal allows to learn behaviour which is consistent with the user goal as well as the dialogue history, as illustrated in the following example (Note that all the following examples are taken from the corpus generated in the simulated test interaction described in Section 6.11.2): (6.15) [...] System1: implConfAskASlot-->album, song_title (db: 11) User1:
provide_info-->song_title(It Aint Me Babe) filled [genre, artist, album, song_title], confirmed [genre, artist, album]
System2: presentList[speech] -->genre, artist, album, song_title (db: 1) User2:
no_answer-->no(no) filled [genre, artist, album], confirmed [genre, artist, album]
System3: presentList[mm] -->genre, artist, album (db: 11) User3:
provide_info-->song_title(All I Really Want to Do) filled [genre, artist, album, song_title], confirmed [genre, artist, album]
System4: presentList[speech] -->genre, artist, album, song_title (db: 1) User4:
yes_answer-->yes(yes) filled [genre, artist, album, song_title], confirmed [genre, artist, album]
In Example 6.15 the user first rejects (User2) a single item presented verbally (System2). As a consequence, the system un-fills the last provided slot (in this case the song title, see User1), and queries the database with the reduced set of constraints. Furthermore, the user goal gets updated by choosing another song from the subset defined by the confirmed slots (album and artist), also see Section 6.8.7. In User3 the user provides a different song meeting these constraints. The system then present this item verbally. In this case, the user simulation can do nothing but to accept the presented, as we implemented the constraint that if all slots are filled and confirmed the presented item has to be identical with the user goal. (Assuming that confirmed slots are correct with a 100% likelihood (also see Section 3.2.5).) In sum, the user simulation shows complex goal and history consistent behaviour, by utilising the implemented constraints of the user goal, together with the learned discourse not include any history features.
188
Chapter 6. Building a simulated learning environment from Wizard-of-Oz data
behaviour from the bi-gram model. This approach has the advantage that the discourse behaviour can be kept relatively simple (and thus can be learned from small data sets), while the task behaviour is controlled by an external model.
6.11.5.2
Learning optimal slot ordering
Despite its advantages for learning from small data sets, the separation of task and discourse model also introduces new challenges, which we discuss as interesting directions for future research. At the moment the task model uses a simple default ordering of slots, which is inspired by related work on MP3 player applications for in-car, e.g. (Forlines et al., 2005), (Wang et al., 2005), (Schulz and Donker, 2006), (Varges et al., 2006), also see Section 6.5.4. However, this hand-crafted default ordering leads to unnatural (or at least unlogical) behaviour where user simulation or the system consider redundant information to be important. (6.16) System1:
greet--> (db: 438.0)
User1:
provide_info-->album(I Might Be Wrong: Live Recordings) filled [album], confirmed []
System2:
implConfAskASlot-->album, genre (db: 8)
User2:
provide_info-->artist(Radiohead) filled [album, artist], confirmed [album]
System3:
presentList[mm] -->album, artist (db: 8)
User3:
provide_info-->genre(Indie Rock) filled [album, artist, genre], confirmed [album]
System4:
implConfAskASlot-->artist, song_title (db: 8) [...]
In Example 6.16 the user simulation has already specified album (User1) and artist (User2). The user then provides the genre (User3) where genre is redundant, as only one possible genre for this artist does exist. Task-Consistent behaviour would be for the user to choose an item from the list presented multimodally (System3). Note that Example 6.16 also illustrates that the RL-based strategy applies flexible “thresholds" (thus Algorithm 4 is really just a very general simplification of what was learned). In Example 6.16 the system keeps on asking for new constraints, hoping that
6.11. Learning experiments
189
the user will provide a song title and thus a list can be presented verbally (which gains a high immediate reward). It therefore delays the change to present a list multimodally, although a small number of possible candidates is retrieved right at the beginning of the dialogue. Furthermore, the system also asks for redundant information. In Example 6.17 the system asks for genre (System2), where (in our database) the genre is already defined by the artist. The same is true for System2 in Example 6.16. Note that other studies have identified the slot type “genre" to be in general problematic for this task (Wang et al., 2005; Schulz and Donker, 2006). (6.17) System1:
greet--> (db: 438.0)
User1:
provide_info-->album(Bob Dylan)
State: filled [slot2], confirmed [] System2:
implConfAskASlot-->artist, genre (db: 92)
User2:
provide_info-->genre(Blues)
State: filled [slot1,slot2], confirmed [slot2] System3:
implConfAskASlot-->genre, album(db: 92)
User3:
provide_info-->album(Desire)
State: filled [slot1,slot2,slot3], confirmed [slot1,slot2] System4:
presentList[mm] -->genre, album, artist (db: 9) [...]
Related work has proposed the following solutions for encoding task-realted information. For learning task-consistent user behaviour, (Schatzmann et al., 2007c) extends the agenda-based models introduced in (Schatzmann et al., 2007a) with an agenda which is learned from data. The agenda (or user state) is treated as a hidden variable which has the advantage that the amount of required annotated training data can be reduced. This approach is a promising direction for future research. For learning task-consistent system behaviour, the slot ordering can be included in the RL task, i.e. which slot type to ask next can be included in the action set, e.g. (Pietquin and Beaufort, 2005; Williams, 2006; Young, 2006; Thomson et al., 2008). However, this approach does not maintain a separate task model, but merges discourse and task behaviour. Furthermore, most of the previous work on learning optimal slot ordering with RL primarily focused on improving ASR quality, and did not explicitly target
190
Chapter 6. Building a simulated learning environment from Wizard-of-Oz data
task-consitent behaviour. Most of the work which maintains a separate task model, manually specifies the ordering of the task, e.g. (Xu and Rudnicky, 2000; Bohus and Rudnicky, 2003). However, recent work suggests some more principled approaches to determine which slot to ask next. (Polifroni and Walker, 2006; Becker et al., 2006) choose the next slot according to the expected information gain with respect to the structure of the database, where Polifroni and Walker (2006) use decision trees derived from data; Becker et al. (2006) use hand-coded rules. Other recent work learns the task model from human-human data (Bangalore et al., 2006). An interesting direction for future research is to determine how to best integrate task and discourse behaviour into the RL framework.
6.12
Summary
In this Chapter we learned an optimal strategy for information seeking dialogue systems using simulation-based RL, where the simulated environment is obtained from limited amounts of WOZ data. We address the complex and challenging problem how many database search results to present to the user, and when to present them, and which modality to use for presentation, given the competing trade-offs between the number of results (large lists are difficult for users to process especially when only presented verbally), the length of the dialogue (long dialogues are tiring, but collecting more information can result in more precise results), and the noise in the speech recognition environment (in high noise conditions accurate information is difficult to obtain). To train and test such a policy in a efficient but accurate manner, we obtain a simulated learning environment from WOZ data, where all the simulated components are constructed using data-driven methods. The overall framework is summarised in Figure 6.12. In particular, we create the action set by exploring the actions taken by the wizards. We use automatic feature selection techniques in order to define the state space. We present a method for simulating channel noise if training data is sparse. We also introduce methods to build and evaluate user simulation from small data sets. The applied reward function is obtained using a modified version of the PARADISE framework.
6.12. Summary
191
Figure 6.12: Overall framework for RL in a simulated environment obtained from WOZ data
We then train and test a RL-based policy by interaction with this simulated environment. We compare the results against a supervised baseline strategy. This comparison allows us to measure the relative increase of the RL-based policies over the strategies contained in the initial data set. RL policy significantly outperforms (p < .001) the supervised baseline strategy. The RL-based policy gains on average 50-times more reward when tested in simulation. One main advantage for Reinforcement Learning over Supervised Learning is that it allows to incorporate user feedback in the reward function and therefore allows us to learn strategies which reflect user preferences. Supervised Learning in contrast only mimics the strategies in the data. We also describe the RL-based policy. We first qualitatively describe the strategies using examples. We then also give a detailed description of the RL-based policy as a table look-up between states and actions. Finally, we conduct an error analysis and identify directions for future research. So far, we only tested the policies when interacting with a simulated environment. The ultimate evaluation however is to test the strategy performance with real users. In the next Chapter we report on results from a detailed user study.
Chapter 7 Comparing Reinforcement and Supervised Learning of dialogue policies with real users
Figure 7.1: Confused user trying to solve a ‘simple’ problem with a touch tone dialogue system. Illustration by Glasbergen (1996)
193
194Chapter 7. Comparing Reinforcement and Supervised Learning of dialogue policies with real users
In Chapter 6 we showed that Reinforcement Learning (RL) based strategies significantly outperform supervised strategies when interacting with a simulated environment. The ultimate test for dialogue strategies, however, is how they perform with real users. For real users it is often difficult to solve even relatively simple problems using automated dialogue systems. Users often get confused, frustrated and irritated by unwieldy dialogue behaviour (see Figure 7 for an illustration of this problem). These effects are hard to reproduce fully with simulated users. It is therefore necessary to test the learned strategies with real users to get subjective feedback. In this chapter we report results for testing the learned strategies with real users. We therefore port the policies into a working dialogue system, which we developed using the
DUDE
toolkit, as described in Section 7.1. In Section 7.2 we then explain the
experimental setup for the user tests. The test results are analysed in Section 7.3, followed by a discussion in Section 7.4.
7.1
Policy integration into a dialogue system: The iTalk system
This thesis ‘bootstraps’ a simulated dialogue learning environment from WOZ data, which enables the design of optimal strategies before a working prototype is available. In order to test the validity of the overall framework, we need to show that the strategies obtained in such an environment are indeed suitable for dialogue interaction with real users. We therefore design a dialogue system where we can integrate and test the learned policies. We call this system iTalk (in reference to the TALK project 1 where this thesis work was closely affiliated to.) The iTalk system is an interactive interface to search in a large database of MP3 files as described in the following.
7.1.1
The
DUDE
rapid dialogue development tools
Building a full-working dialogue system from scratch requires a substantial amount of manual labour. We therefore rely on the DUDE toolkit for system rapid development. DUDE
is a Dialogue and Understanding Development Environment which facilitates
1 Talk
and Look: Tools for Ambient Linguistic Knowledge (www.talk-project.org)
7.1. Policy integration into a dialogue system: The iTalk system
195
rapid development of slot-based dialogue systems for the English language (Lemon and Liu, 2006).
7.1.1.1
The development process in DUDE
In order to develop a system the dialogue developer has to provide a mySQL 2 database and has to specify a Business Model Process (BPM), see Figure 7.2. A BPM describes the task as a hierarchical automaton with sub-tasks and states which are linked by conditional transitions (similar to Task Hierarchical Diagrams, as described in Section 2.2.1). This specification can be done via a GUI, or by providing a formatted text input file. The DUDE toolkit then automatically generates a full working dialogue system for the given task, including context-sensitive ASR, a grammar for Natural Language Understanding, and a set of basic dialogue building blocks, such as sub-strategies and sub-routines. One major advantage of the DUDE toolkit over other graphical toolkits, such as the CSLU toolkit,3 is that DUDE provides a a simple interface to the Information State Update (ISU) approach to dialogue strategy design, thus making complex ISU-based systems attractive for commercial applications (cf. Section 2.2.3). The ISU approach allows to represent and track a rich representation of the dialogue context, which allows highly context-senstive and sophisticated strategies to be specified. This dialogue context is managed by a library of generic routines and sub-strategies which come with the tool. In addition to this task independent functionality, DUDE automatically derives a set of task-specific rules, according to the specified BPM model. The system developer then can edit the task-specific system prompts, can specify conditions for sub-task traversal, and s/he also may add some trigger phrases for the grammar. Other than that, the grammar and the speech recognition language model are automatically compiled from the provided database. In addition, a core grammar and lexicon also provide some additional generic functionality for slot-based systems. 2 http://www.mysql.com/
(24. April 2008) (24. April 2008); for a comprehensive introduction to the CSLU toolkit see (McTear, 2004). 3 http://cslu.cse.ogi.edu/toolkit/
196Chapter 7. Comparing Reinforcement and Supervised Learning of dialogue policies with real users
Figure 7.2: The development process with the DUDE toolkit (graphic after (Lemon and Liu, 2006))
7.1.1.2
DUDE
system architecture and generic dialogue management
The system architecture of
DUDE
is based on the Open Agent Architecture (OAA)
(Cheyer and Martin, 2001), where several (mostly) JAVA-based agents ‘communicate’ with each other (also see Figure 7.2): • A database agent for querying the MySQL database • An ASR agent implementing the HTK recogniser (Young, 1995) using ATK with open speech recognition using n-grams (or alternatively Nuance Dragon 4 can also be used) • A BPM agent which serves as a default task planner • A TTS agent for the Festival2 speech synthesiser (Taylor et al., 1998) (or alternatively CereProc 5 speech synthesiser can also be used) • A Grammatical Framework (GF) parser agent (Ranta, 2001) • DIPPER for ISU dialogue management (Bos et al., 2002) • An agent for text-based interaction (text in/out agent) • An agent logging all information states (IS logger agent) following the format specified by Georgila et al. (2005b) • A GUI agent for multimodal dialogue systems (for example see Lemon et al. (2006b)) 4 http://www.nuance.com/naturallyspeaking/sdk/ 5 http://www.cereproc.com/
(24. April 2008)
(24. April 2008)
7.1. Policy integration into a dialogue system: The iTalk system
197
In addition, DUDE comes with a set of subroutines which cover the following generic core dialogue behaviour: • mixed initiative and over-answering • open-initiative dialogue start (“How may I help you?") • explicit and implicit confirmation • generic help, restart/start-over, repeat, and quit commands • task switching (for applications with multiple tasks) • database query and result presentation • template-based Natural Language Generation (NLG) • clarification of ambiguous semantic content (e.g. “Kid A. Do you mean album or song title?") • possibility to leave a slot under-specified (for example the user might say “I don’t mind", “I don’t care", etc.)
7.1.2
Extensions to
DUDE
In addition to the automatically generated behaviour, we added the following extensions to the dialogue’s functionality. The main difference is that we changed the overall structure of the dialogue: from form-filling to information-seeking dialogue strategies (as defined in Section 2.6.1). Form filling strategies gather values for all slots before the database is queried. The retrieved items are only presented at the end of the dialogue (see Table 7.1 top). The disadvantage of such a procedure is that the dialogues can get unnecessarily long and unwieldy. Imagine the case where the user fills all the slots just to find out that the requested item is not in the database. Or the case where, there is only one possible candidate in the database after filling the first slot, then filling all the other slots should become redundant. For information-seeking dialogue strategies, in contrast, the database is queried every time the user provides a new constraint (for us this is when a new slot gets filled). The presentation phase can be entered at any point in the dialogue (see Table 7.1, bottom). Thus, one major decision for information-seeking dialogue systems is when to stop gathering new
198Chapter 7. Comparing Reinforcement and Supervised Learning of dialogue policies with real users
constraints (this is what we call “information acquisition") and present the retrieved items to the user.
Table 7.1: Form filling (top) and information-seeking (bottom) dialogue strategies for a 4 slot problem (S1 − S4) with different opportunities for entering the presentation phase (P). The arcs denote slot transitions with implicit/ explicit confirmation or by asking a new slot value (denoted as ‘aas’ in the figure).
The information acquisition phase includes the system acts for explicit (explConf) and implicit confirming slots (implConfAskASlot), asking for new slot values (askASlot), as well as the decision to enter the presentation phase (presentInfo); cf. Figure 6.5 in Section 6.5.3. The confirmation strategies and the functionality for asking new slots values are automatically generated by standard generic routines in DUDE. In order to implement the additional presentation skills presentInfoVerbal and presentInfoMM, we had to extend the current functionality of DUDE as follows. For verbal presentation we use a contrastive summary-based approach, following Polifroni et al. (2003); Polifroni and Walker (2006). The retrieved items are presented by listing all slot features which overlap, and asking the user to provide a value for the slot which helps to distinguish the retrieved items (see Example 7.1). If there is more than one distinctive feature, the one with the highest information gain (entropy) with respect to the database content is chosen.
7.1. Policy integration into a dialogue system: The iTalk system
199
(7.1) User: “Find me a song called Morning Bell.” System: “There are 3 results matching your query all by the artist Radiohead, all from the genre Alternative, and all having the song title Morning Bell, but a different album. You have the following options: ‘Kid A’ and ‘I Might Be Wrong’ and ‘Amnesiac’. Which album?" For multimodal presentation we let the system verbally confirm the last slot value, and, at the same time, display a list of candidates on the screen (see Figure 7.3) where the user can select an item by clicking. Examples can be found in the dialogue in Appendix B.3.
Figure 7.3: List of retrieved items displayed in the iTalk system
The dialogue decisions for information acquisition and presentation are determined by the SL and RL policies as presented in the last Chapter. All the other (generic) sub-strategies, like greeting, closing, semantic clarification, or user commands like help, repeat, start-over, etc. are implemented by generic DUDE routines. The SL policy follows a simple set of learned rules (see Algorithm 2 in Section 6.6.2). The RL policy is implemented using a table-look-up technique (see Section 6.11.4 and Appendix C). We also implemented the same constraints as used for learning (see Section 6.5.4). In addition, we handle the case when no results (zero items) are retrieved in the database. For simulation-based strategy learning we assumed that the user’s goal is always contained in the database (see Section 6.8.7.2). The tasks for the user
200Chapter 7. Comparing Reinforcement and Supervised Learning of dialogue policies with real users
tests, however, are designed in such a way that not all the slot values are specified in advance (as further discussed in Section 7.2.4). We asked the user not to guess any additional values, but rather to ask for help or leave the option open (i.e. leaving a slot under-specified) in order to resemble a concrete ‘search’ scenario rather than a ‘browsing’ task. However, some subjects ignored this instruction and made a guess, which (occasionally) resulted in zero results. In this case, the system apologises and the dialogue restarts. In addition, we added a context-sensitive help function. The existing help function only gives general information about the interaction with the system . The context-sensitive help function, in contrast, lists a number of examples of possible candidates for the current slot value. The system presents maximally 5 help items (see Example 7.2). Note that this threshold is manually set. Example 7.2 also illustrates the difference between the option to leave a slot unspecified (“I don’t care") and the help function (“I don’t know"). Context-senstive help is always given if the user explicitly asks for help. The generic help only follows a time-out. (7.2) User: “I would like to hear a Blues song by Bob Dylan” System: “Blues for type of music; searching for music by ‘Bob Dylan. Which album?" User: “Don’t mind” System: “Okay, it doesn’t matter. What is the title of the song?" User: “I don’t know.” System: “You have several options. For example: ‘Positively 4th Street’ , ‘I Dont Believe You’, ‘Most Of The Time’, ‘Black Diamond Bay’ , and ‘Desolation Row’. Which one would you like? ’" We also extended the functionality for Natural Language Understanding and database query. First, the system can now handle partial parses. For example, the user can say “Hendrix" instead of “Jimi Hendrix". Furthermore, the database is queried using “fuzzy" search (or partial string matching). For example, if the system only recognises the first two words of ‘Subterranean Homesick Alien’ by Radiohead, the song ‘Subterranean Homesick Blues’ by Bob Dylan is returned as well (cf. Chapter 6.2).
7.2. Experimental setup
201
Two new Java-based OAA agents implement this extended functionality: • The MaedchenFuerAlles agent (German for “handyman" or a “girl Friday") which implements all additional behaviour except for generating visual output; • The Presenter agent, which is based on the existing GUI agent. This agent displays a list of retrieved items on the screen (based on JAVASwing) 6 . It also allows the user to interactively select a (single) item via mouse click.
7.2 7.2.1
Experimental setup Technical setup
The technical setup should resemble the setup used for the WOZ as closely as possible (see Chapter 5.1), as the strategies are learned for this specific application environment. 7 That is, we display the same types of lists to the user, while the user is solving a driving task. Furthermore, the channel noise for WOZ and user studies needs to be comparable. In addition, system should access the same database of MP3 files as we used for learning. 8 Finally, the instructions given to the users need to be similar as the users’ perceptions can be easily ‘primed’ (as shown by Jokinen and Hurtig (2006)). While some of these requirements are easy to satisfy, some others are more problematic, as we discuss in the following. First of all, the use of Automatic Speech Recognition turned out to be problematic. Speech adds an extra difficult aspect to evaluation, since the users easily expect the system to possess more fluent spoken language capabilities than what is currently possible (Jokinen and Hurtig, 2006). Speech recognition in the MP3 domain is a extremely challenging task, as pointed out by Wang et al. (2005). Especially, unrestricted recognition (as necessary for mixed initiative and over-answering) is problematic, as many music albums and song titles have overlapping sub-strings. Items in the MP3 domain are also naturally hard to pronounce and recognise (not only for machines), for example titles can contain slang words, colloquial speech, 6 http://java.sun.com/javase/6/docs/api/javax/swing/package-summary.
html (23. April 2008) 7 Note that both setups are meant to resemble the same final application. 8 Note that we used a different database for learning than for the WOZ experiments, as discussed in Chapter 6.2.
202Chapter 7. Comparing Reinforcement and Supervised Learning of dialogue policies with real users
special characters, multilingual expressions (e.g. “Aufstehn! Rise&Shine"), use of rare words (e.g. “Myxomatosis") or new word creations and double names (e.g. “Wired Fishes/Arpeggi"). In addition, the speech recognition accuracy is naturally low when searching in large back-end databases. Other research investigates the problem of how to improve ASR for speech-based database search, e.g. (Filisko and Seneff, 2005; Gruenstein and Seneff, 2006, 2007), see Section 2.6.1. Prior work on dialogue evaluation has criticised that the use of ASR complicates experimental design, e.g. (Paek, 2001; Hajdinjak and Mihelic, 2006; Jokinen and Hurtig, 2006). In particular, ASR is said to “over-ride" effects of other dialogue behaviour. ASR is the “Archilles’ heel" of spoken interaction, as system performance depends highly on the quality of recognition (Paek, 2001). Hajdinjak and Mihelic (2006) suggest to exclude ASR from the experimental design altogether, as ASR quality has such a strong influence on user perception that it hinders other aspects of dialogue behaviour to play a prominent role. As an alternative we suggest to use typed interaction, similar to a chat interface. 9 Typed interaction has some further advantages. First, it facilitates recruiting subjects, as we can also rely on non-native speakers. Second, the wizards’ decisions in the WOZ experiments are also based on transcribed “corrupted" text (see Section 5.2). The typed user inputs resemble this noise quite well, as we will see in Section 8.4. Finally, the quality would have been non-acceptable if we had used speech recognition ‘outof-the-box’. A fair amount of manual labour/hand-tuning would have been necessary to make ASR quality acceptable. Furthermore, typed input also allowed us to recruit non-native speakers as subjects. Most importantly, the use of text input allows us to target the experiments to the dialogue management decisions of the system. The major difference between the system used here and a conventional chat interface, however, is that we still use synthesised spoken output for the system utterances for the following reasons. First, in the WOZ experiments the users also listened to synthesised speech. And second, the user is still performing a driving task, where the visual attention is limited. 10 Another difference to the WOZ study is that the interactions are in English, whereas 9 Chat interfaces are also used by other dialogue studies, e.g. Purver et al. (2003b), Bertomeu
et al. (2006). 10 In order to account for the fact that the user has to type, we changed the setup for the driving task as described in the next section.
7.2. Experimental setup
203
for the WOZ study they were in German. 11 Nevertheless, we don’t expect this change of languages to have any influence on the dialogue strategy, as the learned strategies are on the speech act level. Results obtained in previous work indicate that human linguistic behaviour on the speech act level is very similar for English and German – at least for task-oriented dialogues in restricted domains (Rieser and Moore, 2005).
7.2.2
Primary driving task
In contrast to the WOZ experiments we do not ask the users to operate a driving simulator, but let them watch videos of a simulated driving task. Their task is to count intersections with traffic lights as they occur in these videos, and note down the number at the end of the dialogue. We can also use this measure to directly determine the cognitive load of the interaction. In particular, we use two different sets of driving videos. • Driving set D1 consist of two videos, ‘Simulated urban driving’ (03 : 26) 12 and ‘DriveSafety - Winter Driving Simulation’ (04 : 07). 13 • Driving set D2 only contains the video ‘DriveSafety HyperDrive demo’ (08 : 22). 14 Both sets are played back without sound, and the videos are played in a loop (in case the video ended before the user finished the task). Driving set D1 contains (3+3) intersections with traffic lights, set D2 contains 4. The overall experimental setup is shown in Figure 7.4. The user is interacting with the dialogue system using a laptop (heightened with books) with an external keyboard and mouse. The driving simulation video is projected on the wall behind. This setup allows the user to pay attention to both screens. 11 This
change of languages is due to the fact that the WOZ experiments were carried out at Saarland University, where as the user tests are performed at Edinburgh University. 12 www.youtube.com/watch?v=rACwcqRKRg8 (23. April 2008) 13 www.youtube.com/watch?v=nLgQEYWkvoI (23. April 2008) 14 www.youtube.com/watch?v=gGTDaHgO8zs (23. April 2008)
204Chapter 7. Comparing Reinforcement and Supervised Learning of dialogue policies with real users
Figure 7.4: Experimental setup – User interacting with the iTalk system (laptop) while watching a driving simulation video (wall projection).
7.2.3
Subjects and procedure
We recruited 17 subjects (8 female, 9 male) for the experiment. All subjects are between 20 and 40 years old, and all but 3 subjects are able to touch type. The majority of our subjects are students (76.5%) and mainly non-native speakers of English (58.8%). The experiment proceeded as follows. First, the user signs a statement of consent (see Appendix D.1). Then s/he is given a sheet with experimental instructions to read through (see Appendix D.2). The instructions consist of a short description of the system’s functionality, some explanation on possible user commands (e.g. how to get help), and advice on how to proceed with the tasks. The “driving" task is to count traffic lights (as explained above). The tasks to solve with the system are simple search tasks where the user is asked to search for a specific item (see next Section). Once the user has finished a task, the driving simulation video stops, and the user fills out a questionnaire (see Section 7.2.5). The user also fills in the number of intersections with traffic lights s/he has counted so far (Appendix D.4.1). After the user finished filling out the questionnaire, s/he resumes with the next task and the driving video
7.2. Experimental setup
205
continues. After the user has finished the first task set, the experiment leader switches between SL and RL dialogue policy, and the user starts with the next set of tasks (as described in the next Section). At the very end, the user may provide some personal information and leave some comments (see Appendix D.4.2). We further describe in more detail how we designed the tasks and the questionnaire. At the end of the experiment each participant received a small compensation of £5.
7.2.4
Task types
Every user has to solve 12 tasks in total, 6 tasks are solved using the system executing the SL policy, and 6 tasks with the RL policy. This setup is called a “repeatedmeasures within-subject design", i.e. comparing strategy performance by subject and task. We therefore design 2 task sets (A and B) of 6 tasks each. These task sets are counter-balanced with strategy type (SL, RL) and driving simulation video (D1,D2) in a latin-square design (see Field and Hole (2003)). The tasks are of 2 different types. In tasks with type 1 the subject gets a partial description of the item s/he should be looking for (e.g. genre, artist name, and/or album name). A task is successful if the user chooses a final (unique) song title matching the task. Task specifications of type 1 are of varying detail: 1a only one or two pieces of information are given, resulting in many possible candidates (> 5). 1b the given information specifies a path leading to a small set of items to choose from (ca. 5 items). A task of type 2 tells the user the specific song title s/he should be looking for. This song title has different degrees of ambiguity: 2a only one song with that title can be retrieved. 2b the database contains 2-4 songs with that title. Both task sets contain tasks of type 1 and 2 in the following order: 1a, 2b, 1b, 2b, 1a, 2a. A detailed list of the tasks sets can be found in Appendix D.3, Table D.3.
206Chapter 7. Comparing Reinforcement and Supervised Learning of dialogue policies with real users
7.2.5
User questionnaires
The user fills out a questionnaire at the end of each task. The questions are of two different types. One set concerns task completion, the other one targets user satisfaction following (Walker et al., 2000). The first set of questions measure actual and perceived task completion. For measuring the actual task completion the user fills in the missing information in an attribute value matrix (AVM). For example, if the task scenario is described as “You want to listen to a Blues song by the artist Bob Dylan.", then the user has to fill in album and song title (as in Table 7.2). genre
Blues
artist:
Bob Dylan
album: song title: Table 7.2: Example AVM for measuring task completion
The perceived task completion is measured as a binary variable, asking the user whether s/he completed the task in a yes-no question (see Appendix D.4). The other set of questions targets different dimensions of user satisfaction, using a subset of the questions asked in
PARADISE
(Walker et al., 2000). A discussion of
the PARADISE questionnaire can be found in Section 2.2.2. In addition to PARADISE we also added questions targeting presentation timing (question 5) and presentation mode (questions 6,7). In total the user has to rank the following 9 statements on a 7-point Likert Scale from ‘totally disagree’ to ‘totally agree’ (see Appendix D.4). The corresponding dimesions of user satisfaction are given in brackets. 1. In this conversation, it was easy to find what I was searching for. (Task Ease) 2. The system worked the way I expected it to, in this conversation. (Expected Behaviour) 3. In this task, I thought the system had no problems understanding me. (NLU Performance) 4. In this task, the system was easy to understand. (TTS Performance) 5. In this task, I thought the system chose to present the search results at the right time. (Presentation Timing)
7.3. Results
207
6. In this task, I thought the number of items displayed on the screen was right. (MM Presentation) 7. In this task, I thought the amount of information presented in each spoken output was right. (Verbal Presentation) 8. In this task, I found that searching for music distracted me from the driving simulation. (Cognitive Load) 9. Based on my experience in this conversation, I would like to use this system regularly. (Future Use)
7.3
Results
The corpus gathered in this setup comprises 204 dialogues (17 subjects with 12 tasks each) and 1,115 turns. 15 In the following we compare the results for SL and RL strategy in order to detect statistical differences in strategy performance. In particular, we compare subjective user ratings (as obtained from the questionnaires) and objective measures of dialogue performance (such as dialogue length).
7.3.1
Subjective user ratings
We use the Wilcoxon signed-rank test for significance testing between the user ratings. The Wilcoxon signed-rank test is the non-parametric alternative to the paired t-test. 16 In the following we first report on the results for different measures of User Satisfaction, then we report on task related user ratings. 15 A
turn is defined as in Paek and Chickering (2005): it begins at the start of each new user action (since all system actions respond to user actions). A user action can be a verbal/typed utterance, or a click (i.e. the user selected an item on the screen). 16 Although most previous work uses a paired t-test to analyse user questionnaires, this method assumes parametric data which is problematic for data on an ordinal scale, as typically obtained from user questionnaires. We also run a t-test were the results from the non-parametric test are confirmed. For non-parametric data, the results for the non-parametric tests are said to be more reliable (Field, 2005). We therefore report on those.
208Chapter 7. Comparing Reinforcement and Supervised Learning of dialogue policies with real users 7.3.1.1
User ratings on User Satisfaction
measure
SL
RL
Task Ease
4.78(±1.84)
5.51(±1.44)***
Expected Behaviour
4.79 (±1.68)
5.48(±1.27)***
NLU
4.92(±1.61)
5.43 (±1.43)
TTS
4.73 (±1.23)
5.18 (±1.23)
timing
4.42 (±1.84)
5.36 (±1.46)***
MM Presentation
4.57 (±1.87)
5.32 (±1.62)***
Verbal Presentation
4.94 (±1.52)
5.55 (±1.38)***
Cognitive Load
5.06 (±1.19)
4.85 (±1.37)
Future Use
3.86 (±1.44)
4.68 (±1.39)***
Table 7.3: Comparison of mean user ratings for SL and RL policies(with standard deviation ±); *** denotes statistical significance at p < .001
The results for user ratings on different dimensions of User Satisfaction are displayed in Table 7.3. All the observed differences have a medium effects size (r ≥ |.3|) (see Cohen (1992)). For all dimensions from the questionnaire, except for TTS quality, NLU performance, and Cognitive Load, the RL-based policy performs significantly (p < .001) better than the SL-based policy. Note that NLU and TTS quality were measured as a control: they didn’t change between systems and the strategies were designed to handle these issues the same way (although users perceived them slightly better for RL). Table 7.3 lists detailed results. The total gain of the RL over the SL policy is on average 0.7 points on a 7-point Likert Scale (10%). The relative improvement for Task Ease (i.e. the measure optimised by the reward function, see Chapter 6.9) is 15.3%; for Future Use 23.52%. Note that to date only Frampton (2008) reports significantly improved user satisfaction scores for RL-based strategies. Also note, that in 41.2% of the cases the SL policy followed the same strategy as the RL policy. This is mainly due to the fact that the SL policy applies a frequency-based decision for starting the information presentation phase (with P = 0.48, see Section 6.6.2). Nevertheless, the cases where the RL-based system does behave different (i.e. in 58.8% of the time) cause a significant increase for most of subjective ratings, indicating that the distinctive cases have a strong impact on user judgement. Furthermore, we find that gender, as well as native vs. non-native speaker of English, have an effect on user ratings. We find an effect for native vs. non-native speakers for
7.3. Results
209
Table 7.4: Effects of gender and native vs. non-native speakers on user perception
210Chapter 7. Comparing Reinforcement and Supervised Learning of dialogue policies with real users
the Cognitive Load: the RL-based strategy distracts non-native speakers significantly less from the driving task (z=-2.67;p=.008) whereas for native speakers the reverse seems to be true (although differences are not significant here), see Table 7.4, top left. It also seems like gender does influence how the presentation strategies are evaluated: male participants rate rather indifferently between the RL and the SL strategy for most of the questions, whereas female participants clearly favour the RL-based strategy in terms of Presentation Timing, Multimodal and Verbal Presentation, and Future Use (see Table 7.4, top right and bottom row). Similar gender effects are reported by other studies on multimodal output presentation, e.g. (Foster and Oberlander, 2006; Jokinen and Hurtig, 2006; Robertson et al., 2004). Note, that for the WOZ study we do not find any gender differences. 17
7.3.1.2
Comparison of task-related judgements
We also asked the user to fill in task related questions (see Section 7.2.5). The actual task completion is measured according to an AVM, where filling all the requested slots corresponds to 100%. For example, if 2 slots are left to fill in (and two are specified by the task description), and the user just provides one of them, then task completion is evaluated as 50%. For actual task completion almost the maximal score is reached: RL= 93.7% SL= 90.0%. There are no significant differences between the policies. The perceived task success is measured as a binary variable. 18 Here almost the maximal score is reached as for RL (taskCompletionRL = .98) and for SL (taskCompletionSL = .96). Again, there are no significant differences between the policies. The task related features scoring almost maximal, indicates that the system was very usable in general. 17 Here a question is,
whether the observed differences are due to gender specific preferences, or if they are due to differences in how men and women use subjective ranking scales (e.g. Likert Scales). For example, when using bipolar ranking scales respondents may avoid using extreme response categories (“central tendency bias"); or tend to agree with statements as presented (“acquiescence bias"); or try to portray themselves in a more favorable light (“social desirability bias"), (see http://en.wikipedia.org/wiki/Likert_scale for a discussion of the ratings produced by Likert Scales). In our study, especially men used the undecided middle value more often than women. 18 Note that for the binary measure of perceived task success the McNemar’s test was used instead of the Wilcoxon signed-rank test. The latter assumes ranked order. The McNemar’s test is a non-parametric method used on nominal data to determine whether the row and column marginal frequencies are equal, similar to the χ2 test, but for binary data. As a rule of thumb: what the paired t-test for parametric data, is the Wilcoxon test for ordinal data, and the McNermar’s test for binary data. The interested reader is referred to Field (2005).
7.3. Results
211
For the secondary task, counting traffic lights, no significant difference in performance is found (mean counting errors for RL= 2.0 and for SL= 2.3). However, for women there is a tendency to make fewer errors when using the RL-based dialogue strategy (mean counting errors for RL= 2.3 and for SL= 3.0, p=.084). Interestingly enough, there was no correlation between how much people felt distracted from the driving simulation (Cognitive Load) and how many errors they made in counting traffic lights.
7.3.1.3
Comments by the users
At the end of the experiment the users could give their own comments (see Appendix D.4.2). 8 out of 17 users (47.06%) left a comment behind. The anonymised transcriptions can be found in Appendix D.4.3. 5 out of 8 users complain about the bad TTS quality, and report that they were not able to understand some of the names of presented items. 2 users would prefer a speech-based interface, rather than typing. 2 users asked for more multimodal output and earlier presentation of candidates by the system. (This is what the SL policy does “wrong".) One user comments that it felt artificial to choose songs by genre. Some others participants also noted that they had difficulties with specifying genre. Similar problems about choosing songs by genre are reported by Wang et al. (2005); Schulz and Donker (2006). We believe that these comments are very valuable, as they illustrate some major bottlenecks in strategy evaluation. The experimental design for evaluating dialogue system is complex and difficult to control, as there are many free variables which can influence the perception of the system and its strategies. For example, the verbal presentation strategies suffered from the bad TTS quality, as well as did task success. As such, one might consider to learn generation strategies which take TTS quality into account.
7.3.2
Objective dialogue performance
In the last section we report on improved scores for subjective user ratings. We now analyse the system log-files and compare objective measures for dialogue performance. In Section 6.11.2 we already show that RL-based policies significantly outperform supervised policies when interacting with a simulated environment. We now test
212Chapter 7. Comparing Reinforcement and Supervised Learning of dialogue policies with real users
whether we can replicate these results with real users. We investigate two aspects in more detail: First, we analyse differences in efficiency for information acquisition. Second, we analyse information presentation strategies. We use a paired t-test (with pair-wise exclusion of missing values) for comparing SL and RL performance. Here, a t-test is a valid option, as objective dialogue quality measures are on an interval scale and follow an approximately normal distribution. The results are shown in Table 7.6. For information acquisition, the RL strategy produces dialogues which are significantly shorter (p < .05) than for SL. However, there are some cases where the RL policy generates some long dialogues as well (see the outliers in Table 7.5, left). These outliers are caused by different phenomena. For example, some users changed their mind after they already selected an item (answering “no" to the final question whether they are happy this option). In this case the dialogue re-starts. Furthermore, users often mis-heared a song or album title after a verbal presentation and took several turns to recover (as we don’t include very sophisticated error recovery strategies). This confirms that TTS quality is an important feature for learning presentation strategies.
Table 7.5: Dialogue length in turns and multimodally presented items for SL and RL in the user tests; dialogue length with outliers ◦
For information presentation we are interested in presentation timing, as well as in the amount of information presented verbally and multimodally. The number of items presented verbally is about the same for both policies. RL and SL learned the same
7.3. Results
213
“thresholds". However, the SL policy failed to learn an upper boundary for multimodal presentation (see Section 6.11.5). The SL policy presents 52.2 items on average and up to 175 items maximum (see results in Table 7.6). This is significantly more (p = .003) than the RL policy, which learned to reduce the number of items to a maximum of 14 (also see Figure in Table 7.5, right). In this context it is worth noticing that in 16% of the cases where a list is displayed, the user did not click, but verbally provided another constraint instead. All of the ignored lists are longer than 10 items (i.e. shorter lists are always clicked), and 75% of them are presented by the SL policy. measure
SL
RL
paired t-test
mean(std)
mean(std)
turns
5.86 (±3.26)
5.07(±2.94)*
t(101)=-1.9; p=.05 ;r=.19
verbal items
1.22 (±.40)
1.27(±.42)
t(100)=2.08; p=.06; r=.2
GUI items
52.2 (±68.5)
8.73(±4.34)**
t(25)=-3.3; p=.003; r=.55
help
.69 (±1.1)
0.34(±.68)**
t(101)=-2.9; p=.005; r=.27
no choice
.48(±.9)
0.29(±1.1)
t(101)=-1.7; p=.09; r=.17
reward
-628.16(±1808.3)
37.62(±60.7)***
t(101)=3.7; p=.001; r=.35
Table 7.6: Direct comparison of objective measures for the WOZ and the RL-based policy; where * denotes statistical significance at p < .05, ** at p < .005, and *** at
p