Use of the Matrox Imaging Library (MIL) augmented .... MIL has a function which can do this operation .... ten r = F?1( ; h; mocc) where the occupancy is xed.
Boticelli: a single{camera mobile robot using new approaches to range data fusion, world modeling, and navigation planning William W. Armstrong1 2, Dmitry O. Gorodnichy1, and Brant Coghlan2 ;
1. Department of Computing Science, University of Alberta 2. Dendronic Decisions Limited, Edmonton.
Abstract ID: A083
Abstract
Boticelli is a mobile robot, designed and built for testing new approaches in stereo vision, world modeling, data fusion, map extraction, reinforcement learning and navigation planning. A single camera is used to capture depth information by taking advantage of camera movements. The main thrust of the new approaches is to replace well-known techniques, that depend upon grids of points in space with techniques that use continuous, piecewise linear functions. These techniques scale well to large, complex environments.
Keywords: mobile agents, mapping and exploration, reinforcement learning
Acknowledgements
This research was supported mainly by the Defence Research Establishment Su�eld (contract W7702-6R594/001 to Dendronic Decisions Limited). We are very grateful to the Scienti c Authority Dr. Simon Barton for his guidance. Travel was supported by the Natural Sciences and Engineering Research Council of Canada (NSERC). Help of Kyle Palmer in designing the multithreaded software architecture of Boticelli and Monroe Thomas and Ron Kube in designing and calibrating the PTU software is gratefully acknowledged.
.
Boticelli: a single-camera mobile robot using new approaches to range data fusion, world modeling, and navigation planning Abstract ID: A083
3D features
world model
Abstract
Boticelli is a mobile robot, designed and built for testing new approaches in stereo vision, world modeling, data fusion, map extraction, reinforcement learning and navigation planning. A single camera is used to capture depth information by taking advantage of camera movements. The main thrust of the new approaches is to replace well-known techniques, that depend upon grids of points in space with techniques that use continuous, piecewise linear functions. These techniques scale well to large, complex environments.
Keywords: mobile agents, mapping and exploration, reinforcement learning
Introduction
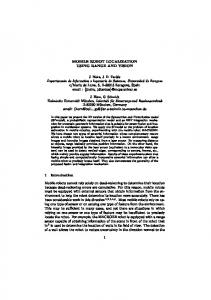
Boticelli is a prototype mobile robot, built for the purpose of demonstrating inexpensive stereo depth capture and new paradigms in world modeling, reinforcement learning and navigation planning. One objective was to design a single-camera vision system capable of acquiring a 3D model of an unknown environment su�cient for navigation. Sonar sensors are not accurate enough (Martin & Moravec 1996), while laser range nders and highly calibrated stereo systems are expensive. There are many applications where inexpensive robots that create 3D models could be used. These include mine detection, where the likelihood of damage to the robot is high; intelligence gathering; and children's toys that manifest behaviors similar to those of live pets. Boticelli, shown in Figure 1, consists of an RWI B12 mobile base with a video camera mounted on a Direct Perception pan-tilt unit (PTU). Boticelli communicates with two external computers by a tether link. One Pentium Pro 200MHz computer is used for image processing and data fusion and a Dual Pentium II 333MHz computer is used for reinforcement learning and navigation planning. The project has three major research objectives: 1. to suggest and investigate a parametric alternative to the grid-based approach used for world modeling and map building; 2. to suggest and investigate a new approach to fusing range data, based on piecewise linear regression; and 3. to explore reinforcement learning, particularly in navigation planning, where reinforcement learning is accomplished using piecewise linear regression. We present an initial implementation of these techniques and report results achieved. In the next section we describe the hardware and software architecture of Boticelli. The vision part of the project is then described. The subsequent sections discuss new ideas in occupancy modeling, range data fusion and map extraction. The reinforcement learning technique used
Boticelli
Figure 1: Boticelli for planning is discussed next. A summary of results concludes the paper.
Robot Architecture
Boticelli is designed for navigation in an unknown environment. Navigation decisions are determined by points in a horizontal plane: � observed \obstacle points" which are likely to block motion, � \exploration points" at which further observation will be required, and � the goal location (if known). Until the goal is reached, the robot is required to continually look for the goal while watching for obstacles, determining where to move and moving. This suggested a software architecture of the robot, which we call the \Look-Think-Drive" architecture. The robot repeats a cycle of looking (vision), thinking (planning), and driving (motion). The architecture consists of three main modules. The rst module is the Vision module, which executes all image processing and vision tasks. Using this module, the robot scans its environment and calculates the depth to features around it. The location of the goal, if observed, is obtained as well. This module captures images with the video-camera via a Matrox Meteor video card. Control of the PTU is accomplished via RS-232 communication initiated by custom COM/DCOM objects. DCOM permitted the PTU to be controlled by a remote computer for experimentation and development. Use of the Matrox Imaging Library (MIL) augmented custom-developed imaging code. The Thinker module consists of two sub-modules: vision understanding and path planning. For vision understanding, depth data are fused and a 3D occupancy model of the world is built. A 2D polygon of the area available for navigation is extracted from that model. Lists of obstacle points and exploration points are derived using the polygon. These two lists are then added to previous lists and are used, along with the location
of the goal, if known, to perform path planning. The path planner computes a suggested direction for the robot to move. The path planner was implemented as a separate piece of software to permit it to function in a simulation mode to test reinforcement learning. The path planner sub-module communicates with the vision understanding submodule and the driver module via le synchronization messaging. This provided communications with the least overhead and was an aid to debugging. The third module, the Driver, sends motion commands to the robot. It also performs some consistency checking on the output of the planner. It can limit the distance moved or veto the move altogether, based on vision data. Communication with the robot motion base is done via bi-directional RS-232 controlled by a COM/DCOM object. DCOM was used to allow remote experimentation and parallel development by other users on the network. All three modules are active in each cycle of a robot's navigation. Cycles are repeated until the robot manoeuvres close to the goal. Microsoft Visual C++ V. 5 and MFC were used for software development. All software runs under Microsoft Windows-NT 4.0. Below we describe each component of Boticelli in detail.
Single Camera Stereo
The Matrox Meteor video card and the Matrox Imaging Library 5.0 are used for image grabbing and processing. They generate a sequence of 640x480 colour (RGB) images. These are preprocessed with an averaging lter to produce 160x120 pixel images. Depth acquisition is then done on these lower resolution images. The camera is mounted on an arm 21 cm long on the PTU as shown in Figure 1 so that it can observe the part of the world from the oor to the height of the top of the robot.
Depth Acquisition
In order to acquire depth information about the environment with a single camera, the following three-stage procedure is used. First, pixels with high intensity derivative in the vertical direction are selected as features (stage 1). To make depth acquisition and world modeling faster, we use only about 500 features per image. Each feature is then tracked into the second frame, which is grabbed after the camera has moved vertically down about 2 cm, and the best match is obtained (stage 2). The match error is calculated as N X (1) E = kV~ ? V~ 0 k2 = (V [n] ? V 0[n])2; n=1
where V~ and V~ 0 are N-dimensional vectors obtained using a window of size N = 5 � 5. If E is less than a speci ed value, then the feature is used in building the
world model. Otherwise, it is discarded. This lters out approximately half of the features. Finally (stage 3), the distance (called the depth) r to the remaining features is calculated by minimizing the distance between points on the two rays involved: (2) argminr;r kr~m ? (~h + r0R~m0 )k; where m ~ and m ~ 0 are normalized unit vectors in the moving frame of the camera determined by the positions of a feature in the rst and the second frame respectively. R is the rotation matrix and ~h is the translation vector of the camera describing the motion between frames. Both are known, since only the PTU moves during depth acquisition. The focal length of the camera is calculated in advance using the vanishing point technique described in (Kanatani 1993). It takes about two minutes and fteen di�erent pan positions of the camera to observe the whole environment and construct a sparse depth map. 0
Con dence of depth data
Warping of the video image and varying intensities of uniform surfaces are a concern. These distortions result in imperfect tracking and matching of features, and false depth values. Another major cause of uncertainty in depth estimation is the limited resolution of the camera. The analysis of matching and quantization errors should be done in order to build a sensor model to be used in data fusion. A sensor model assigns a level of con dence (also called a value of evidence) to the data registered by the sensor. This value of evidence is obtained by using the matching error E given by Eq. 1 and Tuckey-by-weight (J.Rousseeuw 1987) applied to this error: � E )2) if E < Emax ? ( Emax Evidence = (1 ; (3) 0; otherwise where Emax is a constant de ning the robustness of tracking. This approach is di�erent from that of (Miura & Shirai 1997) and resembles that of (Moravec 1996). It produces a value of evidence in the range [0,1], which is used in fusing the range data. We disregard marginal features (as in (Yamauchi et al. 1998; Jennings & Murray 1997)) and we make sure that each selected feature is observed at least twice, so that it appears at least once near the middle of the image, where its evidence is high. This is achieved by adjusting the angle of pan rotation. However, even with these error-reducing techniques the depth is calculated incorrectly for approximately 5% of the features. Some of these errors will be eliminated in data fusion. The goal is sought by checking each image frame for the existence of a pattern previously stored in memory. MIL has a function which can do this operation e�ciently.
Occupancy World Model Recent research has produced three fundamental paradigms for world modeling for mobile robots: metric (occupancy-based), geometrical (beacon-recognition and tracking-based) and topological (graph-based) (Thrun 1998). In our research we consider the occupancy-based approach. Originally developed for building 2D maps, it has recently been extended to building 3D models of the world (Moravec 1996; Payeur et al. 1997). According to this approach, the occupancy function mocc = F(x; y; z), which maps 3D points of the world (x; y; z) onto an interval [0; 1], is de ned, so that higher values of F(x; y; z) indicate points (x; y; z) that are more likely to be occupied. The occupancy-based approach is superior to other approaches for its simplicity in representing and maintaining the world model (Thrun 1998). The current approach, which involves using a 3D grid of points to store F, has three major bottlenecks. First: the grid representation of the occupancy function, requires a huge amount of memory. In fact, according to Moravec, it is this restriction which is the main obstacle to building 3D occupancy world models. It requires the update of several million voxels for each ray of view in order to build a model of a 6 m by 6 m room. Using Octrees helps to reduce the amount of memory, but a still better way of representing the occupancy function is needed. Second: the rules used to update the occupancy states of grid cells, such as the Bayesian rule and the Dempster-Shafer rule (Pagas, Nebot, & DurrantWhyte 1995), are time-consuming in execution. Even if their approximations, such as the independent opinion pool rule (Payeur et al. 1997) and other evidenceaccumulating ad-hoc rules (Borenstein & Koren 1991; Jennings & Murray 1997) are used, it takes a considerable amount of time to update the state of the whole grid. This is because each new piece of range data requires the update of all grid voxels along the ray of view. Third: the grid-based occupancy model of the world is ine�cient in navigation planning, as it is di�cult to deal with the 3D arrays when searching for a path to navigate. Our research suggests using a parametric model in place of a grid model. This alternative represents the occupancy function as two piecewise linear functions de ned on three dimensional space and representing evidence for occupancy and evidence for emptiness. Both functions drop to zero at points where there is no information. Surfaces of objects are extracted from this model by choosing a xed level of occupancy, e. g. 0.5. This model has desirable properties for storage and processing that scale well as the size and complexity of the environment grow.
Parametrical representation
We formulate building the occupancy function as a regression problem as follows. Given a set of sample points (x; y; z) along with (noisy) values of occupancy mocc = F(x; y; z), nd an approximation of the underlying function F on the whole input domain. In our case, the regression tool is the Adaptive Logic Network (ALN) (Armstrong & Thomas 1997), which realizes a function of several variables as a tree of maxima and minima applied to linear functions of those variables. The ALN technique uses a least-squares technique to t piecewise linear surfaces to sample data. As a result of the tting process, called training, the ALN produces a real-valued, piecewise linear continuous function of three variables (see Figure 2). During training, a linear piece of the function splits into two pieces if the mean error over the samples activating that piece exceeds an allowable level. In this way, the ALN grows, eliminating the need for prespecifying an architecture. The depth of the tree and the number of linear functions at the leaves is determined either by limiting training to a prede ned number of iterations through the sample data (epochs) or by a prede ned allowable error. In the ALN, the allowable error is a Root Mean Square Error (RMSE). Since the least squares approach is known to be very susceptible to outliers, extra care must be taken to get rid of outliers in the image processing stage. The learning algorithms can also be modi ed to improve outlier rejection.
Building a sensor model
Using range data evidence values Each point, registered by a range sensor, provides occupancy information on all points along the ray of view. This information comes from a sensor model, which assigns to each point a value of evidence mocc that the point is occupied. Figure 3.a shows a typical sensor model. Points which are close to an observed feature in the environment are given values of evidence mocc close to one, while others are given values close to zero. Expressing the sensor model using training data
In grid based approaches, a function de ned by a sensor model (like that shown in Figure 3.a) is built by assigning occupancy values to each grid cell lying on a ray of view. In our approach however such a function can be very e�ciently represented by just a few linear pieces (see Figure 3.b). In order to achieve this representation, we just have to generate and incorporate into the training data a small number of sample points derived from each registered 3D point. Suppose a sensor registers a 3D point A at a distance r with con dence mocc . Then ve training set points are created as shown in Figure 3.b: two with evidence mocc to account for error in depth calculation, two with evidence value lower than mocc to correspond to decreasing occupancy values along the ray towards
Key idea:
How this is achieved:
Approximating a function using piecewise linear surfaces y f(x)
a) A
.
.. . C .. . . . E
B
MIN
b)
MIN
D
. .
x new
. - sample points
MAX
MIN C
D
MAX
F A
B
E
F
x c RN L
is a linear function
Figure 2: Approximating a function with linear surfaces. the camera, and one in the center of the robot with evidence value equal to zero. In order to deal with absence of knowledge behind an occupied point, the occupancy function is postprocessed in such a way that all values exceeding a threshold (say 0.9) are set to zero in a discontinuous fashion. However this step can be omitted if the world model is going to be used for map extraction only.
Change of coordinates and monotonicity condition
We introduce a coordinate system that uses the pan angle � (radians), the height h (decimeters) relative to the level of the centre of the PTU, and the distance from the PTU centre r (decimeters), as seen in Figure 3.a. We make one assumption about the ALN that will be used to create the occupancy function of the environment as seen from a single robot location. We assume that the occupancy function is strongly monotonic increasing in r. The coe�cients of the linear functions used in the ALN are just the partial derivatives of the linear functions. During training, the coe�cient of r is restricted to be positive, and because the maximumand minimum nodes combining these pieces produce continuous functions, the entire function must be strongly monotonic increasing. Beyond this, it is possible to put upper and lower bounds on the change of occupancy with respect to pan angle and height. This corresponds to an assumption that large changes in the depth of features do not occur at precisely de ned pan angles or heights. In reality, it can happen, but the errors in acquisition suggest imposing a more gradual change, the usefulness of which will become apparent when we derive a 2D polygon for robot navigation. Although we prefer to use monotonicity in r in a spherical coordinate system for purpose of world modeling, the above coordinate system and assumptions have several advantages for local straight-line navigation: 1. The a priori knowledge reduces the amount of training data.
a)
m occ
z
ray of view
y
r
b)
m
occ
h A (α,h,r)
α x
A
r
Figure 3: Monotonicity of occupancy, change of coordinates. 2. It allows the inversion of the function mocc = F(�; h; r) to obtain a function r = F ?1(�; h; mocc), which will be used in map building. 3. It allows somewhat e�cient approximation of vertical walls and horizontal surfaces such as the oor, and nally 4. It suits the shape of the robot's eld of view, wherein it can determine depth to a given accuracy.
Extracting Maps for Navigation
Once the 3D occupancy model of the world is constructed as a tree of minima and maxima of linear functions of three variables, it is possible to determine a 2D polygon within which it is safe for the robot to navigate.
Occupancy Function Inversion
The area with occupancy level mocc less than a certain threshold (e. g. 0:2), is considered unoccupied and therefore available for navigation. In order to nd this area, the rst step is to invert the occupancy function, so that the inverse function returns a distance within which it is safe to move as a function of pan angle, height and occupancy. This can be done theoretically due to the strong monotonicity condition imposed on the learned occupancy function. Thus if a criterion of 0.2 occupancy is set as the upper bound of occupancy allowable for navigation, then the inverted function with this value as its occupancy input will compute how far the robot could move in a certain direction without encountering occupancy that will likely produce a collision.
The ALN tree based representation of the occupancy function allows the inversion to be done very e�ciently. The inverted ALN is constructed as follows: in the original ALN tree, each maximum node is replaced by a minimum node, and each minimum node by a maximum. Then the original weights on variables, which are normalized in such a way that the weight on the output variable (occupancy) is -1, are all multiplied by the same non-zero constant so that the new output variable r has weight -1. The simplicity and speed of this inversion is one of the major advantages of using ALNs for robot navigation.
Computing navigation polygons
The inverse occupancy function, which can be now written r = F ?1(�; h; mocc) where the occupancy is xed at some level, say mocc = 0:2, is now applied at several values of height h to nd out the longest straight-line distance that the robot can move. The r value p is converted to a horizontal distance by taking r2 ? h2 as illustrated in Figure 3. The result of this computation is a set of polygons obtained at di�erent heights centred at the robot's current position. Since upper and lower bounds were imposed during training on the weights for pan angle, height and distance of all linear surfaces, it is possible to use a nite set of height values and yet be sure that no point on the robot at any height will collide with any point of the environment exceeding a certain value of occupancy.
Allowing for the shape of the robot
The nal step in calculation of the polygon of the 2D local map of the area available for navigation consists in shrinking all polygons by the size of the robot and taking the intersection of their areas. This ensures that the whole body of the robot can go in a straight line to any point inside the intersection polygon. The polygon boundary far from the robot is most susceptible to error. This could be the result of absence of depth data or error in depth estimation. This led us to upper-bound the distance to the periphery of the polygon from the robot position(e. g. with distance at most one meter). Thus, the polygon's points lie on a circle of radius one meter, except where the occupancy of the environment causes incursions into the circle.
Obstacle and exploration points
The points of the navigation polygon which lie inside the bounding circle represent obstacles. Obstacle points are de ned for evenly spaced angles in angular sectors where obstacles occur. Later these points will be given negative reinforcement values to keep the robot from hitting the obstacles. Points of the navigation polygon on the periphery of the one meter circle represent points where the knowledge of the environment becomes undependable, so further data must be collected near them. A collection of exploration points is de ned at evenly spaced angles in
sectors where the navigation polygon lies on the circle. The density of exploration points is chosen to be just adequate to nd channels through which the robot could pass, but which may not be observable from the current robot position. Exploration points will later have positive reinforcement values, thus encouraging the robot to move near to exploration points.
ALN reinforcement learning
Reinforcement learning occurs when a system learns, from environmental feedback, to what degree its past actions have been satisfactory. It uses this information to determine future actions. A recent book (Sutton & Barto 1998) provides an introduction to reinforcement learning. The model is as follows. If the system is in state st at time t, and a certain action at is taken, then it enters state st+1 and receives reinforcement rt+1. We shall model the next state and the reinforcement as deterministic functions of the current state and action. A policy � speci es what action to take in any given state. A policy must be developed taking into account how much reinforcement is received at t + 1 as a result of an action at time t, and how much will be received for all subsequent actions under the policy. In this way, a policy can determine an action which is likely to increase reinforcement over the sequence of all future actions. The measure of the present and all future reinforcements is the discounted reinforcement de ned as V � (s) =
1 X i=0
i rt+1+i
(4)
where actions are taken according to � and 0 < < 1. This is referred to as the state-value function or simply the value function for policy �. For the optimal policy V � , which produces the greatest discounted reinforcement that the system can achieve over all possible future actions starting from state s, Bellman's equation (Bellman 1957) is satis ed: � 0 V � (s) = max (5) a (r(s; a) + V (s )) where s0 is the state resulting from applying action a to state s. The way we have applied reinforcement learning to navigation is similar to the work of others (Jennings & Murray 1997; Thrun 1995; Thrun & Buecken 1996), where the states of the system are positions of the robot. The reinforcement resulting from an action is determined by whether the new state is close to the goal or close to a point that requires further exploration, or whether it is close to an obstacle. The former situations give rise to positive reinforcements, while being close to an obstacle leads to negative reinforcement. Solving Bellman's equation gives rise to a state-value function that represents a potential eld, where the robot is attracted to exploration points and the goal, and repelled from obstacles.
An ALN learns to approximate V � by growing a tree of maximumand minimumoperators acting upon linear functions. The training algorithm adapts the weights of the linear functions and splits linear pieces into two if the error of a piece is too great, so that the tree grows. At a given input s, generally only one linear piece is responsible for forming the function value. It is found by searching the ALN tree, whereby the branch of the lesser input is chosen if the node is a minimum node and the branch of the greater input is chosen if the node is a maximum node. Training of the ALN is done by adapting the weights of that one responsible linear piece. A re nement of the procedure joins linear pieces by quadratic llets and splits the responsibility among a few linear pieces. The occupancy function is a mapping from a box in three dimensional space to real values, and the function is linear on pieces of the space which are abutting polyhedra. The state-value function for reinforcement learning has two inputs, namely the coordinates of the robot. To perform reinforcement learning, the value function being learned by the ALN is used to compute training values for itself: values of the expression on the right of Bellman's equation are used to de ne the target value for the function at the state on the left. The control policy after training is complete is � 0 �� (s) = arg max (6) a (r(s; a) + V (s )) where s0 results from action a. A signi cant speedup of computation is achieved using a piecewise linear value function approximant because many of the linear pieces that do not in uence the ALN computation for a given input point do not have to be evaluated. (Finding out the exact set of pieces that have to be evaluated is a computationally intractable problem; but a good heuristic solution is achievable.) This makes the ALN approach to reinforcement learning a promising candidate for real-time applications. To demonstrate that ALNs can learn complicated functions, the Q-function for basketball balancing was learned(Armstrong 1998a; Armstrong & Li 1998b). In this task, a basketball must be balanced on a \ nger" that moves in a horizontal plane only.
Reinforcement learning and navigation
The function r(s; a) giving the local reward was de ned using the sum of rewards at the arrival state s0 derived from all obstacle points, exploration points and the goal, if located. Each obstacle point was given a reward function zero everywhere except in the neighborhood of the obstacle point, where the graph was in the shape of a negative-pointing cone centred at the obstacle point. Various cone radii were tried, but the idea was to give a gentle repulsion to the robot if it came close to an obstacle point p~. Thus the contribution of the obstacle to the reward function robs;p (s; a) = minf0; (Vobs +
Sobs jjs0 ?p~jj)g. Here and in the following, Vtype is a xed value at the apex of the cone, and Stype is the \slope", i. e. the rate of change from that value as distance from ~p increases. These two parameters determine the height and the shape of the cone. We recall that s0 is a function of r and a. Each exploration point ~p was given a reward rexp;p (s; a) = maxf0; Vexp ? Sexp jjs0 ? p~jjg, which is an upward-pointing cone, where it is not constant 0. The goal point was given a similar reward rgoal;g (s; a) = maxf0; (Vgoal ? Sgoal jj~s0 ? ~gjj)g. Thus r(s; a) is the sum of all the contributions from obstacle points p~i , exploration points ~qj and the goal ~g that are currently known to the planner. With this reward function, the next step was to solve Bellman's equation. States s were randomly chosen in the area opened to navigation. The robot was given only a xed number of actions to apply in each state s. In the simulation, there were four possible directions of motion. For the real robot, eight possible directions were sampled at a constant, although it would have been better to do more sampling to get a better value of the maximum. The value function V (s) currently represented by an ALN was trained using the estimates V (s0 ) at the states s0 accessible through this nite number of applicable actions at s. This gave rise to a function approximating the value of each state under an optimal policy. The properties of the ALN that make it suitable for approximating the value function are discussed in (Keerthi & Ravindran 1996). Although a xed number of evaluations of V (S) was used above to determine the training value for solving Bellman's equation, it appears that one could actually develop an algorithm for computing the maximum over an in nite number of actions, based on the idea that everything can be made piecwise linear, and the number of pieces is nite. After reinforcement learning, the robot can be sent an appropriate direction to move so as to obtain maximal gradient of the state-value function.
Results
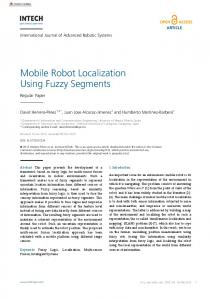
We tested Boticelli in an area surrounded by walls covered with camou age cloths to provide features. Figure 4 shows the GUI which runs on the vision computer after one robot cycle is nished. The GUI consists of four windows. A rst window displays 1) 3D depth information acquired by the robot by scanning the environment, projected onto the oor (the Oxy plane)with the robot in the center; 2) the last grabbed image, where some camou age cloth can be seen and 3) the features, the distances to which were calculated in the last frame. A second window shows the 3D occupancy model of the world. The points with the occupancy value higher than 0.2 are shown projected onto the oor. The circular appearance of the data is due to the uniform sampling in the coordinate system we use. The third window shows the navigation polygon extracted from the 3D occupancy function (before it is
Figure 4: User interface. cut by a circle of radius 1 meter). The fourth window is a log window, where we display such information as the number of features used, the number of epochs in training and the number of linear (or more exactly cylindrical) surfaces used in building the occupancy function. The GUI also shows the current state of the system as well as the voltage and the current of the robot's power supply. We allowed the robot to navigate and collect data; below is a summary of the results and observations. � Using a moving camera proved to be a good idea, as it allowed us to acquire range data around the robot precise enough to build local 3D models. At the same time, it was a�ordable and exible. � Using an ALN representation of the occupancy function, which describes the world as a tree of maxima and minima acting on linear functions of three variables showed itself to be a valid alternative to cumbersome 3D arrays of grid states. � At present, the result of fusing data using the ALN tting technique depends very much on a set of adhoc parameters, the main one of which is the number of linear pieces used. For simple environments, however, the general shape of the environment is preserved, which permits extracting information needed for navigation. � Extraction of local navigation maps proved to be ef cient and fast thanks to easy function inversion. � Reinforcement learning was fast enough to re-solve Bellman's equation for each new robot position. This
allowed the system to accept changes to the environment during navigation. A videotape was prepared showing successful operation of the robot in various activities: scanning for features to de ne the depth map, scanning to locate the goal, and paused while the reinforcement learning and path planning system computes a suggested motion.
Acknowledgements
This research was supported mainly by ......
References
Armstrong, W. W., and Li, D. 1998b. A new technique for reinforcement learning for control. In IEEE Conf.
on Systems, Man and Cybernetics, LaJolla CA, IEEE cat. no. 0-7803-4778-1/98 (CD-ROM).
Armstrong, W. W., and Thomas, M. M. 1997. Adaptive logic networks. In Handbook of Neural Computation, Section C1.8 IOP Publishing and Oxford U. Press, ISBN 0 7503 0312 3.
Armstrong, W. W. 1998a. Reinforcment learning applied to simulated basketball balancing. In Proc. Int.
ICSC-IFAC Symp. on Neural Computation, Vienna, (CD-ROM), Sept 21 - 25. Bellman, R. 1957. Dynamic Programming. Princeton
University Press. Borenstein, J., and Koren, Y. 1991. Histogramic inmotion mapping for mobile robot obstacle avoidance. IEEE Journal of Robotics and Automation, Vol. 7, No. 4, pp. 535-539.
Jennings, C., and Murray, D. 1997. Stereo vision based mapping and navigation for mobile robots. In
Proc. IEEE International Conference on Robotics and Automation, pp-1694-1699. J.Rousseeuw, P. 1987. Robust regression and outlier detection. Wiley, New York (ISBN: 0471852333). Kanatani, K. 1993. Geometric Computation for Machine Vision. Oxford University Press.
Keerthi, S. S., and Ravindran, B. 1996. Use of neural and other function approximators in reinforcement learning. In Handbook of Neural Computation (see above), Section C 3.6. Martin, M., and Moravec, H. 1996. Robot evidence grids. In Carnegie Mellon University, Robotics Institute Technical Report CMU-RI-TR-9606, http://www.frc.ri.cmu.edu/ hpm/hpm.pubs.html.
Miura, J., and Shirai, Y. 1997. Vision-motion planning for a mobile robot under uncertainty. Int. J. of Robotics Research, Vol. 16, No. 6, pp. 806-825. Moravec, H. P. 1996. Robot spatial perception by stereoscopic vision and 3d evidence grids. In CMU-RI-TR-96-34 in http://www.cs.cmu.edu/Reports/robotics.html. Pagas, D.; Nebot, E.; and Durrant-Whyte, H. 1995. An evidential approach to probabilistic map-building reasoning with uncertainty in robotics. In Proceedings of Intern. Workshop, pp. 165-169. Payeur, P.; Hebert, P.; Laurendeau, D.; ; and Gosselin, C. 1997. Probabilistic octree modeling of a 3d dynamic environment. In Proc. IEEE Int. Conf. on Robotics and Automation, pages 1289-96, Albuquerque, NM. Sutton, R. S., and Barto, A. G. 1998. Reinforcement Learning - An Introduction. MIT Press,ISBN 0-26219398-1. Thrun, S., and Buecken, A. 1996. Integrating gridbased and topological maps for mobile robot navigation. In National Conference on Arti cial Intelligence, (AAAI-96), pp. 944-950. Thrun, S. 1995. An approach to learning mobile robot navigation. Robotics and Autonomous Systems, 15: 301-319. Thrun, S. 1998. Learning metric-topological maps for indoor mobile robot navigation. AI Journal 99(1), 21{71. Yamauchi, B.; Schultz, A.; ; and Adams, W. 1998. Mobile robot exploration and map-building with continuous localization. In Proceedings of the 1998 IEEE International Conference on Robotics and Automation, Leuven, Belgium.