m With reference particularly to the work of Peter Bradshaw and his associates, some ..... shear velocity was deduced from the Preston tube skin- friction data.
i',,i.
(
ELSEVIER
Boundary-Layer Relaxation After a Separated Region Ian P. Castro Department of Mechanical Engineering, University of Surrey, Guildford, Surrey, England
Eleanora Epik Institute of Engineering Thermophysics, National Academy of Sciences of Ukraine, Kdev, Ukraine
mWith reference particularly to the work of Peter Bradshaw and his associates, some remarks are made about the recovery of previously distorted shear flows. It is emphasized that such recovery is usually extremely slow, and this is further illustrated by new measurements of the velocity field and turbulence structure in the relaxing flow downstream of a separated region. Data have been obtained for downstream distances (x) up to about 20 times the length of the separated region (Xr), or about 75 times the flow thickness at reattachment. This is a significantly more extensive region than has been previously studied, and the data are more comprehensive than any previously available. It is shown that the recovery is even slower than previously surmized. Furthermore, the measurements demonstrate that the turbulence stresses eventually fall below standard boundary-layer values (at the same Reynolds number), although around reattachment they are very much higher, having values more akin to those in plane mixing layers. This undershoot is apparently a new finding and is argued to be a result of the influence of the outer part of the flow on the growing inner region. The usual log-law only begins to appear beyond x/x r = 2.5. It effectively "sees" a turbulent outer region that recovers even more slowly than itself, and the response of the inner region therefore has similarities to the response of an ordinary boundary layer to free-stream turbulence. It is concluded that even current second-order (i.e., Reynolds stress) models may not capture the exquisitely slow decay of the strong, large eddy motions in the outer part of the flow and the subtleties of their influence on the inner region. © Elset.,ier Science Inc., 1996 Keywords: turbulence, boundary layer, flow separation, turbulence
relaxation
INTRODUCTION It is well known that classical, turbulent shear flows (boundary layers, mixing layers, wakes, jets) recover only slowly, sometimes very slowly, from the disturbing effects of mean flow distortions. This has been amply demonstrated in laboratory experiments, and Peter Bradshaw, in honor of whom this paper was presented,* has done more than anymore to elucidate many of the subtle processes involved. His work on curved boundary layers is typical. In the case of response to a region of convex curvature, he
* The new experimental results given here were, in fact, first presented briefly at the tenth Turbulent Shear Flow Symposium at Pennsylvania State University in Summer 1995 but, because they are given here, are not included in the issue of this journal devoted to that meeting.
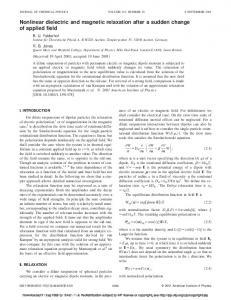
showed that the stabilizing effect of the curvature led to virtual collapse of the transport velocities so that, on removal of the curvature, newly produced turbulence was "trapped" in the region of its production, leading to significant overshoot in the stress levels further downstream before their recovery to more standard values [1]. Figure l a shows the normalized shear stress at selected stations. Not only is the recovery of the stresses n o n m o n o tonic, but it is also very slow; profiles at 286° and 546~, where 6e is the boundary-layer thickness at exit from the curved region, are virtually identical. This behavior is not dissimilar to that shown earlier by Castro and Bradshaw [2] for a plane mixing layer subjected to strong, stabilizing curvature and, more recently, by Alving et al. [3], again in the context of boundary layers in convex bends. In the former case, turbulent velocity triple products were reduced catastrophically by the curvature, and the subse-
Address correspondence to lan P. Castro, Department of Mechanical Engineering, University of Surrey, Guilford, Surrey GU 5XH, United Kingdom.
Experimental Thermal and Fluid Science 1996; 13:338-348 © Elsevier Science Inc., 1996 655 Avenue of the Americas, New York, NY 10010
0894-1777/96/$15.00 PII S0894-1777(96)00092-1
Boundary-Layer Relaxation 0.003
•
°
i
i. 0.0025
J
0.002 ~1 o
•
i
-
•.~ 0 . 0 0 1 5
8
0.001
n
0.0005
~ n l
0
/
|
0
0.2
0.4
0.6
0.8
1
.2
y18 0.0025
•
I
=
°1
0.002
Ik
rl
[]
i
0.0015
I;
o.ool i
0.0005
•
0 0.2
i
[]
LO
A
0.4
0.6
0.8
1
1.2
y18 Figure 1. Boundary-layer shear stress profiles downstream of a region of curvature, redrawn from the data of Smits et al. [1]. (a) Convex curvature: solid line, regular zero pressure gradient boundary layer; solid circle, at exit from the curved region (where flow thickness is 6~); further downstream at x / 6 ~ = (open square) 8; (open diamond) 28; (plus sign) 54. (b) Concave curvature: solid line, regular zero pressure gradient boundary layer; solid circle, at exit; further downstream at x / 6 c = (open square) 6.5; (open diamond) 23; (plus sign) 45.
quent overshoot above the "standard" values in both shear stress and turbulent kinetic energy on removal of the curvature was significant. Likewise, there can be a nonmonotonic recovery of the turbulent stresses subsequent to a region of concave (destabilizing) curvature. Figure lb shows a selection of shear stress profiles for that case, again taken from Smits et al. [1]. Here, the curvature produces much stronger shear stress gradients, which reduce the mean velocity shear so that, on removal of the curvature, there is much less turbulence production and the stresses fall below their standard values before eventually (presumably) recovering. Note again that profiles at 23 6e and 45 6e differ very little, indicating very slow recovery to the regular flat plate boundary-layer state. In this case, unlike those referred to above, even the turbulence structural parameters (quantities such as fi-{/q2, e.g.) do not recover monotonically. Bradshaw called the fact that the shear stress is apparently still decreasing at the last measurement station a
339
"most spectacular consequence of destabilizing curvature." One is tempted to inquire just when full recovery can be expected! Other kinds of distortion are generated when a flow separates and then reattaches. Such flows are ubiquitous in industrial and environmental engineering, and extensive work has been undertaken by numerous authors. This has most often been on the backward-facing step flow--for example, Kim et al. [4] and Adams and Johnston [5]. However, other geometries also have been studied--for example, the blunt flat plate by Cherry et al. [6] and Dyban et al. [7] and the normal flat plate with a splitter plate by Ruderich and Fernholz [8] and Castro and Haque [9, 10]. Some of these studies have concentrated on the nature of the separated region itself (with many of the results reviewed by Castro, 11), whereas others have been more concerned with the recovering flow downstream of the separated region. One of the earliest seminal papers on relaxation behind a separated flow is that of Bradshaw and Wong [12], who reviewed previous work on flow over fences and steps and presented some further measurements for the backstep flow. The measurements were not very comprehensive, being largely confined to mean flow quantities, but were sufficient to demonstrate that the flow was "surprisingly complicated." They were the first to suggest that turbulence length scales, typified by the dissipation length scale, are roughly constant across the flow just beyond reattachment, falling very rapidly toward the wall. This feature of reattaching flows has been confirmed since (and for various geometries), although there has been disagreement about its implications for the nature of the large eddies. Bandyopadhyay [13] has described the turbulence structures in the reattaching and recovery regions (for the backstep case) in some detail and suggests how previous disagreements can be reconciled. His work emphasizes that, even 39 step heights downstream (about 6xr, where x r is the distance from separation to the mean reattachment point), the eddy structure remains very different from that of a regular boundary layer. That the flow is extremely slow to recover has also been confirmed more recently by Jovic and Browne [14], who emphasized the point made implicitly by Bradshaw and Wong [11] that the outer flow recovers much more slowly than the inner layer. Similarly, Jovic [15] has found that the mixing length and eddy viscosity in the outer part of the flow exceed normal values by as much as four times even at the last measuring station, some 9xr downstream of the mean reattachment point. Now in some respects this apparent fact that the outer flow recovers more slowly than the inner is curious. One could argue that the inner layer would be unlikely to "recover" fully, in the sense of being able to develop just like a normal boundary layer, until beyond the point at which the outer region has "recovered," because it sees an abnormal outer flow throughout its initial development. Indeed, the outer flow is essentially the remnants of the highly turbulent flow at reattachment, which has more in common with a mixing layer than a boundary layer (although it is unlike the former in important respects). It is therefore very likely that this outer flow, dominated as it is by large eddy structures and, initially at least, considerable energy production, would significantly affect the development of the inner region. Dyban et al. [7] suggested just such an effect, finding similarities between the inner re-
340
I.P. Castro and E. Epik
gion far downstream and the boundary layers affected by free-stream turbulence. On the other hand, the converse argument--that the outer flow can recover only when its inner "boundary" looks normal--also may have some merit; perhaps, in view of the inevitable strong interplay between inner and outer regions, there is a sense in which both must recover together. A closer study of these points requires more information than is currently available in the literature. In particular, there is a specific need for turbulence data extending b e y o n d 10Xr, which is (roughly) the downstream limit of existing data. This was one of the major motivations for the present work. Another was provided by the fact that the flow around reattachment is very dependent on the nature of the earlier separation process (i.e., by the particular geometry and upstream conditions). Turbulence stresses, for example, are significantly higher at reattachment in the case of a "flat plate plus splitter plate" combination than they are for the backstep case. Furthermore, in the former case, the addition of free-stream turbulence yields a rather different structure at reattachment than otherwise occurs [10]. One might expect the nature and rate of the downstream relaxation process to reflect these differences. This possibility has not been previously addressed. This paper discusses, on the basis of new experimental data and we hope in the spirit of much of Bradshaw's earlier work, the basic structure of a boundary layer recovering downstream of a separated region. The experiment was designed specifically to address the issues mentioned above by concentrating on the flow downstream of reattachment rather than the separated region itself. Here we present only the major features of the flow; a later paper discusses the turbulence structure and development in more detail and includes comparisons with numerical calculations [16].
surface pressure probe) was fixed at 7.7h by small adjustments to a flap hinged at the trailing edge of the plate some 2.4 m downstream. Two cases were studied: in the first, the free-stream flow was uniform and (nominally) irrotational and, in the second, free-stream turbulence was added by mounting a suitable biplanar, square-mesh grid 20 mesh lengths upstream of the plate's leading edge. Some data from this latter case are included in this paper, but we concentrate on the results obtained in the nonturbulent free-stream case. Normally, the trailing-edge flap would be used to ensure that the upstream flow approached the plate tangentially (by controlling the circulation around it). This was, in fact, how it was used in the case with no free-stream turbulence, but the addition of free-stream turbulence caused a rather earlier reattachment. The flap was therefore adjusted to provide a (small) positive, normal velocity component on the stagnation streamline, just sufficient to lengthen the separated region and yield reattachment at the same point as occurred in the other case. This naturally altered the surface pressure field in the region of the separation "bubble" and probably also the turbulence levels around reattachment (compared with those that would have occurred in a truly symmetric flow), but the pressure gradients further downstream remained very small (see later). In the free-stream turbulence case, the turbulence intensity (u'/Uo) and longitudinal integral scale (L x) ranged, respectively, from 5.1% and 3.2h at the leading edge location to about 2.8% and 4.8h at the most downstream measurement station (154h). The axial turbulence energy decay behind the grid, which had 12.2-mm bars on a 50.8-mm mesh (M), was obtained from longitudinal traverses with a single hot wire and was well fitted by the expression
2. E X P E R I M E N T A L A R R A N G E M E N T S
with C = 0.29, x o / M = 2.76, n = 1.22, and x measured (here) from the grid location. With L, = 1.5(u2)3/2/e, where • is the mean rate of dissipation of turbulence energy, and assuming isotropy of the turbulence field, the turbulence energy transport equation leads to the result
All the experiments were conducted in the B-tunnel in the Department of Mechanical Engineering at the University of Surrey. This has a working section some 4 m long with a cross section of 0.75 x 0.6 m, mean velocity variations below 0.25%, and free-stream turbulence levels below about 0.2%. A long, blunt, aluminium plate was used to generate the separated flow; Fig. 2 shows the setup. The plate thickness (h) was 9.6 mm, the Reynolds number based on this and the free-stream speed (U0) was about 6500, and the distance from the leading edge to the point of mean reattachment (located by using a small twin-tube
\ I
separated zone
/
/: grid I [ I
u
Y
robe --
K\ \ \ x ~ x \ x \ \ x \ \ x x x x \ x x \ x x x x x x x x x \ ~
×
~"'plate
" ~
flap
f Figure 2. Sketch of the experimental arrangement (not to scale).
--
u e / U 2 = C2[(x - Xo)/M]
n
,
L , / M = C[(x - X o ) / M ~1-n/2)]/n.
(1)
(2)
This expression was used to deduce the length scale ratio L , / 6 , where 6 is the boundary-layer thickness defined as the distance to the point at which the mean velocity is 0.99U0. L, is not, of course, identical with the longitudinal integral scale, L x, but it is of the same order and is an appropriate measure of the size of the energy-containing eddies. Spatial correlations at a few axial locations showed that, typically, Lx was about 0.9L, and lateral integral scales were about 0.55L x. (Later crossed-wire data indicated that v'/u' = 0.956 and w ' / u ' = 0.966, where dashed quantities refer to rms values, as usual.) Exact isotropy requires L Z = Ly = 0.5Lx, and previous studies of grid turbulence--Compte-Bellot and Corrsin [17], for example - - h a v e shown deviations from isotropy similar to those noted here, which imply a slightly different value for C in Eq. (2) than in Eq. (1). However, the resulting change in L, would be small (about 5%) and, for the present purposes, there was no point in characterizing the degree of anisotropy in great detail. The turbulence Reynolds num-
Boundary-Layer Relaxation ber based on the Taylor microscale (A) and the flee-stream rms velocity (i.e., Re~ = 15 R e L ) was over 100 at all measurement stations, just large enough for a - 5 / 3 inertial subrange to be discernable in energy spectra and therefore allowing the rate of energy dissipation to be deduced from the spectra by fitting to the standard inertial subrange--with Grant et al.'s [18] value of the subrange constant. Standard hot-wire anemometry was used for most of the velocity and turbulence measurements, with bridge outputs measured directly by using a Macintosh computer fitted with a National Instruments MIO16 interface card containing four analog differential input channels with programmable gain and offset (using its D / A converters). The LabVIEW "virtual instruments" package enabled comprehensive calibration and measurement routines to be created. Single wires were used for mean velocities and crossed wires, calibrated in yaw, using the effective cosine method [19], for all higher-order moments and spectra. With these well-attested techniques, errors in measurement of mean velocity and fluctuating stresses are believed to be no greater than those generally obtainable with sufficient care--see, for example, the estimates given in Kline et al. [20]. Near reattachment (7.4h < x < 13h, with x now measured from the leading edge of the plate) local turbulent intensities were too high for sensible use of crossed-hotwire anemometry. In this region, some Reynolds stress profiles were obtained by using a miniature pulsed-wire anemometer, as described by Castro and Haque [9]. All probes were calibrated in the free stream against a standard pitot static tube. Sampling rates and times (for hotwire probes) were typically 1-2 kHz and between 30 and 60 s, respectively, except for spectral measurements, which were obtained by averaging the appropriate transforms of 150-300 blocks of 2048 samples, obtained at rates of 5 kHz or 10 kHz with appropriate anti-aliasing filters. The plate was fitted with instrumentation ports to allow measurement of surface static pressures. Preston tubes of various diameters were used to obtain skin-friction data. All pressure measurements were made with the use of Furness micromanometers, whose analog outputs were measured directly by using the same A / D and computer system as that employed for the hot-wire anemometry. For both cases (with and without free-stream turbulence), the flow around reattachment was found to be adequately two-dimensional over a central region of the span of width of some 16-20 boundaryqayer thicknesses, or about 5.5x r. There was a noticeable curvature in the mean reattachment line, but the variation in x r over this span did not exceed about 10%. This is an extremely sensitive test of three-dimensionality; some checks on the spanwise variation of Ce much farther downstream yielded much smaller variations over a similar span.
60 50 40
T h e Mean Flow
_
11.9
0 1
10
100
t000
10000
y" F i g u r e 3. Mean velocity profiles (no free-stream turbulence). Note shift of five units in vertical scale for each profile above the bottom one. Numbers are x / x r values, and solid lines are standard linear/log-laws.
the case with flee-stream turbulence (FST). There is reasonable agreement between results obtained with tubes of different sizes, and final Cf data were taken from a faired curve through the results given by the smallest one, whose diameter corresponded to less than 25 wall units in every case so that the accuracy should not be too dependent on the existence, or otherwise, of an extensive log-law region. Note that before the Ce data were obtained, it was necessary to measure the wall static pressure variation along the plate. The results showed that, over most of the flow (in both cases), there was a small favorable pressure gradient. However, the parameter often used as a measure of the likely importance of the pressure gradient ( p / u u 3) d p / d x (where u~ is the surface-friction velocity), was below 0.001 over most of the development region, so pressure-gradient effects were insignificant. The familiar dip below the standard log-law (first noted by Bradshaw and Wong, Ref. 12, in the backstep flow) is still evident in the velocity profiles some 2.5x r downstream. At the final station, the extent of the log-law seems considerable, but this is fortuitous because, in the outer flow, the wake profile is being reestablished from below the log-law. Data for the FST case are similar but have an even weaker wake component at the final station. The mean flow data are summarized in Fig. 5, which shows Cf and the shape factor, H, plotted against momen0.005 0.004
q
•
•
•
0.003 KI
0.001 0 0
Figure 3 shows mean velocity profiles in the case of no free-stream turbulence (hereafter, NFST), plotted in wall units (i.e., u ÷ vs. y+ in the standard notation). The wall shear velocity was deduced from the Preston tube skinfriction data. This is shown in Fig. 4, for both NFST and
]( 1.76 "~--~- 2.43 ~ 3.78 .
0.002 3. R E S U L T S A N D D I S C U S S I O N
341
500
1000
1500
xy mill
F i g u r e 4. Surface-skin friction. Solid and open symbols refer
to FST and NFST conditions, respectively. Tube diameter: open triangle, 0.81; open circle, 1.24; open square, 1.48 mm.
342
I.P. Castro and E. Epik
tum thickness Reynolds number, Re 0. The general form of the relaxation process is similar in both flows and, for the NFST case, Cf and H are both within 5% of the normal value at the final station. Free-stream turbulence leads, for an otherwise regular boundary layer, to increased Cf and reduced H (by weakening of the wake component), and the FST data are in that sense consistent with the data of Hancock and Bradshaw [21]; they would not be expected to asymptote to the regular boundary-layer curves.
In terms of the definitions suggested by Bradshaw and Wong [12], the present flows are "overwhelming perturbations" in the sense that the boundary-layer thickness at reattachment is very much larger than its thickness at separation. The Clauser parameter, defined by G = (2/Cf)I/2(H-
1)/H,
falls to a minimum value of 5.0 about 16 6r downstream of reattachment (where 6 r is the boundary-layer thickness at reattachment). These values are similar to those found by Bradshaw and Wong for their step flow - 5 . 5 at 19.36 r. At the final measurement station (20xr downstream), G has recovered to 5.9 (5.4 in the FST case), which is still considerably below the standard (Coles') boundary-layer value of 6.8. These various mean flow results confirm the findings of previous workers, that recovery is very slow, but suggest that, by 20x r downstream, the standard inner (log-law)
0.0045
--
0.004
o oo o
0
0.0035 O
•
o
0.003
~
*
0.0025 1500
2000
2500
3000
3500
4000
3500
400O
4500
Ree a
1.6 1.5 1.4
o
z
o
1.3 1.2 l.l 1500
2000
2500
3000
4500
Ree
Figure 5. Skin friction (a) and shape factor (b). Open circle, NFST; solid circle, FST. Solid curves: regular zero pressure gradient boundary layer.
region is well established. However, the turbulence data, to which we now turn, show that this is not the case.
The Turbulence Field Turbulence Stresses Only a selection of our raw turbulence data is presented here. Figure 6 shows the development of the turbulent stresses in the NFST case, with all stresses normalized by the local wall stress. Notice first that, in the early stages of recovery, u--~ and u 2 (Figs. 6b and 6d) have maxima far from the wall and fall rapidly as the wall is approached. This is in clear contrast with the behavior of w 2 (Fig. 6c), which increases all the way to the wall and is a direct reflection of the flow structure around reattachment [9]. Similar behavior is observed in the FST case (not shown), although the stresses are then significantly higher. For example, the pulsed-wire data taken at x = 1.1_5x r show that the total maximum turbulence energy (q2/U(~) there is about 0.15, almost twice the value in the NFST case (0.077). This difference is a result of using the downstream flap to obtain a reattachment length identical with the NFST value. Without that adjustment, reattachment would have occurred much earlier, and the stresses would not have risen to such large values. (See Castro and Haque, Ref. 10, for a detailed discussion of the effects of free-stream turbulence on a separated region.) A more unexpected feature of the data is that all the stresses eventually fall below standard boundary-layer values. The latter, taken from Erm and Joubert [22] for a Re 0 of about 2800, are included in Fig. 6. This behavior is neither a Reynolds number effect nor a result of the surface stress levels being larger than usual (Fig. 5). Figure 7 shows the stresses at x / x r = 20 for both cases, and it is notable that the shear stress profile by that stage has fallen significantly below the normal curve, and the addition of free-stream turbulence makes virtually no difference. The latter is not true, of course, for the normal stresses, which tend to the free-stream values at the edge of the boundary layer. The shape of the shear stress profile is in fact very similar to that found by Hancock and Bradshaw [21] in their study of free-stream turbulence effects on boundary layers, for the case when the free-stream turbulence intensity and length scale were given by u ' / U o = 0.026 and L J 6 = 0.75, respectively. These values are close to the present data in the FST case where, at x / x r = 20, u ' / U o and L , / 6 are 0.028 and 0.8, respectively. It is clear that for y / 8 < 0.5, say, the stresses in the recovering NFST boundary layer are very similar to those that occur in the case of a regular boundary layer distorted by free-stream turbulence. These results therefore suggest that the outer region of the recovering boundary layer acts rather like free-stream turbulence as far as the development of the inner region is concerned. Furthermore, the addition of free-stream turbulence whose length scale is of the same order as the boundary-layer thickness over the major part of the recovery region seems to have only a secondary effect on the stress development, suggesting that the latter is dominated by the rate at which the "distorted mixinglayer" eddies around reattachment can be transformed to
Boundary-Layer Relaxation "outer-region boundary-layer" eddies. This process requires major changes in eddy structure [13], and freestream turbulence can provide only secondary influences to it. The mean velocity and shear stress data have been used to deduce eddy viscosity profiles. These have shapes very similar to those presented by Jovic [15] in the case of recovery after a backstep. With 8* and vt defining the boundary-layer displacement thickness and the turbulent eddy viscosity, respectively, the maximum value of u t / ( U o 6 * ) at each axial station, normalized by the standard boundary-layer value, is plotted against x / x r in Fig. 8. The overall behavior is qualitatively similar for both geometries. Jovic's data do not extend beyond about x / x r = 7, but the degree of quantitative agreement between his results and the present NFST case is perhaps surprising, given the very much higher stress levels around reattachment in our flow. Note that, at the last measurement station, the eddy viscosity is still significantly higher than its normal value. In the FST case, the normalizing Vto used in Fig. 8 is the value deduced from Hancock's [23] data for u ' / U o = 0.026, L , / ~ = 0.75. These data also collapse well, but this must be somewhat fortuitous because there is no reason to believe that the particular vt0 chosen is appropriate for the early stages of development, although farther downstream it may well be.
343
Other Quantities The triple-product and fourth-order turbulence data allow further useful comparisons. In Fig. 9 the transport velocity defined by 1/" = (vu 2 + v 3 ) / ( u 2 + v 2) is shown for three axial stations and in both cases. Note first that, despite the large difference in stress levels in the two cases at reattachment, this structural parameter is largely independent of the nature of the external flow. It is also noticeable that, by x / x r = 20, I/' in the inner region has recovered (from below) to values similar to those that occur for an ordinary boundary layer in the presence of free-stream turbulence. In the outer half of the flow, the values of I/' in the FST case are still significantly higher than this latter case, emphasizing that there is considerable recovery yet to take place and suggesting also that, in the NFST case, I/' may eventually fall below the standard boundary-layer values. An alternative way to view the triple-product data is to consider the behavior of the "diffusion function," first used in the calculation method of Bradshaw et al. [24] and defined by G d = ¼(-~u + v-~)/[ - u-v(- UU~"~max1/2]. This is shown in Fig. 10, which more clearly demonstrates that far downstream the transport of turbulence energy in the inner region is significantly higher than in a normal boundary layer and is, in fact, very similar to that found by Hancock and Bradshaw [21] for a boundary layer affected by free-
16 14
[]
0
171
[]
0
13 []
12 I0 8 6
+
+
+
~'
+ o
I"1
+ o
o
+ +_
0
0.2
0.4
A-I-
0.6
.
0.8
y16 a 8
I
O
7
0
0
[]
i []
I'
6
5 i
"
1"3 +
I
'1
"1
+
+
+
~_ I
" I"
0
0.2
0.4
0.6 y18
0.8
"
0
Figure 6. Stress profiles in NFST c a s e . x / / X r = (open square) 1.76; (bar) 2.43; (plus sign) 3.78; (open diamond) 5.14; (open circle) 6.49; ( × ) 9.19; (solid diamond) 11.9; (open triangle) 20. Solid curve is boundary-layer data of Erm and Joubert [22]. (a) u--~;(b) v--~;(c) w---2;(d) u--{.
344
I.P. Castro and E. Epik 12 []
I0
[] []
13
8
13
e4t., ,,st
w
¢;
6 13
4
4O
4-
4-
O
>
2
4-
°o
-
13
o
0
0
0.2
0.4
0.6
0.8
y18 6
[]
4
2
I'1
+
I
+
+
4-
0 0
0.2
0.4
0.6
0.8
y/6 Figure 6. Continued
d
stream turbulence. It is also very clear from Fig. 10 that even at x / x r = 20 the turbulence structure in the outer flow, whether or not free stream turbulence is present, remains far from normal. Use of the u' flatness factor to deduce intermittency indicates (Fig. 11) that at x/xr = 2.4 the intermittency profile is very similar to that measured directly by Bandyopadhyay [13] at about x / x r = 5 for a backstep flow and that even by X/Xr = 20 the profile is characterized by considerably lower values of intermittency than occur in a regular boundary layer. In fact, the profile change in the outer region between x / x r = 11.9 and 20 is insignificant, again emphasizing the extremely slow recovery. Finally, we make some remarks concerning length scales. Bradshaw deduced, on the basis of mean flow data and boundary-layer calculations [12], that the dissipation length scale just downstream of reattachment must increase much more rapidly with y than it does normally. This has subsequently been shown to be true by direct measurem e n t - - f o r example, by Kim et al. [4]. Figure 12 shows both the mixing length (Fig. 12a) and L , (Fig. 12b) at a few stations in the present NFST case. Note that here L, is defined by (-uff{)3/2/e. Although the mixing length recovers normally to its standard form in the inner region ( y / 6 < 0.2, say), it is clear that L , does not. There is an initial rise with y above the standard value (Ky) near the
wall beyond reattachment, confirming the behavior first noted by Bradshaw (note, however, that measurements were not made closer to reattachment than x = 1.76xr). Farther downstream, the whole profile (except very near the wail) falls below the standard profile. This behavior, first, confirms Bradshaw's conclusion from less-direct evidence that there must be very rapid reductions in length scale beyond reattachment and, second, indicates again a nonmonotonic and very slow recovery.
4. C O N C L U S I O N S Fuller discussion of these data is given in a subsequent paper, where more detailed results and, in particular, turbulence structure parameters, energy balances, and some numerical calculations are presented [16]. However, the results shown here are sufficient to indicate not only that boundary-layer recovery downstream of a separated region is even slower than previously suggested, but that the growth of the inner region is significantly affected by the outer part of the flow. In fact, the flow far downstream has characteristics similar, in the inner region, to those of a regular boundary layer affected by free-stream turbulence and, in the outer region, to those of a slowly decaying mixing layer affected by the presence of a paral-
Boundary-Layer Relaxation
345
5
I%
2
1
0
,. - -u,.-..,i,.....u.~ _r-L_.
0
0.2
0.4
0.6
qpu.,,..R... _ _
0.8
!
,. . . . . . .
,
1.2
1.4
1.2
1.4
1.2
1.4
y16 1.5
I'- o.,' "" - ?0
", ,,.. . . ,
_
,
0
0.2
0.4
I
0.6
0.8
1
y16 b 2 1.6
i1:1~
-
i
~'-!~ lu''m~--
1.2 o8
r-
i
0.4
o 0
0.2
, 0.4
~ ~ / , 0.6
• ._
0.8
1
y18 1 0.8 - ~ l ~ L " ~'-- ~_ I g 0.6 " - G I , I,_ 0.4 0.2 L 0 0 0.2 0.4
-" ~_ -'=--~
0.6
Figure 7. Stresses at x / x r = 20, normalized by u r 2. Open and closed symbols are for NFST and FST cases, respectively. Solid curve is regular boundary layer; dotted curve is Hancock and Bradshaw [21] with u ' / U o = 0.026, L , / 8 = 0.75. (a) u2; (b) v2; (c) w2; (d) u--v.
r- ~-'-~.,.
0.8
1
1.2
1.4
y18
lel wall. The latter has been noted before (originally by Bradshaw and his associates), but the former is, we believe, a new finding. It is expected that such a structurally complex flow will be difficult to predict, using current methods. For separation regions themselves, Bradshaw has surmized that a "fairly sophisticated model for triple products, preferably based on the triple-product transport equation" might be required [25]. Whether this is true for the recovering flow downstream remains to be seen; we believe it is likely, but some current calculations, to be presented in the subsequent paper, should illuminate this important question. We thank the Royal Society of L o n d o n for financial support (of E.E.) during the first part of the experimental program. T h a n k s are also
4.5
4
q=
3.5
MI
•+
; 3 "~ 2.5
+
I E] +
!
+ ..t.
2
+
[]
:
i
[]
1.5 1
0
l0
15
20
XlXr
Figure 8. Maximum eddy viscosity. Open square, NFST; solid square, FST; plus sign, Jovic [15].
346
I . P . Castro and E. Epik 0.1
NOMENCLATURE
0.08
:~
C
,I ._
0.06
[]
0.04
•
•
I
•
[] _
~
• o f
o
•
0.02 -~
",,
o ~
•
[]
0
o
~ &•
~
'2#
Lx,
-0.02 0
0.2
0.4
0.6
0.8
1
1.2
1.4
yh5
Figure 9. Transport velocity,
constant skin-friction coefficient G Clauser p a r a m e t e r diffusion p a r a m e t e r h plate thickness H shape factor l mixing length [ ( - ~)l/2//(SU/c~y)] Ly, L z turbulence integral length scale L~ dissipation length scale M mesh spacing P pressure q2 turbulence kinetic energy Rex turbulence Reynolds n u m b e r based on Taylor microscale Re 0 m o m e n t u m thickness Reynolds number U mean axial velocity u, v, w fluctuating velocity components (u', v', w' are rms values) u . wall friction velocity u + mean velocity in wall units - U / u ~ V' transport velocity x, y axial and vertical coordinates, with origin at the leading edge of the plate x 0 virtual origin
Cf
V ' = (uu 2 + u 3 ) / ( u 2 + u2).
x / x r = (open square) 1.76; (open circle) 6.49; (open triangle) 20. Open symbols, NFST; solid symbols, FST; solid curve, regular boundary layer; dashed curve, Hancock and Bradshaw data with u ' / U o = 0.026; L J d = 0.75. d u e to t h e w o r k s h o p s t a f f o f t h e D e p a r t m e n t o f M e c h a n i c a l E n g i n e e r i n g at the University of Surrey, who constructed the apparatus
with their usual care and cheerfulness. Because the final form of this paper was prompted by the symposium in honor of Peter Bradshaw, it is also appropriate to acknowledge our heartfelt appreciation of all his writing and deep insights into the structure of complex turbulent flows. Our debt to him should be obvious in the present work. 300
250 200
d
15o
°o
100
0
eo
•
t
o
A .
.
o
Figure 10. Diffusion function, G d = 3(u--~v + v 3 ) / [ - u - v ( - u--~m~)m/2]. Legend as in Fig. 9.
.
0
0.2
0.4
0.6
0.8
.
1
.
.
1.2
1.4
y/S 1
AO
0.8
i
"~° %
0.6 p..
0.4 m
Figure 11. Intermittency function, y = [u4/ (u--~)2]m~/ [u-Z/(u-'~)2]. Solid curve, regular boundary layer (from Ref. 23); dashed curve, x / x r = 5.8 downstream of backstep (from Ref. 13); present data, x / x r = (open square) 1.76; (open circle) 6.49; (solid diamond) 11.9; (open triangle) 20.
0.2
"'-%1
0 0
0.2
0.4
0.6
0.8
y/6
1
t.$ 1.2
1.4
Boundary-Layer Relaxation
347
0.25 0.2
-W
a
0.15 ~o
Q
0.1 0.05
o
o
0 []
[]
J
0
S-I" 0.2
" 0.4
0.6
" 0.8
1
y16 a
0.2
!a I q
0.15 []
¢.4D
,.I
I"1
i
0.1
0.05
1 A 0
0.2
0.4
0.6
0.8
y18
xr y÷ 6 t~ r
6* y • 3. u Vt
d i s t a n c e to m e a n r e a t t a c h m e n t p o i n t wall d i s t a n c e in wall units - y u ~ / u Greek Symbols b o u n d a r y - l a y e r thickness (to position at which U / U o = 0.99) b o u n d a r y - l a y e r thickness at r e a t t a c h m e n t location b o u n d a r y - l a y e r d i s p l a c e m e n t thickness intermittency function t u r b u l e n c e e n e r g y dissipation rate Taylor microscale k i n e m a t i c viscosity t u r b u l e n c e e d d y viscosity [ ( - u - ~ / ( d U / d y ) ] REFERENCES
1. Smits, A. J., Young, S. T. B., and Bradshaw, P., The Effects of Short Regions of High Surface Curvature on Turbulent Boundary Layers, J. Fluid Mech. 94, 209-242, 1979. 2. Castro, I. P., and Bradshaw, P., The Turbulence Structure of a Highly Curved Mixing Layer, J. Fluid Mech. 73, 265-304, 1976. 3. Alving, A. E., Smits, A. J., and Watmuff, J. H., Turbulent Boundary Layer Relaxation from Convex Curvature, J. Fluid Mech. 211, 529-566, 1990.
1 Figure 12. Mixing length (a) and dissipation length scale (b) profiles. Solid curve, regular boundary layer. Present data, x / x r = (open square) 1.76; (open circle) 6.49; (open triangle) 20.
4. Kim, J., Kline, S. J., and Johnston, J. P., Investigation of a Reattaching Turbulent Shear Layer, Trans. ASME J. Fluids Eng. 102, 302, 1980. 5. Adams, E. W., and Johnston, J. P., Flow Structure in the NearWall Zone of a Turbulent Separated Flow, A/AA J. 26, 932-939, 1988. 6. Cherry, N. J., Hillier, R., and Latour, M. E. M. P., Unsteady Measurements in a Separating and Reattaching Flow, J. Fluid Mech. 144, 13-46, 1984. 7. Dyban, E. P., Epik, E. Y., and Yushina, L. E., Influence of Free Stream Turbulence on the Development of a Boundary Layer after a Separation Region, J. Appl. Thermosci. 13, 3-10, 1991. 8. Ruderich, R., and Fernholz, H. H., An Experimental Investigation of a Turbulent Shear Flow with Separation, Reverse Flow and Reattachment, J. Fluid Mech. 163, 283-322, 1986. 9. Castro, I. P., and Haque, A., The Structure of a Turbulent Shear Layer Bounding a Separation Region, J. Fluid Mech. 179, 439-468, 1987. 10. Castro, I. P., and Haque, A., The Structure of a Turbulent Shear Layer Bounding a Separation Region, Part II: Effects of Free Stream Turbulence, J. Fluid Mech. 192, 577-595, 1988. 11. Castro, I. P., Turbulence in Incompressible Separated Flows, in Separated Flows and Jets, V. V. Kozlov and A. V. Dovgal, Eds., pp. 191-205, Springer-Verlag, Berlin, 1991.
348
I . P . C a s t r o a n d E. Epik
12. Bradshaw, P., and Wong, F. W. F., The Reattachment and Relaxation of a Turbulent Shear Layer, J. Fluid Mech. 52, 113-135, 1972. 13. Bandyopadhyay, P. R., Instabilities and Large Structures in Reattaching Boundary Layers, A/AA J. 29, 1149-1155, 1989. 14. Jovic, S., and Browne, L. W. B., Turbulent Heat Transfer Mechanism in a Recovery Region of a Separated Flow, in Engineering Turbulence Modelling and Experiments, W. Rodi and E. N. Ganic, Eds., Elsevier, Amsterdam, pp. 789-798, 1990. 15. Jovic, S., An Experimental Study on the Recovery of a Turbulent Boundary Layer Downstream of Reattachment, in Engineering Turbulence Modelling and Experiments, W. Rodi and F. Martelli, Eds., Vol. 2, pp. 509-517, Elsevier, 1993. 16. Castro, I. P., and Epik, E., The Structure of a Relaxing Boundary Layer Subsequent to Reattachment, in preparation. 17. Compte-Bellot, G., and Corrsin, S., The Use of a Contraction to Improve the lsotropy of Grid-Generated Turbulence, J. Fluid Mech. 25, 657-682, 1966. 18. Grant, H. L., Stewart, R. W., and Molliet, A., Turbulence Spectra from a Tidal Channel, J. Fluid Mech. 12, 241-268, 1962.
19. Bradshaw, P., An Introduction to Turbulence and its Measurement, Pergamon, Oxford, 1971. 20. Kline, S. J., Cantwell, B. J., and Lilley, G. M., Complex Turbulent Flows, Proc. of the 1980-81 AFORS-HTI'M-Stanford Conference on Complex Turbulent Flows, Vol. 1, pp. 583-585, 1981. 21. Hancock, P. E., and Bradshaw, P., Turbulence Structure of a Boundary Layer beneath a Turbulent Free Stream, J. Fluid Mech. 205, 45-76, 1989. 22. Erm, L. P., and Joubert, P. N., Low-Reynolds-Number Turbulent Boundary Layers, J. Fluid Mech. 230, 1-44, 1991. 23. Hancock, P. E., The Effect of Free Stream Turbulence on Boundary Layers, Ph.D. Thesis, Imperial College, London, 1980. 24. Bradshaw, P., Ferriss, D. H., and Atwell, N. P., Calculation of Boundary Layer Development Using the Turbulent Energy Equation, J. Fluid Mech. 28, 593-616, 1967. 25. Chandrsuda, C., and Bradshaw, P., The Turbulence Structure of a Reattaching Mixing Layer, J. Fluid Mech. 110, 171-194, 1981.
Received March 6, 1996; revised May 28, 1996