한국과학교육학회지, 29권 3호, pp. 348-358(2009. 5)
J Korea Assoc. Sci. Edu, Vol. 29, No. 3, pp. 348-358(2009. 5)
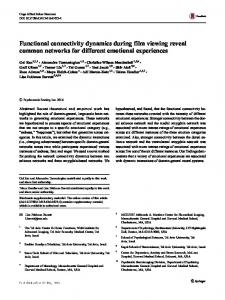
Brain Activation Pattern and Functional Connectivity Network during Experimental Design on the Biological Phenomena Il-Sun Lee∙Jun-Ki Lee∙Yong-Ju Kwon* Korea National University of Education Abstract: The purpose of this study was to investigate brain activation pattern and functional connectivity network during experimental design on the biological phenomena. Twenty six right-handed healthy science teachers volunteered to be in the present study. To investigate participants' brain activities during the tasks, 3.0T fMRI system with the block experimental-design was used to measure BOLD signals of their brain and SPM2 software package was applied to analyze the acquired initial image data from the fMRI system. According to the analyzed data, superior, middle and inferior frontal gyrus, superior and inferior parietal lobule, fusiform gyrus, lingual gyrus, and bilateral cerebellum were significantly activated during participants' carrying-out experimental design. The network model was consisting of six nodes (ROIs) and its six connections. These results suggested the notion that the activation and connections of these regions mean that experimental design process couldn't succeed just a memory retrieval process. These results enable the scientific experimental design process to be examined from the cognitive neuroscience perspective, and may be used as a basis for developing a teaching-learning program for scientific experimental design such as brain-based science education curriculum. Key words: experimental design; brain activation pattern; functional connectivity network, fMRI
I. Introduction Testing hypotheses has been considered as a justification and deductive process of scientific knowledge generation (Kwon et al., 2003) and regarded as one of the core reasoning processes in creative thinking and scientific discovery (Klahr & Dunbar, 1988; Kuhn et al., 1988; Lawson, 1995; Kwon et al., 2000; Kwon et al., 2003). Therefore, a process of the experimental design (or invention of hypothesis-testing methods) is the most important procedure in generation of scientific knowledge (Klahr & Dunbar, 1988; McPherson, 2001). Many previous studies of the science education showed that experimental design plays an important role in the scientific inquiry (Jeong & Kwon, 2007; Kwon et al., 2007; Park, 2003; McPherson, 2001). In the context of cognitive psychology, the process of experimental design is an interactive procedure between declarative knowledge and
procedural knowledge in the working memory of the brain (Elliot & Dolan, 1998; Gagne et al., 1997). After all, students' scientific inquiry processes including experimental design were actually happen in their brain. In other words, different thinking resulted from different brain activation pattern. However, almost all of previous studies based upon indirect research methods such as paper and pencil test, interview, and questionnaire. Therefore actual brain activation pattern in intact brain was still remains unclear. Recently, brain imaging technology (such as CT scan, PET, MRI, fMRI, and EEG) has enables us to understand directly the function of the living brain. These brain imaging methods help us to analyze the relationships between specific areas of the brain and the functions they serve. Particularly, fMRI is an non-invasive method of the imaging of the intact brain and essential for studying various functions of the brain (Buxton, 2002).
*Corresponding author: Yong Ju Kwon(
[email protected]) **Received on 27 April 2009, Accepted on 25 May 2009 ***This work was supported by the Korea Science and Engineering Foundation (KOSEF) grant funded by the Korea government (MEST) (No. KOSEF R01-2007-000-11166-0).
Brain Activation Pattern and Functional Connectivity Network during Experimental Design on the Biological Phenomena
It has been proposed that functional brain architecture abides by two principles, namely, functional segregation and functional integration (Zeki & Shipp, 1988; Tononi et al., 1998). While the segregation principle states that some functional processes specifically involve well-localized brain regions, the integration principle acknowledges that even simple behaviors imply the merging of information flows across many systems distributed in the whole brain (Passingham et al., 2002). It is only through a subtle balance of these two principles that the brain can efficiently process functional tasks. Segregation and integration have been at the center of much attention in many areas of neuroscience, including theoretical neuroscience and neurocomputing, neuroanatomy, electrophysiology, and functional neuroimaging (Sporns et al., 2004). Characterizing brain activity in terms of the functional specialization of sensorimotor and higher cognitive brain areas is the primary approach to functional neuroimaging data. However, characterizing brain activity in terms of functional specialization does not reveal anything about how different brain regions communicate with each other, despite the fact that communication is an implicit assumption of this specialization. For instance, the neural correlates of semantic processing can be identified using written words by virtue of the assumption that visual regions interact with semantic regions. Thus, analyses of neural activity based solely on functional specialization provide only a limited account of the neuronal substrate of the processes investigated. Alternative approaches have therefore been developed, in the context of functional neuroimaging, to investigate the integration of functionally specialized areas (Lee et al., 2003). Blood oxygen level dependent (BOLD) functional magnetic resonance imaging (fMRI) is an imaging technique that makes it possible to dynamically and noninvasively follow metabolic and hemodynamic consequences of whole-brain neural activity (Huettel et al., 2004). As such, it stands as a potentially powerful candidate for in
349
vivo investigation of functional integration within brain networks. Indeed, it is now increasingly accepted that datasets acquired with that modality convey relevant information relative to functional integration; to what extent such information is available, though, is an issue that remains open and subject to controversies (Horwitz, 2003; Lee et al., 2003). In fMRI, most approaches to study integration rely on either functional or effective connectivity (Friston, 1994; Marrelec et al., 2006). The functional connectivity between two voxels or regions is defined as the temporal correlation between the voxel or region time courses (Friston et al., 1993). This definition strongly relates to that of Hebbian neural assemblies (Hebb, 1949), and is moreover thought to be a relevant spatial scale to study such neural assemblies (Varela et al., 2001). Measures of functional and effective connectivity then characterize the level of interregional integration for each possible pair of regions in a given set of brain regions that has been selected by the investigator. Recently, Kwon et al. (2009) and Kwon & Lee (2007) reported to students' and biologists' brain activation patterns during the hypothesisgenerating. Also, Kwon et al. (2007) investigated the pre-service elementary school teachers' brain activation pattern during invention of hypothesis-testing methods about biological phenomena. In this study, they were focused on the sub-steps of the hypothesis-testing process (① recognition of hypothesis � ② representation of relation of variables � ③ representation of experienced situations � ④ construction of hypothesis-testing methods). However, they could not know about whole representative brain activation pattern or neural network of the experimental design because they used separated paradigm. Therefore, in this study, we used functional magnetic resonance imaging (fMRI) to investigate the neural responses associated with the experimental design process at the aspects of not only regional activation pattern but also functional connectivity network.
350
Il-Sun Lee∙Jun-Ki Lee∙Yong-Ju Kwon
Ⅱ. Methods and Procedure 1. Participants Twenty six right-handed (12 males and 14 females), healthy science teachers volunteered to be participants in the fMRI experiment (age 27.57 ±3.72). All participants of this experiment had normal or corrected-to-normal visual acuity, no history of neurological, psychiatric or major medical illness, and were judged as the righthanded according to the Edinburgh handedness inventory (Oldfield, 1971). Each participant gave their informed consent prior to their inclusion in the experiment in accordance with the Declaration of Helsinki. The study was approved by the Ethics Committee of KNUE (Korea National Univ. of Education). 2. Development of the fMRI experimental tasks To control and equalize the difficulty and the contents spectrum of the tasks for the fMRI stimuli, this study developed the tasks through the following R&D process (Borg & Gall, 1989). First, this study designed 40 task items for stimuli. Then, this study had a pilot test of the experimental design task to a separated group of 30 participants (another group who do not participated in this study). After the pilot test, the task items were selected and edited by the pilot test results. This study improved the validity and reliability of the task by repeating this process several times. Finally, unacceptable 22 items were deleted, and 9 items were selected for exercise
task. Therefore, the other 9 items were selected for main experiment (Table 1). The content validities of these tasks were investigated. To obtain a measure of the face validity of the test, nine professors with relevant expertise and eight graduate students majoring in science education were asked the question,“Do you agree that the tasks can assess the brain activation pattern of participant in the experimental design?”The average validity was 0.94. 3. fMRI experimental task conditions and procedure The experimental paradigm was consisting of 9 tasks (Fig. 1). Each task started with a blank slide for dummy phase (12s) followed by notice slide (3s). The notice slide, we have announced the task name (e.g.‘experimental design’ ) to participants. When the main task was stated, the text slide (12s) was presented before the experimental design slide. This slide containing the scientific question and hypothesis of the biological phenomenon. Finally, enlarged picture of the biological phenomenon was presented to participants (24s). During this phase, participants should have designed experiments to test presented hypothesis. At the end of the trial the white crisscross fixation was presented for 12s. The participants were instructed to keep their eye open at all times and to fixate the central cross to minimize eye movements. Schematic diagram was showing exemplars of the stimulus display and the timings used in this study (Fig. 1).
Table 1
Topics and levels of the fMRI experimental tasks used in this study Topic
Animal
Plant
Microorganism
Under individual
1
1
1
Individual
1
1
1
Over individual
1
1
1
Total No. of tasks
3
3
3
Level
Brain Activation Pattern and Functional Connectivity Network during Experimental Design on the Biological Phenomena
351
Fig. 1 Schematic representation of fMRI experimental design. The experimental paradigm was consisting
of 9 tasks. In this figure, a representative trial was presented. See the text for explanation. 4. fMRI data acquisition Anatomic T1 volume images and functional T2*-weighted magnetic resonance (MR) images were acquired with a 3.0T MR scanner (ISOL, KOREA) with standard head coil. Functional images were acquired using a T2*-weighted gradient-echo, echo planar pulse sequence (30 continuous slices parallel to the anterior-posterior commisure [AC-PC] line covering the whole brain, repetition time [TR] = 3,000 ms, echo time [TE] = 35 ms, flip angle = 80 degree, field of view [FOV] = 220×220 mm2, matrix = 64×64, slice thickness = 5 mm). Immediately after the functional scanning, a high-resolution T1-weighted anatomic scan was acquired for each subject. 5. fMRI data analysis Image processing and statistical analysis were carried out using SPM2 (Wellcome Department of Cognitive Neurology, http://www.fil.ion.ucl. ac.uk/spm) implemented on MATLAB ver. 7.0 (The MathWorks, Natick, MA). Data from one subject were discarded due to the presence of artifacts in the functional images. The first five
volumes of each subject were discarded due to allow for T1 equilibration effects. For each subject, all volumes were spatially realigned to the first volume of the first session to correct for betweenscan motion, and a mean image from the realigned volumes was created. This image was spatially normalized to the Montreal Neurological Institute (MNI) brain template (Evans et al., 1993). The derived spatial transformation was then applied to the realigned T2*-weighted volumes, which after normalization were resampled. All functional volumes were then spatially smoothed with an 8-mm full-width half-maximum (FWHM) isotropic Gaussian kernel to compensate for residual between-subject variability after spatial normalization (to make comparisons across subjects) and to permit application of Gaussian random field theory for corrected statistical inference (Worsley & Friston, 1995). The resulting time series across each voxel were then high-pass filtered with an upper cut-off of 128s, using cosine functions to remove section-specific lowfrequency drifts in blood oxygen level-dependent (BOLD) signal. The statistical maps of the basic activation patterns were first computed. Data were analyzed
352
Il-Sun Lee∙Jun-Ki Lee∙Yong-Ju Kwon
using a random-effect model to generalize results to the population from which subjects were extracted (Friston et al., 1999), implemented in a two-level procedure. In the first level, for each subject condition effects at each voxel were estimated according to the general linear model (GLM) as implemented in SPM2 (Friston et al., 1995) and regionally specific condition effects were evaluated using linear contrasts to produce a contrast image. At the second level, the resulting contrast images from all subjects were entered into a single sample t test to assess the population mean effects. The entire process produced for each comparison of interest a statistical parametric map of the parametric map of the t statistics for each voxel. Maxima were reported in MNI stereotaxic coordinates for foci exceeding a highest threshold of p < 0.05, corrected for multiple comparisons. To avoid false positive, only clusters bigger than 20 voxels were considered (Forman et al., 1995). For visualization purpose, the foci of maximum activation were superimposed on a high-resolution anatomical image created by averaging the individual subjects' normalized T1 images with SPM2. The location of these foci in terms of Brodmann areas was determined using the nomenclature given by Talairach and Tournoux (1988) after correction for difference between the MNI and Talairach coordinate systems by means of a nonlinear transformation. ‘Functional connectivity’is defined as the “temporal correlations between spatially remote neurophysiologic events”(Friston et al., 1993). This definition provides a simple characterization of functional interactions. Functional connectivity is simply a statement about the observed correlations (Lee et al., 2003). The idea behind functional connectivity analysis is that regions that work together have similar temporal response profiles; therefore, a correlation coefficient between the activations of these regions across the time course should be high (Koshino et al., 2005). To compute the measure of functional connectivity, BOLD signals of activated
voxels were extracted from the selected-ROIs. For each participant, a mean time-course was computed across activated voxels in each ROI. A correlation coefficient was then calculated between the time-courses of pairs of ROIs. Finally, the significant functional connectivity networks among selected ROIs for hypothesisgenerating and hypothesis-understanding processes were constructed. We regarded the correlation's P value less than 0.05 (P < 0.05) as the significant correlation in this study.
Ⅲ. Results and Discussion 1. In-depth interview result After fMRI scanning, all of participants reported their actual thinking of each task through an indepth interview. Results of linguistic analysis of the interview were showed in Table 2. As shown in Table 2 almost all participants performed actual thinking activities. 2. fMRI Results 1) Brain activation patterns of the experimental design To determine the basic pattern of activation for experimental design, we used the‘experimental design versus baseline’contrast to reveal areas showing significantly increased blood oxygenation level dependent (BOLD) signal during conditions in which participants were required to experimental design compared signals during the control baseline condition. The Talairach-space coordinates and their number of Brodmann's area and their significant Z-value(P < 0.05, FWE corrected) are listed in Table 3. The‘experimental design versus baseline’ contrast yielded left-lateralized activations in the left dorsolateral prefrontal areas (the superior, middle, and inferior frontal gyrus, ; BA 6, 9, 45), the left superior parietal lobule (BA 7), the left inferior parietal lobule (BA 40), the right fusiform gyrus (BA 19), the left lingual gyrus (BA 18) and
Brain Activation Pattern and Functional Connectivity Network during Experimental Design on the Biological Phenomena
353
Table 2
Results of in-depth interview after fMRI scanning Participants 1 2 3 4 5 6 7 8 9 10 11 12 13 14 15 16 17 18 19 20 21 22 23 24 25 26
Tasks 1
2
3
4
5
6
7
8
9
Actual thinking (%)
O O O O O O O O O O O O O O O O O × O O O O O O O O
O O O O O O O O O O O O O O O O O O O O O O O O O O
O O O O O O O O O O O O O O O O O O O O O O O O O O
O O O O O O O O O O O O × O O O O O O O O O O O O O
O O O O O O O O O O O O O O O O O O O O O O O × O O
O O O O O O O O O O O O O O O O O O O O O O O O O O
O O O O O O O O O O O O O O O O O O O O O O O O O O
O O O O O O O O O O O O O O O O O O O O O O O O O O
O O O O O O O O O O O O O O O O O O O O O O O O O O
100 100 100 100 100 100 100 100 100 100 100 100 89 100 100 100 100 89 100 100 100 100 100 89 100 100
O: success in actual thinking during fMRI scanning, ×: failure in actual thinking during fMRI scanning
the cerebellum (the left culmen, the right pyramis, the bilateral declive and the right tuber) (Fig. 2 and Table 2). Conducting the scientific experimental design in this study, the brain activation regions that were shown in the participants all appeared in left hemisphere exclude the right declive (Fig. 2, 3). First, the activation of left superior frontal gyrus was revealed in the experimental design (Fig. 2, 3). For this region, its significant connection with the left inferior parietal lobule was revealed in the functional connectivity map (Fig. 3). This region is known to play a role in integrating abstract
information (Green et al., 2006). The dorsolateral frontal cortex (DLFFC; BA 6, 9) is a region that has been implicated previously in the inspection and manipulation of information already maintained in memory (Fletcher & Henson, 2001) and in executive functioning. According to Petrides (1995), the DLPFC is typically involved in cognitive processes concerning monitoring and manipulation of information in working memory. Other authors state the dorsolateral prefrontal cortex is involved in relational integration, which is necessary for reasoning processes that require one to consider multiple relations simultaneously
354
Il-Sun Lee∙Jun-Ki Lee∙Yong-Ju Kwon
Table 3
Brain regions showing significant activations in contrast experimental design versus baseline Brain region Frontal lobe
Parietal lobe Occipital lobe Cerebellum
Region of activation Superior frontal gyrus Middle frontal gyrus Inferior frontal gyrus Superior parietal lobule Inferior parietal lobule Fusiform gyrus Lingual gyrus Culmen Pyramis Declive
Tuber
BA & Side 6 9 6 45 7 40 19 18
L L L L L L R L L R R R L L R
Z score 6.28 6.08 5.50 6.00 4.98 4.89 4.75 4.70 4.89 5.85 5.80 4.89 5.46 4.88 5.59
Talairach coordinates x y z -8 16 56 -51 13 31 -36 14 47 -57 11 20 -24 -64 46 -46 -38 46 30 -68 -7 2 -74 -5 0 -51 -9 24 -67 -27 26 -69 -20 18 -75 -16 -20 -73 -18 -28 -67 -20 30 -60 -29
BA: Brodmann areas, L: left hemisphere, R: right hemisphere
should require not only semantic retrieval but also integrating an abstract information such as abductive process.
2) Brain functional connectivity network of the experimental design
Fig. 2 Brain activation pattern during
experimental design on the biological phenomena (P < 0.05, FWE corrected) (Robin & Holyoak, 1995) and to integrate information from various source (Christoff et al., 2001; Kroger et al., 2002). The activation and connections of these regions mean that experimental design process was not success just a memory retrieval process. To get the complete experimental design knowledge, participants
In order to examine the neural correlation network among the involved regions, we then calculated percent signal changes of the activated regions (time-series of BOLD signals) in experimental design process for each participant and calculated the Pearson's correlation coefficient among all the regions detected from the prior analysis: selected-ROIs. Several previous neuroimaging studies have indicated the possibility of the functional connectivity or associations using correlation analyses among regions (Tsukiura et al., 2001). Significant correlation network in analysis is shown in Fig. 3. In our functional connectivity network model of the experimental design, all of their correlation coefficient between ROI pairs were above r =.5. The network model was consisting of six nodes (ROIs) and its six connections. In experimental
Brain Activation Pattern and Functional Connectivity Network during Experimental Design on the Biological Phenomena
Fig. 3 The significant functional connectivity
networks among selected ROIs for experimental design processes. This study regarded the correlation's P value less than 0.05 (P < 0.05) as the significant correlation. The number on the line means the correlation coefficient. The abbreviations of circles mean the anatomical name of ROIs (MFG: Middle frontal gyrus, SFG: Superior frontal gyrus, IPL: Inferior parietal lobe, LiG: Lingual gyrus, Decl: Declive). design process, the left superior frontal gyrus (SFG) had the significant correlations with the left inferior frontal gyrus (IFG) (r = .40), left lingual gyrus (LiG) (r = .50) and right cerebellum (Declive; Decl) (r = .47). We also found the significant correlations between the left inferior frontal gyrus (IFG) and the left parietal lobule (IPL) (r = .53), between the left lingual gyrus (LiG) and the right cerebellum (Declive; Decl) (r = .55), and between the bilateral cerebellum (Declive; Decl) (r = .47) (Fig. 3). Johnson-Frey (2004) reported that distinction between the roles of frontal (retrieval) and parietal (representation) mechanism in tool-use skills is well-suited for evaluation with functional neuroimaging techniques. To the successful experimental design, participants should have represent many suitable experimental instruments such as microscope, beaker, and alcohol lamp.
355
When they designing the experiment, however, they were represented not only the name and imagery of instruments (experimental tools) but also their using method (too-use skill memory) and procedure from their own experienced situations (Kwon et al., 2003). Fronto-parietal pathway paly an important role in this process. In this study, significant functional connectivities were found between bilateral declive, between left lingual gyrus and right declive, and between left superior frontal gyrus and right declive during the experimental design on the biological phenomena (Fig. 3). The wellknown features of the cerebellum is a region of the brain that plays an important role in the integration of sensory perception, coordination and motor control (Rosenzweig et al., 2005). However, cognitive role of the cerebellum is raised by recent neuroimaging studies (Blackwood et al., 2004; Caveza & Nyberg, 2000). Of the many cognitive functions controlled by the cerebellum, the ability to link a context with the appropriate response represents a cerebellar specificity (Thach, 2007). When this linkage is built the occurrence of the context (represented by a certain input reaching the cerebellum) triggers the appropriate response through the cerebellar areas. Because of the large number of anatomofunctional connections between the cerebellum and the prefrontal cortex (Middleton & Strick, 2001), it can be speculated that these areas interact in planning, the former by permitting acquisition of new efficient competencies and the latter by providing flexible shifting among already acquired and stored solutions (De Bartolo et al., 2009). When participants designing the experiment, they should arrange experimental procedure by time-order from represented memory (tools and their skills). The activation of cerebellum and connectivity between frontal region and cerebellum paly an important role in this process.
356
Il-Sun Lee∙Jun-Ki Lee∙Yong-Ju Kwon
Ⅳ. Conclusion and Implications Experimental design is a kind of complex highorder inferential process (Elliot & Dolan, 1998; Gagne et al., 1997; Kwon et al., 2007; Jeong & Kwon, 2007). Therefore, it is more significant when they cooperate as neural correlates or a network than when they work all separately as a single region. In this study, functional connectivity analysis was conducted to search for the brain network which is related to experimental design. In consequence, this study found that there are six significant functional connectivity pairs in the experimental design process, which is connecting each region. Taken together, the brain network of the experimental design is left-lateralized and independent. These results enable the examination of the scientific experimental design process from the cognitive neuroscience perspective, and may be used as basic materials for developing a teachinglearning program for scientific experimental design such as brain-based science education curriculum. In addition, this network model could be applied on the measuring individual differences or learning-related changes of the students' experimental design ability at the neurological level.
References Ansari, D., & Coch, D. (2006). Bridge over troubled waters: education and cognitive neuroscience. Trends in Cognitive Sciences, 10(4), 146-151. Blackwood, N., Ffyche, D., Simmons, A., Bentall, R., Murray, R., & Howard, R. (2004). The cerebellum and decision making under uncertainty. Cognitive Brain Research, 20, 46-53. Borg, W. R., & Gall, M. D. (1989). Educational research: An introduction, 5th Ed. New York, NY: Longman Inc. Buxton, R. B. (2002). Introduction to functional magnetic resonance imaging: Principles and techniques. Cambridge, UK: Cambridge
University Press. Caveza, R., & Nyberg, L. (2000). Imaging cognition Ⅱ: An empirical review of 275 PET and fMRI studies. Journal of Cognitive Neuroscience, 12(1), 1-47. Christoff, K., Prabhakaran, V., Dorfman, J., Zhao, Z., Kroger, J. K., Holyoak, K. J., & Gabrieli, J. D. (2001). Rostrolateral prefrontal cortex involvement in relational integration during reasoning. Neuroimage, 14, 1136-1149. Davis, A (2004). The credentials of brainbased learning. Journal of Philosophy of Education, 38, 21-25. De Bartolo, P., Mandolesi, L., Federico, F., Foti, F., Cutuli, D., Gelfo, F., Petrosini, L. (2009). Cerebellar involvement in cognitive flexibility. Neurobiology of Learning and Memory, in press. Elliot, R., & Dolan, R. J. (1998). Activation of different anterior cingulate foci in association with hypothesis testing and response selection. Neuroimage, 8, 17-29. Evans, A. C., Collins, D. L., Mills, S. R., Brown, E. D., Kelly, R. L., & Peters, T. M. (1993). 3D Statistical neuroanatomical model from 305 MRI volumes. IEEE Conference Record, Nuclear Science Symposium and Medical Imaging Conference (San Francisco). P 1813-1817. Fletcher, P. C., & Henson, R. N. (2001). Frontal lobes and human memory: insights from functional neuroimaging. Brain, 124, 849-881. Friston, K. J. (1994). Functional and effective connectivity in neuroimaging: a synthesis. Human Brain Mapping, 2, 56 78. Friston, K. J., Frith, C. D., Liddle, P. F., & Frackowiak, R. S. J. (1993). Functional connectivity: the principal component analysis of large (PET) data sets. Journal of Cerebral Blood Flow and Metabolism 13, 5 14. Friston, K. J., Holmes, A. P., & Worsley, K. J. (1999). How many subjects constitute a study? Neuroimage, 10, 1-5. Friston, K. J., Holmes, A. P., Poline, J. B., Grasby, P. J., Williams, S. C., Frackowiak, R. S., & Turner, R. (1995). Analysis of fMRI time-series revisited. Neuroimage, 2, 45-53.
Brain Activation Pattern and Functional Connectivity Network during Experimental Design on the Biological Phenomena
Gagne, E. D., Yekovich, F. R., & Ykovich, C. W. (1997). The cognitive psychology of school learning (2nd Ed). New York: Addison-Wesley Longman, Inc. Geake, J., & Cooper, P. (2003). Cognitive neuroscience: Implications for education? Westminster Studies in Education, 26, 7-20. Green, A. E., Fugelsang, J. A., Kraemer, D. J. M., Shamosh, N. A., & Dunbar, K. N. (2006). Frontopolar cortex mediates abstract integration in analogy. Brain Research,1096,125-137. Hebb, D.O. (1949). The Organization of Behavior: A Neurophysiological Theory. Wiley, New York. Horwitz, B. (2003). The elusive concept of brain connectivity. NeuroImage 19, 466 470. Huettel, S. A., Song, A. W., & McCarthy, G. (2004). Functional magnetic resonance imaging. Sunderland. MA: Sinauer associate, Inc. Jeong, J. S. & Kwon, Y. J. (2007). Prospective Science Teachers' Hypothesis-Testing Methods Generated on the Potato Juice Task. The Korean Journal of Biological Education, 35(2), 320-327. Johnson-Frey, S. H. (2004). The neural bases of complex tool use in humans. Trends in Cognitive Science, 8(2), 71-78. Klahr, D. & Dunbar, K. (1988). Dual space search during scientific reasoning. Cognitive Science, 12, 1-48. Koshino, H., Carpenter, P. A., Minshew, N. J., Cherkassky, V. L., Keller, T. A., & Just, M. A. (2005). Functional connectivity in an fMRI working memory task in high-functioning autism Neuroimage 24, 810-21 Kroger, J. K. Sabb, F. W., Fales, C. L., Bookheimer, S. Y., Cohen, M. S., & Holyoak, K. J. (2002). Recruitment of anterior dorsolateral prefrontal cortex in human reasoning: a parametric study of relational complexity. Cerebral Cortex, 12, 477-485. Kuhn, D., Amsel, E., & O'Loughlin, M. (1988). The development of scientific thinking skills. New York, NY: Academic Press, Inc. Kwon, Y. J., & Lee, J. K. (2007). Patterns of biologists' and high school students' brain
357
activations in the generation of biological hypotheses: An fMRI study. The Korean Journal of Biological Education, 35(4), 601-610. (in Korean). Kwon, Y. J., Jeong, J. S., Lee, J. K., Shin, D. H. & Yang, I. H. (2007). Brain Activities during Invention of Hypothesis-testing Methods about Biological Phenomena - An fMRI Study. The Korean Journal of Biological Education, 35(2), 212-224. Kwon, Y. J., Ko, K. T. & Jeong, J. S. (2003). The structure and generation process of deductive scientific-knowledge in the testing of biological hypotheses. The Korean Journal of Biological Education, 31(3), 236-245. Kwon, Y. J., Lee, J. K., Shin, D. H., & Jeong, J. S. (2009). Changes in brain activation induced by the training of hypothesis generation skills: An fMRI study. Brain and Cognition, 69, 391-397. Kwon, Y., Yang, I., & Chung, W. (2000). An explorative analysis of hypothesis-generation by pre-service science teachers. Journal of Korean Association for Research in Science Education, 20, 29-42. Lawson, A. E. (1995). Science teaching and development of thinking. Belmont, CA: Wadsworth Publishing company. Lee, L., Harrison, L. M., & Mechelli, A. (2003). A report of functional connectivity workshop, Dusseldorf 2002. Neuroimage 19, 457-465. Marrelec, R., Bellec, P., Krainik, A., Duffau, H., Pelegrini-Issac, M., Lehericy, H., Benali, H., & Doyon, J. (2008). Regions, systems, and the brain: Hierarchical measures of functional integration in fMRI. Medical Image Analysis, 12, 484-496. McPherson, G. R. (2001). Teaching & learning the scientific method. The American Biology Teacher, 63(4), 242-245. Middleton, F. A., & Strick, P. L. (2001). Cerebellar projections to the prefrontal cortex of the primate. Journal of Neuroscience, 21, 700 .712. Oldfield, R. C. (1971). The assessment and analysis of handedness: The Edinburgh Inventory. Neuropsychologia, 9, 97-113. Park, S. H., Ko, K. T., Jeong, J. S. & Kwon, Y.
358
Il-Sun Lee∙Jun-Ki Lee∙Yong-Ju Kwon
J. (2005). Types of Hypothesis-Testing Methods Generated in Students' Biology Inquiry. Journal of Korean Association for Research in Science Education, 25(2), 230-238. Passingham, R. E., Stephan, K. E., & K tter, R. (2002). The anatomical basis of functional localization in the cortex. Nature Reviews Neuroscience, 3, 606-616. Petrides, M. (1995). Functional organization of the human frontal cortex for mnemonic processing. Evidence from neuroimaging studies. Annals of the New York Academy of Sciences, 769, 85-96. Posner, M. I., & Rothbart, M. K. (2005). Influencing brain networks: implications for education. Trends in Cognitive Science, 9(3), 99103. Robin, N., & Holyoak, K. J. (1995). Relational complexity and the functions of prefrontal cortex. In Gazzaniga, M. S., Bizzi, E., editors. The cognitive neuroscience (1sted.). Cambridge, MA: MIT Press. p987-997. Rosenzweig, M. R., Breedlove, S. M. & Watson, N. V. (2005). Biological psychology: an introduction to behavioral and cognitive neuroscience, 4thEd, Sinauer associate, Inc. Sporns, O., Chialvo, D. R., Kaiser, M., & Hilgetag, C. C. (2004). Organization, development and function of complex brain networks. Trends in cognitive science, 8(9), 418-425. S zcs, D., & Goswami, U. (2007). Educational
Neuroscience: Defining a new discipline for the study of mental representations. Mind, Brain and Education, 1(3), 114-127. Talairach, J., & Tournoux, P. (1988). CoPlanner stereotaxic atlas of the human brain. New York: Thieme Medical publisher, Inc. Thach, W. T. (2007). On the mechanism of cerebellar contributions to cognition. Cerebellum, 6, 163 .167 Tononi, G., Edelman, G. M., & Sporns, O. (1998). Complexity and coherency: intergrating information in the brain. Trends in Cognitive Sciences, 2(12), 474-484. Tsukiura, T., Fujiib, T., Takahashia, T., Xiaoa, R., Inase, M., Iijima, T., Yamadori, A., & Okuda, J. (2001). Neuroanatomical discrimination between manipulating and maintaining processes involved in verbal working memory; a functional MRI study. Cognitive Brain Research, 11, 13-21. Varela, F.J., Lachaux, J.-P., Rodriguez, E., & Martinerie, J. (2001). The brain web: phase synchronization and large-scale integration. Nature Reviews Neuroscience, 2, 229 239. Worsley, K. J,, & Friston, K. J. (1995). Analysis of fMRI time-series revisited-again. Neuroimage 2, 173-181. Zeki, S., & Shipp, S. (1988). The functional logic of cortical connections. Nature, 335, 311 317.