European J. of Neuroscience 27(2):492-513. ⢠Garagnani, M., Wennekers, T. ... Friedemann Pulvermüller and Dr. Thomas Wennekers, for their invaluable support, help and ...... Maunsell & Newsome, 1987; Young, 2000). Finally, the two areas ...
Understanding language and attention: brain-based model and neurophysiological experiments
Massimiliano Garagnani Wolfson College, Cambridge, UK
This dissertation is submitted for the degree of Doctor of Philosophy, University of Cambridge
Submitted: December 2008
i
Preface
The work described within this thesis was conducted at the Medical Research Council, Cognition and Brain Sciences Unit (MRC-CBSU), Cambridge, UK during the period 2005–2008 under the supervision of Prof. Friedemann Pulvermüller (MRCCBSU) and Dr. Thomas Wennekers, Centre for Theoretical and Computational Neuroscience, University of Plymouth, UK. This dissertation is the result of my own work and includes nothing that is the outcome of work done in collaboration, except where specifically indicated in the text and Acknowledgements. Excerpts from Chapters 2, 3, 4 and 5 have been published or submitted in the following papers: • Garagnani, M., Shtyrov, Y., & Pulvermüller, F. (2009) Effects of attention on what is known and what is not: MEG evidence for discrete memory circuits. Frontiers in Human Neuroscience 3:10. doi: 10.3389/neuro.09.010.2009 • Garagnani, M., Wennekers, T. & Pulvermüller, F. (2008) A neuroanatomicallygrounded Hebbian learning model of attention-language interactions in the human brain. European J. of Neuroscience 27(2):492-513. • Garagnani, M., Wennekers, T. & Pulvermüller, F. (2007) A neuronal model of the language cortex. Neurocomputing, 70(10-12):1914-19. • Wennekers, T., Garagnani, M. & Pulvermüller, F. (2006) Language models based on Hebbian cell assemblies. Journal of Physiology – Paris, 100(1-3):16-30. The material contained in this manuscript has not previously been submitted, in whole or in part, for any other degree, diploma or qualification at another institution. This dissertation does not exceed the limit of length prescribed by the Biology Degree Committee. The copyright of this thesis rests with the author. No quotation from it should be published without his prior written consent and publication of information derived from it should acknowledge the original source.
ii
Acknowledgements First and foremost I would like to express my deepest gratitude to my supervisors, Prof. Friedemann Pulvermüller and Dr. Thomas Wennekers, for their invaluable support, help and guidance throughout this project; without them, this work simply would have not been accomplished. They have been an incredible source of insight, experience and knowledge, always willing to indefatigably discuss ideas, provide constructive criticisms and feedback (on time!), and show appreciation and respect for my work: this aspect, on its own, made the entire (as many people said, “crazy”) enterprise of doing a second PhD worthwhile. At the beginning of this project, Thomas installed on the local Linux cluster a copy of the Felix simulation tool (http://www.pion.ac.uk/~thomas/felix.htm, of which he is the author and inventor). This software was vital to the achievement of this work, as the computational model that I developed builds upon, extends and makes heavy use of the routines available from the Felix library. Secondly, I wish to thank my family, friends and colleagues who helped me, in different ways, during these three years; in particular, my parents, Luciana & Luigi, and my grandmother Milena (or Melina...), for their constant encouragement and support. Finally, I would like to express my deepest gratitude to my partner Sandra for having walked (or, rather, danced) into my life and having filled it with joy. This research was made possible by a full-time PhD studentship generously offered by the UK Medical Research Council, Cognition and Brain Sciences Unit, and supported by the Cambridge European Trust.
Understanding language and attention: brain-based model and neurophysiological experiments Massimiliano Garagnani
Summary This work concerns the investigation of the neuronal mechanisms at the basis of language acquisition and processing, and the complex interactions of language and attention processes in the human brain. In particular, this research was motivated by two sets of existing neurophysiological data which cannot be reconciled on the basis of current psycholinguistic accounts: on the one hand, the N400, a robust index of lexicosemantic processing which emerges at around 400ms after stimulus onset in attention demanding tasks and is larger for senseless materials (meaningless pseudowords) than for matched meaningful stimuli (words); on the other, the more recent results on the Mismatch Negativity (MMN, latency 100-250ms), an early automatic brain response elicited under distraction which is larger to words than to pseudowords. We asked what the mechanisms underlying these differential neurophysiological responses may be, and whether attention and language processes could interact so as to produce the observed brain responses, having opposite magnitude and different latencies. We also asked questions about the functional nature and anatomical characteristics of the cortical representation of linguistic elements. These questions were addressed by combining neurocomputational techniques and neuroimaging (magneto-encephalography, MEG) experimental methods. Firstly, a neurobiologically realistic neural-network model composed of neuron-like elements (graded response units) was implemented, which closely replicates the neuroanatomical and connectivity features of the main areas of the left perisylvian cortex involved in spoken language processing (i.e., the areas controlling speech output – left inferiorprefrontal cortex, including Broca’s area – and the main sensory input – auditory – areas, located in the left superior-temporal lobe, including Wernicke’s area). Secondly, the model was used to simulate early word acquisition processes by means of a Hebbian correlation learning rule (which reflects known synaptic plasticity mechanisms of the neocortex).
iv The network was “taught” to associate pairs of auditory and articulatory activation patterns, simulating activity due to perception and production of the same speech sound: as a result, neuronal word representations distributed over the different cortical areas of the model emerged. Thirdly, the network was stimulated, in its “auditory cortex”, with either one of the words it had learned, or new, unfamiliar pseudoword patterns, while the availability of attentional resources was modulated by changing the level of non-specific, global cortical inhibition. In this way, the model was able to replicate both the MMN and N400 brain responses by means of a single set of neuroscientifically grounded principles, providing the first mechanistic account, at the cortical-circuit level, for these data. Finally, in order to verify the neurophysiological validity of the model, its crucial predictions were tested in a novel MEG experiment investigating how attention processes modulate event-related brain responses to speech stimuli. Neurophysiological responses to the same words and pseudowords were recorded while the same subjects were asked to attend to the spoken input or ignore it. The experimental results confirmed the model’s predictions; in particular, profound variability of magnetic brain responses to pseudowords but relative stability of activation to words as a function of attention emerged. While the results of the simulations demonstrated that distributed cortical representations for words can spontaneously emerge in the cortex as a result of neuroanatomical structure and synaptic plasticity, the experimental results confirm the validity of the model and provide evidence in support of the existence of such memory circuits in the brain. This work is a first step towards a mechanistic account of cognition in which the basic atoms of cognitive processing (e.g., words, objects, faces) are represented in the brain as discrete and distributed action-perception networks that behave as closed, independent systems.
v
Table of Contents CHAPTER 1 – INTRODUCTION ......................................................................................... 1 1.1 BACKGROUND .................................................................................................................. 1 1.2 LANGUAGE, LEARNING, AND WORD-RELATED NEURONAL CIRCUITS .............................. 5 1.3 THE LANGUAGE CORTEX .................................................................................................. 7 1.4 MODELLING LANGUAGE PROCESSING.............................................................................. 9 1.5 ATTENTION .................................................................................................................... 13 1.6 SUMMARY ...................................................................................................................... 17 CHAPTER 2 – A NEURONAL MODEL OF THE LANGUAGE CORTEX .................. 18 2.1 RELATED WORK ............................................................................................................. 18 2.2 NETWORK STRUCTURE AND FUNCTION ......................................................................... 23 2.2.1 Model of cortical neurons ...................................................................................... 24 2.2.2 Modelling Hebbian Synaptic Plasticity .................................................................. 27 2.2.3 System-level Architecture ....................................................................................... 29 2.3 DISCUSSION.................................................................................................................... 33 2.4 SUMMARY AND MAIN CONTRIBUTIONS.......................................................................... 36 CHAPTER 3 – SIMULATING THE EMERGENCE OF DISCRETE AND DISTRIBUTED CELL ASSEMBLIES FOR WORDS ...................................................... 37 3.1 EXPERIMENT SET 1 – INTRODUCTION ............................................................................ 37 3.1.1 Experiment Set 1 – Methods................................................................................... 38 3.1.2 Experiment Set 1 – Results ..................................................................................... 40 3.1.3 Experiment Set 1 – Interim Discussion .................................................................. 46 3.2 EXPERIMENT SET 2 – EMERGENCE OF CAS IN THE REVISED MODEL ............................. 49 3.2.1 Experiment Set 2 – Methods................................................................................... 50 3.2.2 Experiment Set 2 – Results ..................................................................................... 50 3.2.3 Experiment Sets 1 & 2 - Discussion ....................................................................... 57 3.3 SUMMARY AND MAIN CONTRIBUTIONS.......................................................................... 60 CHAPTER 4 – SIMULATING LEXICALITY AND ATTENTION EFFECTS ............. 61 4.1 EXPERIMENT SET 3 – REPLICATING LEXICALITY EFFECTS ............................................ 61 4.1.1 Experiment Set 3 – Methods................................................................................... 61 4.1.2 Experiment Set 3 – Results ..................................................................................... 62 4.1.3 Experiment Set 3 – Interim Discussion .................................................................. 65 4.2 EXPERIMENT SET 4 – MODELLING EFFECTS OF LEXICALITY AND ATTENTION ............. 67
vi 4.2.1 Experiment Set 4 – Methods................................................................................... 67 4.2.2 Experiment Set 4 – Results ..................................................................................... 68 4.3 EXPERIMENT SETS 3 & 4 – DISCUSSION......................................................................... 70 4.3.1 Explaining the Influences of Lexicality and Attention............................................ 72 4.3.2 Fit of model predictions and neurophysiological data........................................... 73 4.3 SUMMARY AND MAIN CONTRIBUTIONS.......................................................................... 74 CHAPTER 5 – NEUROPHYSIOLOGY OF ATTENTION AND LANGUAGE INTERACTIONS: AN MEG STUDY.................................................................................. 76 5.1 INTRODUCTION .............................................................................................................. 76 5.2 MATERIALS AND METHODS ........................................................................................... 77 5.2.1 Subjects................................................................................................................... 77 5.2.2 Design..................................................................................................................... 77 5.2.3 Instructions............................................................................................................. 78 5.2.4 Tests........................................................................................................................ 78 5.2.5 Stimuli preparation and delivery............................................................................ 78 5.2.6 Procedures ............................................................................................................. 80 5.2.7 MEG Recording...................................................................................................... 81 5.2.8 MEG Data Processing ........................................................................................... 81 5.2.9 Statistical Analysis ................................................................................................. 83 5.3 RESULTS ......................................................................................................................... 84 5.3.1 Behavioral .............................................................................................................. 84 5.3.2 MEG results............................................................................................................ 85 5.3 DISCUSSION.................................................................................................................... 91 5.4 SUMMARY AND MAIN CONTRIBUTIONS.......................................................................... 93 CHAPTER 6 – SUMMARY AND CONCLUSIONS .......................................................... 95 APPENDIX A ......................................................................................................................... 99 APPENDIX B ....................................................................................................................... 102 ABBREVIATIONS .............................................................................................................. 107 REFERENCES..................................................................................................................... 108
vii
1
Chapter 1 – Introduction
This Chapter provides the necessary background, reviews some of the relevant literature, and introduces the specific research questions that we addressed and that motivated this work.
1.1 Background Our brains can effortlessly store knowledge about objects, faces, words and facts. The nature of the cortical representation of the basic components of knowledge, however, is still a major issue in cognitive neuroscience (see Patterson, Nestor & Rogers (2007) for a recent review). In psycholinguistics, most existing theoretical and computational approaches explain language processes either as the activation and long-term storage of localist elements (e.g., Dell (1986), Dell, Chang & Griffin (1999), Levelt, Roelofs & Meyer (1999), McClelland & Elman (1986), Norris (1994), Page (2000)) or on the basis of fully distributed activity patterns (Gaskell, Hare, & Marslen-Wilson, 1995; Joanisse & Seidenberg, 1999; McClelland & Rumelhart, 1985; Plaut, McClelland, Seidenberg, & Patterson, 1996; Rogers et al., 2004; Rogers & McClelland, 1994; Seidenberg & McClelland, 1989). Localist approaches typically assume, a priori, the existence of separate nodes for separate items (words), and of pre-established, “hardwired” connections between them. Nodes are usually considered active (“on”) only if their activation overcomes a pre-specified threshold; the feature of anatomically distinct nodes allows different item representations to be active at the same time while avoiding cross-talk. Distributed accounts, on the other hand, do not make such apriori assumptions: in them, the representations of the relevant items emerge as distributed patterns of strengthened connections in a set of nodes (hidden layer). In this approach, the same set of nodes is used to encode different items as different patterns of graded activation; this, however, makes it impossible to maintain different item representations separate when these are simultaneously active. In general,
2 cognitive arguments (e.g., our proven ability to maintain multiple item representations distinct) favour localist, discrete-activation representations, whereas neuroscience arguments weight in favour of distributedness (Elman et al., 1996; Page, 2000; Rolls & Tovee, 1995). These two accounts make different predictions about the functional nature (discrete vs. graded activation, respectively) and cortical characteristics (local vs. distributed networks, respectively) of the knowledge representations in the brain. One way to test these predictions and investigate the presence and functional characteristics of the cortical representations of linguistic items is to apply electro- and magnetoencephalography (EEG/MEG) techniques, and measure how neurophysiological responses differ when the stimuli presented in input consist of either (i) familiar and meaningful elements (e.g., words, coherent text) or (ii) equivalently complex but unfamiliar, meaningless items (e.g., pseudowords, incongruent sentences). A significant body of evidence indicates different patterns of brain activation for these two cases.
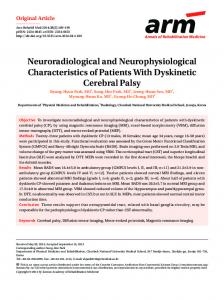
Figure 1.1 Typical N400 response (elicited in presence of attention) to spoken words (dashed curve) and pseudowords (solid). The dotted oval indicates the interval where the differences between the curves are statistically significant. The vertical axis indicates stimulus onset time. Note the large N400 amplitude to pseudowords [adapted from (Friedrich, Eulitz, & Lahiri, 2006), their Fig. 3.(C)]
For example, a well-known and robust neurophysiological index of lexical-semantic processing is the “N400” (see Figure 1.1), a negative-going event-related potential (ERP) peaking around 400ms after stimulus onset (Kutas & Hillyard, 1980). The N400 is larger for senseless materials (e.g., pseudowords, semantically incoherent text) than for matched meaningful language (common words or coherent text), and is
3 elicited under conditions where subjects are attending to the input (Barber & Kutas, 2007; Kutas & Hillyard, 1980). Differences in neurophysiological brain responses to words and pseudowords have been recorded also at short latencies (e.g., Hauk, Davis, Ford, Pulvermüller & Marslen-Wilson (2006), Segalowitz & Zheng (2008), Sereno, Rayner & Posner (1998)), especially in the mismatch negativity (MMN) brain response (Korpilahti, Krause, Holopainen, & Lang, 2001; Pettigrew et al., 2004; Pulvermüller, 2001; Pulvermüller et al., 2001; Pulvermüller & Shtyrov, 2006; Shtyrov & Pulvermüller, 2002). The MMN (Näätänen, Gaillard, & Mäntysalo, 1978) is an early event-related response (latency 100-250ms) elicited in oddball experiments by the infrequent acoustic events (so-called “deviant stimuli”) presented occasionally among frequently repeated sounds (“standard stimuli”). The MMN is elicited even when subjects are heavily distracted, and, unlike the N400, is larger for words than for pseudowords.
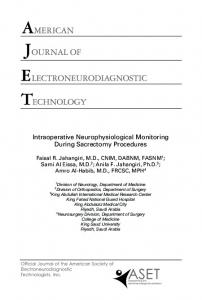
Figure 1.2. Typical Mismatch Negativity (MMN) response to words and pseudowords. Note that the MMN in word context (red curves) is enhanced compared with the MMN in pseudoword context (blue curves). The acoustic waveforms of the stimuli which elicited the MMNs are shown at the top [after (Pulvermüller et al., 2001, their Fig. 2)].
Figure 1.2 shows two examples of MMN, obtained from ERPs of native speakers of Finnish to word and pseudoword stimuli. The MMNs were elicited here by the critical syllables /ki/ (left) and /ko/ (right) when placed in a word context and in a pseudoword context. More precisely, the two syllables were presented after the context syllable /va/ (resulting in “vakki” and “vakko”, two pseudo-words in Finnish) and
4 after the context syllable /la/, thereby completing meaningful Finnish words, “lakki” (CAP) and “lakko” (STRIKE). Although, in principle, they could be used to judge cognitive brain theories of distributed vs. localist representations, neurophysiological results are rarely brought to fruit in this context. The question of why these brain indicators of lexico-semantic processes arise at different latencies and present reversed relative magnitude (N400 larger for pseudowords, MMN larger for words) is left unexplained by current psycholinguistic theories. One possible argument may be that these two divergent patterns of responses are the result of the different processing conditions under which they are elicited. In particular, while the N400 is generally recorded during tasks that require subjects to pay attention to the stimuli (e.g., lexical decision tasks), the MMN is typically elicited in the passive oddball task, in which subjects are instructed to focus their attention on a silent video and ignore the speech stimuli. Thus, the reversal of the response pattern might be caused by the different amounts of attentional resources available to process the linguistic stimuli. A number of studies have confirmed that ERPs and MMN amplitudes are modulated by the attentional load that is required by the task under which they are elicited (Alho, Woods, Algazi, & Näätänen, 1992; Bentin, Kutas, & Hillyard, 1995; Otten, Rugg, & Doyle, 1993; Pulvermüller, 2007; Woldorff, Hillyard, Gallen, Hampson, & Bloom, 1998; Woods, Alho, & Algazi, 1992). Indeed, Szymanski and colleagues (1999), in a study which used spoken phonemes, reported that “top-down controls not only affect the amplitude of the MMN, but can reverse the pattern of MMN amplitudes among different stimuli” (Szymanski, Yund, & Woods, 1999). However, to date, no study has thoroughly investigated the effects of attention on the processing of words and pseudowords while strictly controlling for physical/acoustic stimulus properties. In addition, although existing data suggest that the opposite responses might be caused by the different attentional load, the previous studies have failed to provide an account of the mechanisms that may underlie the differential neurophysiological responses to words and pseudowords: How do the different neural processes interact so as to produce brain responses having opposite magnitude and different latencies?
5 One way to address this question is to implement a neurocomputational model that can reproduce spatial and temporal aspects of brain activity in the relevant cortical areas and provide a mechanistic explanation, at the cortical-circuit level, of the existing neurophysiological findings. The present manuscript describes such a model, how it was applied to explain the observed effects, and the testing of its novel predictions with experimental (MEG) methods. As this work aimed at explaining the mechanisms underlying neurophysiological data at the level of nerve-cell circuits, implementing a biologically realistic model was a crucial aspect of the project; we take the view that structural and functional network properties are critical for the nature of the language representations that the model – and the brain – give rise to. The following sections provide the theoretical background, neuroscientific principles and basic modelling assumptions underlying this work; we also introduce the cognitive constructs of interest, identify the relevant neuroanatomical structures and neural mechanisms, and characterize the high-level mapping between such mechanisms and corresponding entities in the model. Chapter 2 describes in detail the computational model. Chapters 3 and 4 illustrate how we used the model to replicate and explain, at the cortical-circuit level, brain processes of early word learning and the effects of lexicality1 and attentional load on the processing of speech and language. Chapter 5 describes the testing of the model’s crucial predictions by means of a novel critical MEG experiment.
1.2 Language, learning, and word-related neuronal circuits In cognitive terms, the main objects of interest of this study are the building blocks of language, namely, words. We start from the hypothesis that the neural correlate of a word is a memory circuit (“trace”) that develops during early language acquisition (Pulvermüller, 1999). It is well-known that even during the earliest stage of speechlike behaviour, babbling (Fry, 1966; Pulvermüller & Preissl, 1991), near-simultaneous correlated activity is present in different brain parts, especially those areas controlling speech output (left inferior-prefrontal cortex, IF) and those where neurons respond to auditory features of speech (left superior-temporal lobe, ST). The same applies to adults: whenever we utter a word, there is activity in IF cortex controlling the 1
The lexical status of a linguistic item (words are lexical items, pseudowords are not).
6 articulatory gestures along with ST activity, the neural response to the incoming sound. In the adult brain these areas are reciprocally connected (see Section 1.3). We conjecture that through associative Hebbian learning mechanisms (Hebb, 1949) such connections allow the acquisition of sensory-motor associations between co-occurring cortical patterns of activity, in such a way that, for example, listening to speech sounds involving specific articulators leads to the “lighting up” of the corresponding motor representations. A significant body of experimental evidence confirms the presence of speech-motor associations as networks of strongly interconnected neurons distributed between left superior-temporal and inferior-frontal cortex (Fadiga, Craighero, Buccino, & Rizzolatti, 2002; Pulvermüller, 1999; Pulvermüller et al., 2001; Pulvermüller & Shtyrov, 2006; Watkins & Paus, 2004; Watkins, Strafella, & Paus, 2003; S. M. Wilson, Saygin, Sereno, & Iacoboni, 2004; Zatorre, Meyer, Gjedde, & Evans, 1996) and their role in language processing. We will refer to such distributed networks of strongly and reciprocally connected neurons as to cell assemblies (CAs) (Braitenberg, 1978; Hebb, 1949; Palm, 1982; Wennekers, Sommer, & Aertsen, 2003). A CA can be thought of as a highly specialized functional unit that “responds” by becoming fully active only when a specific brain activation pattern – brought about by the sensory (or internal) stimulation – conveys at least a critical amount of activation in its neuronal circuits. Sensory-motor CA could receive their input (e.g., lexical items, words) through the auditory or the motor modalities. We simulated the setting up of such sensory-motor links for lexical items at early stages of language acquisition in a brain-inspired neural network that models neuroanatomical, connectivity, and neurophysiological properties of the language areas in the left hemisphere in close proximity of the sylvian fissure (perisylvian cortex, here referred to as “language cortex” – see Sec. 1.3). To induce CA formation in the model, we repeatedly exposed the network to predetermined pairs of (random and sparse) activation configurations, each activation-pattern pair representing the model equivalent of an auditory-articulatory word form, and allowed the network’s synaptic weights to adapt through Hebbian learning. Crucially, in the attempt to replicate and explain the effects of lexicality and attention on the processing of speech, we used the resulting network to simulate the response of the language cortex to words and pseudowords under variable attentional load. The details of the methods adopted for this part of the study and corresponding results are presented in Chapter 3.
7
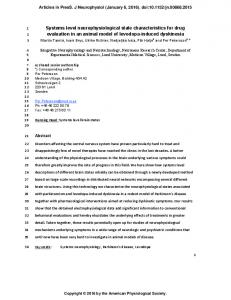
1.3 The language cortex This section specifies the core areas of the cortex involved in language processing that were reproduced in the model, and their connectivity features. Some of the structural features are evident from neuroanatomical investigations of the human brain; however, others, especially the fine grained wiring between and within cortical areas, have been inferred from monkey studies (Pandya & Yeterian, 1985; Rauschecker & Tian, 2000; Romanski et al., 1999) and tractography (Catani, Jones, & Ffytche, 2005). The primary cortices involved in spoken language processing (see Fig. 1.4.(a)) include (i) the primary auditory area (Brodmann’s Area 41), located in the caudal part of the planum supratemporale (the part of the upper convolution of the temporal lobe which lies in the sylvian fissure), and (ii) the ventral part of the primary motor cortex (Brodmann’s Area 4), situated near the sylvian fissure (Pulvermüller, 1992). These two areas are active during perception of speech sounds and execution of articulatory movements, respectively. A third primary cortex involved in spoken language processing is the somatosensory cortex, located posterior to the central sulcus; in particular, this includes the inferior parts of BA (Brodmann’s Areas) 1, 2 and 3, which are necessary for sensations within the mouth region. In both the primary auditory and somatosensory areas, afferent fibres carrying sensory input enter the cortex; the primary motor cortex, on the other hand, contains large pyramidal cells that project to motor neurons controlling articulatory muscles. According to neuroanatomical studies in the rhesus monkey (Macaca mulatta) the primary perisylvian motor or articulatory cortex is tightly connected to the premotor (secondary) regions anterior to it. These, in turn, are connected to regions around the inferior branch of the arcuate sulcus (Pandya & Yeterian, 1985), in the inferior prefrontal cortex. Experimental evidence (Fuster, 1997; Rizzolatti, Fogassi, & Gallese, 2001) suggests that similar connection patterns are likely to be present in the homologous structures in man, located in the ventral motor (BA 4) and premotor (BA 6) cortices, and within BA 44 and BA 45 (Broca’s area). As discussed in detail by Pulvermüller (1992), a similar picture can be drawn for the somatosensory and auditory cortex (see also (Kaas & Hackett, 2000; Rauschecker & Tian, 2000; Scott, Blank, Rosen, & Wise, 2000)). That is, each of the primary cortices
8 relevant for spoken language is strongly and reciprocally connected to its adjacent secondary region, which, in turn, is connected to its neighbouring association area. In the macaca, the relevant auditory areas are sometimes defined as “auditory core” (labelled “A1” in Fig. 1.4.(b)), “belt” and “parabelt” (AL, ML and CL in Fig. 1.3.(b)), respectively (Petkov, Kayser, Augath, & Logothetis, 2006). These structures may be related – although an exact homology is not likely – to BA 41, 42 and 22 in the human brain.
(a)
(b)
Figure 1.4 The relevant areas of the perisylvian cortex in man, and homologous structures in monkey. (a): The different regions of the language cortex in the human brain, indicated by differently shaded areas. Note the long-distance cortico-cortical connections between the auditory and motor association areas, indicated here by black arrows [after (Pulvermüller, 1992)]. (b): Neuroanatomical structure and projections of superior-temporal and perisylvian cortical areas in the monkey brain [after (Romanski et al., 1999)]. See text for details.
9 Studies in non-human (Pandya & Yeterian, 1985; Petrides & Pandya, 2002; Romanski et al., 1999) and human (Catani, Jones, & Ffytche, 2005; Makris et al., 1999; Parker et al., 2005) primates (see Rilling et al., (2008) for a cross-species comparison) suggest that the respective association cortices of each of these primary areas are strongly and reciprocally interconnected with each other via the arcuate and uncinate fascicles, and the extreme capsule. The presence of such long-range cortico-cortical connections between the auditory association (Wernicke’s) and motor association (Broca’s) areas is indicated schematically in Figure 1.4.(a) by (“dorsal” and “ventral”) black arrowpointed arcs. The fact that these long-distance connections – especially through the fasciculus arcuatus – are more developed in the humans than in apes or monkeys, and are stronger in the left than in the right hemisphere, accounts, in part, for the specificity of language to humans, but also for the left-laterality of language in most human brains (Catani, Jones, & Ffytche, 2005; Makris et al., 1999; Parker et al., 2005; Rilling et al., 2008).
1.4 Modelling language processing A plethora of connectionist models of word learning and language processing exists in the literature (e.g., (Dell, 1986; Elman, 1991; Gaskell, Hare, & Marslen-Wilson, 1995; Joanisse & Seidenberg, 1999; McClelland & Elman, 1986; Norris, 1994; Plaut & Gonnerman, 2000; Plaut, McClelland, Seidenberg, & Patterson, 1996; Plunkett & Marchman, 1993; Seidenberg & McClelland, 1989; Sejnowski & Rosenberg, 1987; Shastri & Ajjanagadde, 1993), to name a few representative examples; see (Christiansen & Chater, 1999; Dell, Chang, & Griffin, 1999) for useful accounts). These models have provided an important contribution to the understanding of how, at the system level, different parts of the human brain may play an active role in language processing; they can explain existing experimental data, and allow new predictions to be made and theories to be tested. Apart from a few recent notable exceptions (e.g., (Guenther, Ghosh, & Tourville, 2006; Husain, Tagamets, Fromm, Braun, & Horwitz, 2004; Westermann & Miranda, 2004)), however, most approaches tend
to
“abstract
away”
from
the
neurophysiological
mechanisms
and
neuroanatomical structures that underlie spoken language processing in the brain. In general, they are usually prone to one or more of the following criticisms: they (i) are based on “hard-wired” networks, in which (ii) the weights of the links between the
10 nodes are set up ad hoc, or (iii) make assumptions which are of questionable biological plausibility (e.g., use backpropagation (Rumelhart, Hinton & Williams, 1986) as learning rule, or adopt all-to-all connectivity), or (iv) do not incorporate knowledge about neuroanatomical structure of the perisylvian cortices and their connections, which constrain and form the basis for the emergence of brain circuits underlying linguistic functions. Because of this, they fall short of providing a mechanistic explanation – at the level of nerve cells – of the neurobiological mechanisms at the basis of language acquisition and processing. We addressed the above shortcomings by implementing a connectionist network specifically designed to mimic neuroanatomical, connectivity, and neurophysiological properties of the left perisylvian language cortex, as summarised below (a detailed description is provided in Chapter 2): (i)
Six interconnected cortical areas are modelled, identified on the basis of neuroanatomical studies (see Sec. 1.3): (1) primary auditory cortex, (2) auditory belt and (3) parabelt areas (Wernicke’s area), (4) inferior prefrontal and (5) premotor cortex (Broca’s area), and (6) primary motor cortex;
(ii)
Neurons are modelled as graded-response cells with adaptation, whose output represents average firing rate within a local pool of pyramidal cells;
(iii)
Within- (recurrent) and between-area connectivity is implemented via sparse, random, “patchy” next-neighbour synaptic links between cells, as typically found in the mammalian cortex (Braitenberg & Schüz, 1998; Gilbert & Wiesel, 1983);
(iv)
Both local and global (non-specific) cortical inhibition mechanisms are realised: a. inhibitory
cells
reciprocally
connected
with
neighbouring
excitatory cells simulate the action of a pool of inter-neurons surrounding a cortical pyramidal cell in serving as lateral inhibition and local activity control; b. area-specific inhibitory loops implement a mechanism of selfregulation (see Figure 1.3), preventing the overall network activity
11 from falling into non-physiological states (total saturation or inactivity); (v)
Synaptic plasticity is implemented purely through associative (Hebbian) learning mechanisms.
Although the specific details of the implementation are presented in Chapter 2, it is appropriate to briefly discuss here some of the above points and related assumptions. As we are mainly interested in modelling and explaining the setting up of acousticarticulatory associations between the auditory and motor modality (see Sec. 1.2), areas belonging to the somatosensory speech region (see Fig. 1.4) were not included in the model. The network already contains a “module” for sensory input (modelling the three areas in superior-temporal cortex). Adding a second module entirely analogous in structure and connectivity to the auditory one (see Sec. 1.3) would allow the simulation of additional experimental data, but does not represent a conceptually important extension (but see discussion in Sec. 3.1.3). Another point to note is the use of graded response units instead of spiking neurons. We do not aim at simulating individual cortical neurons but rather employ a lumped or mean-field type model in the simulations, where each node (cell) of the network represents the average activity of a local pool of neurons, or “column” (Eggert & van Hemmen, 2000; H. R. Wilson & Cowan, 1973). This modelling choice is justified by two reasons. First, the level of abstraction required to model and replicate neurophysiological (MEG, EEG) data does not require the modelling of ion channels or single action potentials: analogous approaches based on the neuronal mass model (Freeman, 1978; Nunez, 1974) have been used in the past as generative models of EEG/MEG and fMRI (functional magnetic resonance imaging) signals (David & Friston, 2003; Husain, Tagamets, Fromm, Braun, & Horwitz, 2004). Second, the use of spiking neurons would have a huge impact on the computational load, and would not buy anything in terms of explanatory power of the model. Thus, this level of detail should be introduced only if necessary for the phenomena of interest – as just said, modelling the cortical interactions at the level of cortical columns is sufficient for the present purposes. Approximately 20% of all synapses in the neocortex are estimated to be GABAergic (Douglas & Martin, 2004; Gabbott, Somogyi, Stewart, & Hamori, 1986); thus,
12 the presence of inhibitory mechanisms in the model (see point (iv)) is well motivated. However, while local (lateral) inhibition is generally believed to be an underlying architectural feature of the cortex (Braitenberg & Schüz, 1998; Douglas & Martin, 2004), the evidence in support of the existence of non-specific (global) cortical inhibition is somewhat less direct. It has been argued that the cortex must have developed a self-regulatory mechanism designed to keep activation between certain bounds (Braitenberg, 1978; Braitenberg & Schüz, 1998). Although there is agreement that the regulation of cortical activity is necessary, the exact characteristics of such a mechanism and the brain systems that realise it are still a matter of debate (see (Fuster, 1995; Pulvermüller, 2003, pp. 78-81; Wickens, 1993)). In our model, we implemented cortical self-regulation through the introduction of area-specific inhibitory loops, which dampen activation in one area in proportion to the total activity within that area (see Fig. 1.3 and Sec. 2.2.3 for details). The net result is that the activity within each area is maintained stable and within limits; these bounds are determined by the strength of the inhibitory feedback. In the brain, these circuits could be implemented by cortico-striato-thalamic loops (R. Miller & Wickens, 1991; Wickens, 1993).
Input
Cortical Area
Output A
Θ Figure 1.3 The mechanism of cortical self-regulation implemented in the model. Activity within an area is modulated by the non-specific inhibition (filled arrow) as a linear function Θ of the current total activation “A” in that area [after (Braitenberg, 1978)].
Finally, in relation to point (v), we postulate that the brain mechanisms mediating the development of specialized cell assemblies (driven by the repeated presentation of the same sensory-motor input patterns) are generic Hebbian mechanisms of associative learning, and take the phenomena of long-term potentiation (LTP) and depression (LTD) to be the neural correlates of learning. LTP and LTD consist of long-term
13 increase or decrease in synaptic strength resulting from pairing presynaptic activity with specific levels of postsynaptic membrane potentials (Buonomano & Merzenich, 1998; Malenka & Nicoll, 1999). These phenomena are believed to play a key role in experience-dependent plasticity, memory, and learning (Malenka & Bear, 2004; Rioult-Pedotti, Friedman, & Donoghue, 2000). In the model, we implemented synaptic plasticity by allowing the strength (weight) of the connections between different cells to adapt only according to an LTP/LTD-based rule (see Section 2.2.2 for details).
1.5 Attention Attention is a central theme in cognitive neurosciences (e.g., see (Raz & Buhle, 2006) for a recent review). A complete report on the state of the art of this field falls outside the scope of this work; we briefly describe here only some of the key ideas that have played an important role in the development of this area and that are relevant to this research. No single, unifying definition of attention currently exists in the literature. William James (1890, pp. 403-404) originally wrote: “Everyone knows what attention is. It is the taking possession of the mind, in clear and vivid form, of one out of what seem several simultaneously possible objects or trains of thought”. James distinguished between “active” and “passive” modes of attention, the former being used when attention processes are controlled in a top-down way by the individual’s current goals, thoughts, behaviour, the latter when attention is controlled in a bottom-up way by external stimuli (e.g., a loud noise, movement). This distinction still appears to be important in recent research (e.g., (Corbetta & Shulman, 2002)). The first modern theory of attention was the selective-filter theory proposed by Donald Broadbent (1958): Broadbent postulated a low level filter (nowadays called “early selection”) that allows only a limited number of percepts to reach the cognitive processes at any time, and proposed that much conscious, attention demanding information processing is dependent on a single, common “limited-capacity system”. This theory accounted for a wide range of existing experimental results and
14 phenomena, such as divided attention (difficulties in listening to two simultaneous speech signals), sustained attention (performance decrement over time) and focused attention (increased distractability due to stresses such as noise or sleep loss), minimizing the importance of top-down, consciously directed attention. The idea of a single limited-capacity system, however, turned out later on to be an oversimplification. For example, in dual-task interference, if task x poses more demands than task y on the system, it should always produce more interference with concurrent activities (Kahneman, 1973; Navon & Gopher, 1979). Instead, it seems that the similarity of the tasks is a key factor: interference, or competition, is stronger for tasks which have obvious properties in common (Allport, 1980; Baddeley, 1986) — for example, two verbal tasks, or two tasks which make shared demands on similar (input or output) processing systems (Duncan, 2006). In this work, we take selective attention to be associated with the cognitive ability to internally focus on, or be aware of, only a small subset of the sensory information in input, relevant to current thought or behaviour, at the expense of the rest. The “biased competition” model of attention (Desimone & Duncan, 1995; Duncan, 1980, , 1996; Duncan & Humphreys, 1989) provides a useful perspective on the possible brain mechanisms underlying such cognitive processes. The model is based on distributed, integrated competition across the sensorimotor network (see also (Walley & Weiden, 1973)), and is supported by a significant body of behavioural and neurophysiological evidence (Bundesen, 1990; Chelazzi, Duncan, Miller, & Desimone, 1998; Chelazzi, Miller, Duncan, & Desimone, 1993; Moran & Desimone, 1985; Sato, 1989; Sperling, 1960). As elucidated by Duncan (2006), the model has three basic ideas. First, processing is competitive in many, perhaps most, of the brain systems responding to sensory input. This is shown, for example, by the relative suppression of the normal response to a visual stimulus when a second (possibly irrelevant) stimulus is also present in the receptive field (E. K. Miller, Gochin, & Gross, 1993). Thus, different stimuli compete for shared (attentional) resources. Second, sustained signals from task context act to bias competition, so that the stimulus relevant to the current task or behaviour “wins”. Third, and crucial for object-based attention, competition is integrated between one brain system and another: the tendency is for the same object to assume dominance throughout the network, processing in different regions representing its different
15 properties and implications for action (Duncan, 2006, pp. 5-6). In the remainder of this section we briefly discuss how these three ideas can be mapped to corresponding neurally-plausible mechanisms implemented in the present and other connectionist models. (a) The first type of competition may be mediated, at different cortical levels, by (local) lateral inhibition: mutually inhibitory synapses between neighbouring excitatory cells (a widespread characteristic of the cortex (Braitenberg & Schüz, 1998; Douglas & Martin, 2004)) might act as local winner-take-all (WTA) mechanisms (Yuille & Geiger, 2003), producing the observed competition phenomena. Following a number of other works (e.g., (Fukai & Tanaka, 1997; Knoblauch & Palm, 2002; Mao & Massaquoi, 2007; Rabinovich et al., 2000; Riesenhuber & Poggio, 1999; Rolls & Deco, 2002)), our network implements local competition and WTA dynamics using an underlying area of inhibitory cells with next-neighbour connectivity (see Sec. 2.2.3). (b) The “top-down” signal responsible for biasing the competition amongst the coactive representations may be realised via excitatory links projecting to cells (or cell populations) that represent specific sensory features (spatial location, color, pitch, etc.) or specific items (see, for example, the architecture proposed by Rolls and Deco (2002, p. 328), or (Deco & Rolls, 2005b; Deco, Rolls, & Horwitz, 2004)). The model presented here does not explicitly attempt to implement such top-down attentional signal. Following Occam’s razor, we decided not to make assumptions on its characteristics or origins; as it turns out, this feature was indeed unnecessary for the model to be able to simulate and explain the phenomema of interest here. (c) A number of computational models of visual attention have suggested how the second type of (integrated, or “object level”) competition might occur (e.g., (Bundesen, Habekost, & Kyllingsbaek, 2005; Dehaene, Sergent, & Changeux, 2003; Phaf, Vanderheijden, & Hudson, 1990; Schneider, 1995)). Although the details differ, the general approach, based on the network principle of attractor states (Hopfield, 1982), is to set up mutual support (i.e., reciprocal excitatory links) between units that respond to the same object, and competition (i.e., mutual inhibitory links) between units that do not. In this way, the system spontaneously seeks a state in which different units responding to the same object are active together. However, while synaptic plasticity (LTP/LTD) can explain the emergence of strong reciprocal
16 excitatory links between co-activated (and weakening of links between noncoactivated) sets of units, it is less clear which neurophysiological mechanisms might lead to the strengthening of inhibitory synapses between (not neighbouring) populations of neurons that are not active together. The model presented here implements the integrated, “item level” competition purely as a result of the cortical activity-regulation mechanism (see Fig. 1.3), which is independently motivated by the need for functional stability (Braitenberg, 1978; Fuster, 1995; Wickens, 1993). Past theoretical works (Braitenberg, 1978; Hopfield, 1982; Palm, 1982, , 1987; Willshaw, Buneman, & Longuet-Higgins, 1969) have shown that non-specific inhibition not only enhances the network stability but can also solve the superposition problem (Knoblauch & Palm, 2002), which requires the simultaneous full activation of two different cell assemblies to be prevented. Accordingly, our network does not need to assume (or develop) reciprocal inhibitory links between populations of strongly interconnected cells (CAs) representing different items, as the mutual inhibition between cell assemblies “falls out” of the global inhibition mechanism. In fact, the response of the non-specific inhibition loop to a stimulus in input depends on the strength of the feedback link forming such loop (depicted as a filled arrow in Fig. 1.3, and henceforth called “FI”, feedback inhibition). Therefore, in the model, attention at the object level (or item-level competition) is realised as follows: strong FI (leading to strong mutual inhibition between co-active CAs) simulates – at the cognitive level – a situation in which small amounts of attentional resources are available for processing new sensory input (as low attention implies a tougher competition between co-stimulated representations to enter the focus of attention). Analogously, reduced FI (i.e., less competition between co-active CAs) models greater availability of attentional resources: in the latter situation, several representations can be active at the same time (allowing phenomena like that of “divided attention”, or attention to a large perceptual space). The use of non-specific inhibition to successfully model aspects of attention is not new (Deco, Rolls, & Horwitz, 2004; Rolls & Deco, 2002; Szabo, Almeida, Deco, & Stetter, 2004). However, past approaches used non-specific inhibition as a tool to implement the first type of competition, i.e., lateral inhibition between cells of a specific cortical area, whereas global inhibition is used here to model item-based attention, implementing the second type of competition between cell assemblies that
17 are distributed across different brain areas.
1.6 Summary This Chapter provided the necessary background and introduced the research questions that motivated this work, reviewing some of the relevant literature, describing the neuroscientific principles and the methodological approach adopted, and discussing the basic underlying assumptions (Sections 1.1, 1.2 and 1.4). Section 1.3 identified the neuroanatomical structures and the neurophysiological principles and
observations
motivating
the
functional
features
implemented
in
the
neurocomputational model of the language cortex (see next Chapter), while Sec. 1.5 introduced the basic ideas underlying the biased competition model of attention, mapping them to corresponding entities in the neural network.
18
Chapter 2 – A Neuronal Model of the Language Cortex
This chapter provides a detailed description of the computational model of the left perisylvian cortex that we implemented. The approach follows similar attempts to build models linking neuronal circuits to functional brain systems, especially in the domain of visual (Corchs & Deco, 2002; Deco & Rolls, 2005a; Tagamets & Horwitz, 1998), language (Guenther, Ghosh, & Tourville, 2006; Pulvermüller & Preissl, 1991; Westermann & Miranda, 2004) and auditory processing (Husain, Tagamets, Fromm, Braun, & Horwitz, 2004). The characteristics of the more closely related models and the general features that set apart both these and previous works from the present architecture are discussed in the next section.
2.1 Related work Several examples of distributed connectionist models exist in the literature which, like the present one, demonstrate how cognitive behaviour can emerge from neurobiological structure and function (e.g., (Corchs & Deco, 2002; Deco & Rolls, 2005a; Husain, Tagamets, Fromm, Braun, & Horwitz, 2004; Tagamets & Horwitz, 1998)). These models have been used to explain (and simulate PET/fMRI data resulting from) visual and auditory attention phenomena at the mechanistic level of cortical circuits. However, none of these attempts to address language function. Most relevant here is the ground-breaking work by Husain and colleagues (Husain, Tagamets, Fromm, Braun, & Horwitz, 2004), who built a neuroanatomically-based connectionist model of the left perisylvian areas to simulate electrophysiological and fMRI activities in multiple brain regions during an auditory delayed-match-to-sample task for tonal patterns. Their architecture consists of four major brain regions: (1) primary/core auditory cortex; (2) secondary sensory cortex (belt and parabelt areas); (3) superior temporal gyrus/sulcus (ST); and (4) prefrontal cortex (PFC). Each region
19 is composed of 81 excitatory-inhibitory units (modified Wilson–Cowan units), each of which represents a cortical column; both feedforward and feedback connections link the different regions. A first shortcoming of Husain and colleagues’ model is that, in spite of the large body of experimental evidence showing that the mammalian brain exhibits experience-dependent plasticity (see Sec. 1.4), it is not endowed with any learning mechanism. Secondly, the model assumes the existence of different types of cells exhibiting pre-specified behaviours, and the connections between areas are “hard wired” in an ad hoc manner. For example, the PFC area (Husain, Tagamets, Fromm, Braun, & Horwitz, 2004, their Fig. 1) is assumed to contain four different types of built-in neuronal units: “cue-sensitive” units (assumed to respond when an external stimulus is present), two types of “delay” units (one assumed to be active during stimulus presentation and subsequent delay before presentation of the following stimulus, the other assumed to be only active during the delay between presentations of stimuli), and “response” units, whose activities are assumed to increase when the second stimulus matches the first; these sets of units are assumed to form separate modules, connected by arbitrary links having fixed and predetermined synaptic weight (ibid., their Table A2). (Note that these built-in properties, especially the activememory function, have been argued to be the net-effect of neuronal assemblies, not a feature intrinsic to single cells (Fuster, 2003; Zipser, Kehoe, Littlewort, & Fuster, 1993)). The secondary area is assumed to contain “contour-selective” units for which there is no direct experimental evidence, and there are no excitatory-excitatory (recurrent) within-area connections in the primary, secondary and ST areas. Finally, the architecture includes an “attention” module (which the authors explicitly declare to be “not modelled in a biologically realistic fashion” (Husain, Tagamets, Fromm, Braun, & Horwitz, 2004, p. 1710) that projects to only one of the two delay-modules and directly defines the strength of the representation maintained by such delay units. In summary, Husain and colleagues’ model (i) does not include any learning mechanism, (ii) assumes the existence of different types of cells with conveniently pre-defined, built-in behaviours, and of modules for which there is no neurobiological evidence, (iii) assumes ad hoc connections between such elements, and (iv) does not deal with language, but with simple tonal patterns. In spite of these aspects, this architecture still constitutes the distributed connectionist model of the left perisylvian
20 areas that come closest, in terms of neuroanatomical and neurophysiological detail, to the model that we present here. A connectionist model of speech acquisition and production that does incorporate learning and addresses language function was proposed recently by Guenther, Ghosh, & Tourville (2006). This architecture (composed of several components, including premotor, motor, auditory and somatosensory cortical areas, in addition to a cerebellum module) is used to simulate a range of acoustic and kinematic data (including compensation to lip and jaw perturbations during speech) and fMRI activity during syllable production. The model provides a very effective and insightful account of language processing based on mechanisms that are assumed to simulate neuronal and synaptic level phenomena. To achieve high effectiveness at the functional level whilst maintaining a sufficiently fine-grained level of modelling, however, engineering considerations were prioritised in the implementation at the expenses of neurobiological faithfulness. For example, all projections between the different cortical areas are assumed to be unidirectional (e.g., premotor cortex projects to superior temporal cortex, but no projections exist in the opposite direction) and do not exhibit next-neighbour, random and sparse topology as typically found in the mammalian cortex (Amir, Harel, & Malach, 1993; Douglas & Martin, 2004) but allto-all connectivity, which is not neurobiologically realistic (Braitenberg, 2001; Braitenberg & Schüz, 1998, p. 63). The model also makes use of some simplifying localist assumptions: for example, each single cell in the “Speech Sound Map” module (modelling the left ventral premotor cortex (Guenther, Ghosh, & Tourville, 2006, their Fig. 1)) is assumed to represent one specific speech sound, defined as “a phoneme, syllable, word, or short phrase that is frequently encountered in the native language and therefore has associated with it a stored motor program for its production” (ibid., 2006, p. 283). In the language acquisition simulation described, one cell in premotor cortex was used to represent the entire phrase “good doggie”. Finally, the tuning of the synaptic weights during the simulation of language acquisition (including the preliminary babbling and subsequent “practice phase”, involving the learning of more complex speech sounds) is not realised, like in the present model, via a uniform, constantly-acting mechanism that closely replicates neurophysiological features of synaptic plasticity and is applied equally to all areas during the training, but through a set of different, ad hoc procedures of little
21 biological plausibility that are carried out at different times on different sets of synaptic projections.2 While the models mentioned above were used to simulate PET and fMRI data, the modelling of EEG/MEG signals has been also object of research for several years: e.g., epileptic-like (Jansen & Rit, 1995; Wendling, Bellanger, Bartolomei, & Chauvel, 2000), gamma-(Jefferys, Traub, & Whittington, 1996) and alpha-rhythm dynamics (Suffczynski, Kalitzin, Pfurtscheller, & Lopes da Silva, 2001) and spectral activity in different frequencies (David & Friston, 2003) have been successfully simulated in the past. However, we are not aware, at present, of any biologically realistic model able to simulate and explain the MEG/EEG dynamics observed during higher-level cognitive and language tasks, which was one of the main goals of this work. As mentioned in Sec. 1.4, one of the features shared by most existing connectionist models of language processing which incorporate learning is the use of the backpropagation mechanism (Rumelhart, Hinton, & Williams, 1986). This learning algorithm, although very effective, makes use of information that is not local to the synapse undergoing the efficacy change (i.e., information related to the activity of the two pre- and post-synaptic cells), but which is obtained from the network’s “output” layer by means of comparing current and desired activity there. It is not entirely clear whether (and, if so, how) the brain can actually implement such non-local back2
For example, the synaptic weights of the projections from ventral premotor cortex to
superior temporal cortex (“Auditory Error Map”), encoding the auditory targets for each speech-sound cell, are conveniently ordered in “spatio-temporal” matrices, in which each column represents the target at one point in time, and there is a different column for every 1ms of the duration of the speech sound. Using an audio file containing the appropriate speech sound, a specified procedure sets up the synaptic weights in such a way that the values are (exactly) the upper and lower bounds of each of the first three formant frequencies, at 1ms intervals for the duration of the utterance. This “learning” procedure is run once, during the practice phase only (and not during the babbling). On the other hand, the weight matrix encoding the projections from premotor to somatosensory cortex is updated only during correct self-reproductions of the corresponding speech sound (i.e., strictly after the learning of the auditory target for the sound). Moreover, in order to account for temporal delays, this process involves artificially aligning the somatosensory error “data slice” with the appropriate time slices of the weight matrices (see (Guenther, Ghosh, & Tourville, 2006), their Appendix B).
22 propagation of errors. In this work we relaxed this assumption, and made things more difficult (but more realistic) by limiting ourselves to modelling synaptic plasticity mechanisms that are well established and widely accepted (namely, LTP/LTD); as it will be seen, it is solely by means of these mechanisms that the model correlates of the cortical representations of linguistic items (word cell assemblies) can emerge in the network. A second important aspect setting apart several of the existing models in psycholinguistics (e.g., (Dell, 1986; Dell, Chang, & Griffin, 1999; McClelland & Elman, 1986; Norris, 1994), to name but a few) from the present one concerns the adoption of a localist representation, whereby one node of the network does not represent a pool of cortical neurons, but a phonological feature, a phoneme, or even a whole word. While a localist approach offers several advantages (including reduced computational load and easier implementation), it requires deciding a priori the behaviour of the (simulated) brain representations of the entities of interest (e.g., words, phonemes). To clarify: building a (localist or distributed) connectionist model requires specifying the computational properties of the nodes of the network; if one assumes, for example, that nodes represent words, then specifying their computational properties de facto means establishing, in advance, the behaviour of the (brain representations of) words. We deliberately chose not to follow this approach: our aim was to demonstrate that (and explain how) such linguistic representations (and their macroscopic behaviour) can spontaneously emerge from an initially homogenous, sparsely and randomly connected brain-like network of identical nodes by means of neurobiologically plausible (microscopic) mechanisms. In the visual domain, this approach has led, for example, to the successful modelling of the emergence of ocular dominance and orientation columns in a network with similar connectivity features (Mikkulainen, Bednar, Choe, & Sirosh, 2005). The adoption of this method offers two main advantages: (I) it allows one to look at the properties exhibited by the representations that emerge (as opposed to assuming them as built-in features, as, e.g., Husain and colleagues (2004) did in their work) and use them to make predictions about the properties of their neural correlates; (II) the model can be used to understand the cortical mechanisms that underlie the actual setting up of such representations — in this case, the neural processes underlying early word learning.
23
2.2 Network structure and function A complete characterization of the model requires describing both the fine-grained (or neuronal) and high (or systems) level. For each of these levels, the structure (the subcomponents and how they are integrated) and function (the result of the dynamic interactions of the component parts) will be explained. In the three following subsections, we start from the basic computational unit of our model (the “cell”, representing a local pool of neurons) and move on to the higher levels of area and network (a “system” of cortical areas), alternating structural and functional descriptions as appropriate. The main quality criterion for the model was biological faithfulness. This led to implementing an architecture which was realistic both at systems level (especially the anatomical and connectivity features of the model, linking it to a specific brain part – the perisylvian cortex) and micro-physiological level. Bearing this criterion in mind, it was necessary to find a good compromise between the two conflicting additional goals of developing a model that was sufficiently detailed so as to allow the emergence of the relevant complex processes observed in the human brain, and sufficiently simple so as to be computationally tractable. We achieved the latter by implementing a relatively simple (computationally speaking) “activity regulation” mechanism mimicking a coarse-grained attentional threshold control system (see Section 2.2.3), and by keeping the total number of cells in the network within a manageable range. The overall architecture of the neural network (see Figure 2.1.(b)) replicates the neuroanatomical features and interconnections of the (spoken) language cortex summarized in Section 1.4. In particular, the model reproduces the main sensory input areas (the primary auditory cortex A1 and its surrounding belt and parabelt areas, AB and PB) and the motor output areas (the perisylvian motor cortex, M1, and areas PM and PF). Each of these cortical areas is modelled as a 25-by-25 area of artificial (excitatory and inhibitory) cells (see Section 2.2.3 for details). In addition to the six areas of excitatory-inhibitory cells, the network is endowed with a self-regulation mechanism (not shown in Figure 2.1), necessary to maintain the total activity of the network within certain limits (see also Sec. 1.3).
24
(a)
M1
(b)
PF
PM
PB
AB
A1
(a)
Area 6: Inferior Motor cortex
Area 5: Inferior Premotor cortex
Area 4: Inferior Prefrontal cortex
Area 3: Parabelt
Area 2: Auditory Belt
Area 1: Auditory cortex
Figure 2.1 The relevant areas of the perisylvian cortex, the overall network architecture, and the mapping between the two, indicated by the colour code. (a) The six different areas of the perisylvian language cortex modelled, labelled as M1, PM, PF, A1, AB, PB. Black arrows indicate long-distance cortico-cortical connections between the auditory and motor association areas (see Section 1.3). (b) The six-areas network model and an illustration of the type of distributed functional circuit that developed during learning of perception-action patterns. Each small filled oval represents an excitatory neuronal pool (E-cell); solid and dashed lines indicate, respectively, strong reciprocal and weak (and/or non-reciprocal) connections. Coactivated cells are depicted as black (or grey, indicating smaller activation) ovals. Only forward and backward links between co-activated cells are shown. Inhibitory interneurons are not depicted [after (Garagnani, Wennekers, & Pulvermüller, 2008) ].
2.2.1 Model of cortical neurons The basic computational unit of our model is the “cell”, an element representing a pool of cortical neurons (either pyramidal cells or inhibitory inter-neurons). Each cell
25 or “node” of the network may be considered to represent a cortical column of approximately 0.25mm2 size (Hubel, 1995; Mountcastle, 1997), containing ~2.5⋅104 neurons (Braitenberg & Schüz, 1998, p. 25; Rockel, Hiorns, & Powell, 1980)3. Each cell has a membrane potential V(x,t) (reflecting temporal low-pass properties of local neuron pools, see Equation (2.1) below)) and transforms its potential into firing rate by means of a sigmoid output function (Eq. (2.2)) reflecting local firing activity. The membrane potential V(x,t) at time t of a model cell x with membrane time constant τ is governed by the equation:
τ⋅
dV(x, t) = −V (x, t) +VIn(x, t) dt
(2.1)
where VIn(x,t) is the total input to cell x, representing the sum of all excitatory and inhibitory postsynaptic potentials – EPSPs, IPSPs – acting upon neuron pool x at time t (inhibitory inputs are given a negative sign); these subsynaptic EPSPs and IPSPs drive inward currents in neurons of pool x, producing the charging of their somata. The value O(x,t) produced as output by a cell x is the only signal propagated by x to other cells. The output value O(x,t) of a cell x at time t is a piecewise linear sigmoid function of the cell’s membrane potential V(x,t):
0 O(x,t) =
(V(x,t)− φ) 1
if V(x,t)≤ φ if 0 < (V(x,t)− φ) ≤ 1
(2.2)
otherwise
In other words, the output is clipped into the range [0, 1] and has slope 1 between the lower and upper thresholds φ and φ+1. The value of φ is initialized to 0 but varies in time (see below). The output value of a cell x at time-step t represents the cumulative (graded) output (number of action potentials per time unit) of cluster x at time t; this value predicts action potential frequency in a certain time-window (centred on t), and, thus, changes in the post-synaptic potentials induced by the neuron pool x in all the
3
These figures are meant to provide only an estimate of the grain of the model; as noted in
(Hubel, 1995), the size of a macrocolumn (or “module”) varies substantially between cortical layers (going from 0.1mm2 in layer 4C to 4mm2 in layer 3) and cortical areas (ibid., p.130).
26 synapses downstream from it. We integrate the low-pass dynamics of the network cells (Eq. 2.1) using the Euler scheme with step size ∆t (Press, Teukolski, Vetterling, & Flannery, 1992). The value for ∆t chosen in the simulations was 0.5 (in arbitrary units of time). A relatively wide integration step size was chosen to speed up simulations of the full model, as for the time-continuous (non-spiking) neuron model considered here, smaller step-sizes lead to largely the same network properties. An estimate of the “real” duration of one simulation step (∆t) can be obtained by matching the simulated neurophysiological responses with the corresponding experimental data. According to such approximate mapping (see Sec. 4.3.2 for details), one ∆t is equivalent to about 20ms. Cells come in two different types: excitatory cells (called “E-cells”) and inhibitory cells (or “I-cells”); they model populations of cortical pyramidal neurons and pools of inhibitory interneurons, respectively. The behaviour of an E-cell is specified entirely by Equations (2.1-2.2). I-cells behave identically, except that their output O(x,t) does not saturate at high values (i.e., it is simply V(x,t) for V(x,t)≥0, and 0 elsewhere). In addition, the value used for the time constant τ in Eq. (2.2) is 2.5 for E-cells and 5 for I-cells (in simulation time-steps, or ∆t’s). The use of these two different values is motivated by the higher time constants of IPSPs as compared with EPSPs (Kandel, Schwartz, & Jessell, 2000, p. 923). Assuming that ∆t ≈20ms, E- and I-cells have time constants of about 50ms and 100ms, respectively. Notice, however, that these values should not be interpreted as model correlates of IPSPs and EPSPs time constants, as each cell here represents a population of neurons. Cells can be connected by links (“synapses”). Each synapse is associated to a numeric value (weight) representing the efficacy of that connection. If cell x is linked to cell y with weight wx,y, it contributes a potential O(x,t) · wx,y to the total input VIn(y,t) of the target cell y, where O(x,t) is defined by Eq. (2.2). Without loss of generality, we limit the numeric values of the weights to the range [0, 1]. Finally, E-cells are also endowed with a simple mechanism of adaptation. When a real neuron receives above-threshold stimulation and starts firing, it produces a few spikes at high frequency; if the stimulus is maintained, the rate gradually gets lower and then levels off: this phenomenon is normally referred to as neural (or “spikerate”) adaptation (Dayan & Abbott, 2001, p. 165; Kandel, Schwartz, & Jessell, 2000,
27 p. 424). In the model, adaptation is realised (in E-cells only) by allowing the value of parameter φ in Eq. (2.2) to vary in time. In particular, φ is tied to the time-average of the cell’s recent output,4 so that higher- (lower)-than-average values of O(x,t) lead to a gradual increase (decrease) in φ. This has the effect of adapting the cell’s response to the input level.
2.2.2 Modelling Hebbian Synaptic Plasticity The weights of the links between E-cells are not fixed but are allowed to change in time, modelling the neurobiological phenomena of long-term potentiation (LTP) and depression (LTD) (Buonomano & Merzenich, 1998; Malenka & Nicoll, 1999). We tried two different computational abstractions of LTP and LTD: one based on Sejnowski’s covariance rule (Sejnowski, 1977), a well-known Hebbian learning rule, the other one based on the ABS model of LTP and LTD (Artola & Singer, 1993). The adoption of Sejnowski’s co-variance rule (Sejnowski, 1977) was motivated by the following considerations: (i) as a Hebbian rule, it is neurobiologically based (e.g., see (Crepel & Jaillard, 1991; Stanton & Sejnowski, 1989; Tsumoto, 1992); but cf. Miller (1996) for a discussion); (ii) it is one of the most simple and computationally tractable correlation-based rules, and (iii) it has been successfully used by a number of connectionist models (e.g. (Peter Dayan & Sejnowski, 1993; Linsker, 1988; Penke & Westermann, 2006; Westermann & Miranda, 2004)). In this rule, the change of synaptic weight ωij of the excitatory link from pre-synaptic cell i to post-synaptic cell j per unit time is defined as:
∆ωij = α ( xi − 〈 xi 〉)(x j − 〈 x j 〉)
(2.3)
where α∈]0,1] is a constant ρ (2.5) otherwise
where ρ∈ℵ+, σ∈ℜ+, k∈[0,1], and, if cells A and B have lattice (or area) co-ordinates
31 (xA,yA), (xB,yB), respectively, then sq(A,B) and d(A,B) are defined as sq(A,B) = max (|xA−xB|, |yA−yB|) d(A,B)=((xA−xB)2 +(yA−yB)2 )1/2
(2.6) (2.7)
In short: if B is located outside a square of (2ρ+1)2 cells centred on A, the probability of a “synapse” being created between A and B is null; otherwise, the probability is a Gaussian function (with variance σ2 and amplitude k) of the (“cortical”) Euclidean distance between cells A and B (we used k=0.15, ρ=7 and σ=4.5).7 Thus, E-cells that are more than ρ lattice units (cells) apart cannot be (directly) connected. If one cell is assumed to represent a cortical column of size ~ 0.5x0.5 mm2, the radius of withinarea lateral projections is 0.5⋅ρ ≈ 3.5mm. Finally, if an excitatory link between two Ecells is created, its weight is initialised to a real number chosen randomly between 0 and wup, with wup = 0.1.
Figure 2.2 Connectivity and structure of a single “cortical” area. Each model area comprises two overlaying bi-dimensional layers of 25-by-25 excitatory (E) and inhibitory (I) cells each. Each E-cell (depicted as a filled black circle) projects (in a sparse, “patchy” manner) to neighbouring E-cells in the same area (REC, cell 1) but also to E-cells in the previous (FB) and next (FF) areas via feedback (cell 2) and forward (cell 3) connections, respectively. The small brighter squares on the black background represent an example of where such patchy links might be established, brighter levels of gray indicating stronger link weights. Inhibitory cells (e.g., I-cell 4, depicted as a dashed circle) receive input from (all) E-cells located within an overlaying 5×5 neighbourhood (INH) and inhibit the E-cell located at the centre of it 7(i.e.,
I-cell 4 inhibits E-cell 5). Area-specific inhibition feedback loops are not depicted. Equation (2.5) implies that the probability of having any E-cell linked to itself is exactly k.
32 Excitatory “forward” and “backward” links, connecting any E-cell A with coordinates (xA,yA) in area a1 to other E-cells of an adjacent area, a2, are realised in the same way: randomly weighted links may only be established between A and a square of (2ρ+1)2 cells centred on cell (xA,yA) in area a2, where the probability of creating a link between any two cells is defined by Equation (2.5). For forward and backward connections, the parameters that we used are k=0.28, ρ=9 and σ=6.5. Hence, withinarea projections are smaller and less dense, on average, than between-area ones (see Fig. 2.2). Whilst the exact values of these parameters were calibrated through simulation studies, the type of excitatory connections realised in the network is biologically motivated and aims at reproducing the next-neighbour, patchy and sparse connectivity typically found in the mammalian cortex (Amir, Harel, & Malach, 1993; Braitenberg & Schüz, 1998; Douglas & Martin, 2004; Gilbert & Wiesel, 1983).8 The reciprocal connections between a layer of E-cells and its underlying lattice of inhibitory I-cells are similar but somewhat simpler than those described above. First of all, each I-cell (pool of inter-neurons) receives excitatory inputs from all E-cells situated within an overlying 5x5 neighbourhood (i.e., within a radius ρ=2, equivalent to ~1mm) and projects back (with weight =1) to the single E-cell located directly above it. The smaller radius ρ reflects the fact that inhibitory inter-neurons (basket or chandelier cells) present smaller and more verticalised dendritic arborizations than pyramidal cells do (Jin, Mathers, Szabo, Katarova, & Agmon, 2001; Somogyi, Cowey, Halasz, & Freund, 1981). Moreover, the weight of the lateral connections from E-cells to I-cells is not assigned randomly, but decreases with the distance according to the Gaussian function defined in Eq. (2.5) (with σ=2.0, k=0.295). This negative feedback circuits function both as local activation control and lateral inhibition mechanism, simulating the action of a pool of inhibitory interneurons surrounding a pyramidal cell in the cortex (Braitenberg & Schüz, 1998). As discussed in Sec. 1.3, in order to prevent overactivation or bursting, the network
8
In addition to using a sparsely connected network, the stimuli representing acoustic or motor
cortical activity were also activating the network in a random and sparse way (see Sec. 3.2.1 for details). Some experimental evidence suggests that the neural code adopted by the brain to represent complex stimuli may indeed be distributed and sparse (e.g., (Olshausen & Field, 1996; Rolls & Tovee, 1995); cf. (Reddy & Kanwisher, 2006) for a discussion).
33 had to implement a self-regulatory mechanism. This mechanism was realised by introducing area-specific feedback-inhibition (FI) loops that control the total activity within each area (see Fig. 2.3). More precisely, all E-cells of each area project (with weight =1) to a single, area-specific I-cell (not part of the underlying layer of local Icells), henceforth called FI-cell. Each FI-cell, in turn, projects back to all the E-cells of that area, providing an amount of inhibition proportional to the total activity within that area. This guarantees that the total network activation is maintained within “physiological” bounds. Note that, as explained in Sec. 1.5, the strength of these FI loops (depicted as striped arrows in Fig. 2.3) was manipulated during the experiments described in Chapter 4 in order to simulate the presence of different amounts of attentional resources during language processing. A1
AB
PB
PF
PM
M1
Figure 2.3. Implementation of the self-regulatory cortical mechanism in the network architecture. Each feedback-inhibition (FI) cell, depicted in grey, receives input from and projects to all E-cells of one area. See text for details.
A complete formulation of the computational features of the model, summarizing and complementing the description given in this chapter, is reported in Appendix A.
2.3 Discussion The neural network model implemented aims at mimicking the basic properties of the human perisylvian language cortex during word learning. The basic anatomical properties that were translated into network structure were the following:
34 I. The parcellation of perisylvian cortex into M1, PM, PF, and A1, AB and PB, which is known from work in animals and humans; II. The next neighbour and long-distance connections linking these areas directly, which is based on work in animals and humans; III. General principles of cortical connectivity, especially sparseness and patchiness, topography of projections of long-distance connections and next-neighbour preference of local links; IV. Embedding of excitatory cortical neurons into a network of local inhibitory cells; V. Embedding of excitatory cortical neurons into area-specific inhibitory feedback loops designed to regulate local activation levels. Although the connections that were realised are well motivated by neuroanatomical studies in both humans and monkeys (see Pulvermüller (1992) for a discussion), we only reproduced the predominating next-neighbour connections and long-distance, cortico-cortical links that are known to exist in this part of the brain, and did not include fine-grained details such as connections between non-adjacent cortical areas (for example, linking A1 to the auditory parabelt). There are several reasons for these choices. First, neuroanatomical data indicate that each cortical neuron may receive links from fewer than 3% of neurons underlying the surrounding square millimetre of cortex (Stevens, 1989), and that the probability for a connection between two cortical neurons decreases with their distance (Braitenberg & Schüz, 1998). Second, there is little evidence for some of these “jumping” connections: for example, pronounced direct connections between primary auditory and motor cortex do not seem to exist. Third, adding connections that link non adjacent areas (e.g., from area A1 to PB, or from AB to PM, as some evidence would suggest (Catani, Jones, & Ffytche, 2005)) would reduce the minimum number of areas that separate area A1 from M1, making the binding of sensory-motor pattern pairs even easier and effectively resulting in a simplified version of the same model (cf. also Sec. 3.1.3). As noted in Sec. 1.3, the network is primarily designed as a model of the left language dominant perisylvian cortex, as the direct links between superior temporal and inferior frontal cortex appear much more developed there than in the nondominant right hemisphere (Parker et al., 2005; Rilling et al., 2008). The present
35 number of six areas seems to constitute a minimum for approximating the relevant cortical structures, and, at the same time, a sufficient level of complexity for replicating and explaining, at cortical-circuit level, the rich dynamics and temporal aspects of the neurophysiological brain responses of interest (recall that the neuralnetwork model of the left perisylvian areas proposed by Husain and colleagues (2004) contained four areas, while the connectionist model of early language acquisition described by Westermann & Miranda (2004) simulated only two cortical areas, and assumed all-to-all connectivity between their constituent cells). We conclude this discussion by clarifying the main aspects which distinguish the ABS learning rule (implemented here) from the well-known, classical BCM rule. First of all, in the BCM rule the LTP/LTD threshold – corresponding to parameter θ+ in Eq. (2.4) – is not, like here, a predefined, fixed value, but a sliding threshold that changes according to the running average of the postsynaptic cell’s activity.9 As pointed out by Miller (1996), although evidence suggesting that the LTP/LTD threshold may be affected by the activity of the cell does exist (Bear, 1995; Kirkwood, Rioult, & Bear, 1996), it has been established that this effect is input (i.e. synapse) specific, and that it depends on the pattern of pre-synaptic rather than postsynaptic activity (Abraham & Bear, 1996). Thus, the assumption of a single, postsynaptic-driven LTP/LTD threshold that applies to all the synapses of a cell is not entirely justified.10 Second, in the BCM rule LTD occurs even with very small postsynaptic potentials, whereas experimental evidence suggests that if postsynaptic depolarization remains below a
9
More precisely, for the BCM rule to exhibit stable learning behaviour, the threshold must be
a more-than-linear function of the cell’s average output rate (a power of 2 is usually adopted). 10
Although evidence in support of the existence of homeostatic plasticity mechanisms exists
(see (Turrigiano & Nelson, 2004) for a review), phenomena such as that of synaptic scaling — showing that prolonged changes in the cell’s activity lead to the multiplicative scaling of all the amplitudes of the miniature excitatory postsynaptic currents (Turrigiano, Leslie, Desai, Rutherford, & Nelson, 1998) — do not constitute direct evidence for the presence of a single sliding LTP/LTD cell-threshold. Equally, synaptic scaling does not justify assuming that the norm of the vector of the synaptic strengths is conserved and equal for all cells, as often presupposed by neurobiologically inspired implementations of Hebbian learning (e.g. (Krichmar, Seth, Nitz, Fleischer, & Edelman, 2005)).
36 certain threshold, the synaptic efficacy should remain unchanged, regardless of any presynaptic activity (Artola, Bröcher, & Singer, 1990). This aspect was implemented in the ABS rule using the second (fixed) threshold, parameter θ− in Eq. (2.4). Finally, unlike the ABS rule, the BCM rule is unable to model heterosynaptic LTD (the weakening of synaptic inputs that are themselves inactive), as it requires at least some presynaptic activity to be present at a synapse for LTD to take place. This form of LTD has been observed in the hippocampus and neocortex (Hirsch, Barrionuevo, & Crepel, 1992); the induction protocols require strong postsynaptic activation (e.g., high frequency stimulation of the cell through excitatory inputs), which is accurately reflected in the third line of Eq. (2.4) by the condition requiring V(y,t) ≥ θ+.
2.4 Summary and main contributions This chapter described the neurocomputational model of the human perisylvian language that was implemented. The original contribution lies in the level of accuracy that the network model incorporates in terms of neuroanatomical structure, connectivity and neurobiological features: (1) six interconnected cortical areas were modelled, identified on the basis of neuroanatomical studies; (2) cell activity was modelled at the level of single cortical columns; (3) within- and between-area synaptic connections were not “all-to-all” but sparse, random, patchy and nextneighbour, as typically found in the mammalian cortex; (4) both local (lateral) and global (area-specific) cortical inhibition mechanisms were implemented; (5) learning was modelled solely as synaptic plasticity (LTD/LTP) mechanisms that are known to take place in the neocortex. As discussed in Sec. 2.1 and 2.3 (and earlier, in Sec. 1.4), there is, at present, no other computational model of language processing specified at the level of cortical columns that implements all of the above features. Neurobiological faithfulness was necessary for (i) modelling and explaining existing neurophysiological data on lexical processes at the cortical-circuit level, and (ii) making precise predictions on the spatio-temporal patterns of brain activation during language processing, which could be tested experimentally using MEG techniques. The accomplishment of these goals is described in Chapters 4 and 5, respectively.
37
Chapter 3 – Simulating the emergence of discrete and distributed cell assemblies for words
In this Chapter we describe two sets of experiments carried out using the neuralnetwork model of the left-perisylvian language cortex described in Chapter 2. The main focus here was on simulating and explaining, at the cortical-circuit level, the processes that may take place in the cortex during early word acquisition.
3.1 Experiment Set 1 – Introduction Even during the earliest stage of speech-like behaviour, near-simultaneous correlated activity is present in different brain parts (see Sect. 1.2 and Sec. 1.4). Word production (controlled in inferior-frontal and prefrontal areas) leads to acoustic signals that cause stimulation of superior-temporal auditory areas. Since inferiorfrontal (IF) and superior-temporal (ST) areas are connected reciprocally, and neurons that “fire together wire together” (Hebb, 1949), speech-related co-activation of neurons in these areas should lead to the formation of word cell assemblies (CAs) distributed over IF and ST cortex (Braitenberg, 1978; Pulvermüller, 1999). In order to test the mechanistic validity of this theory, we used the model described in Chapter 2 to carry out proof-of-concept simulations aimed at demonstrating the spontaneous emergence of such perception-action circuits in a neurobiologically realistic model of the language cortex. Word learning was simulated in the model as repeated simultaneous activation of predetermined sets of cells in Area 1 (the primary auditory cortex – see Fig. 3.1) and Area 6 (primary motor cortex, M1). The presence of an activity pattern in Area 6 can be thought to represent the spontaneous motor-cortical activity that one might observe in M1 during the babbling phase (Fry, 1966). The pattern presented as input to Area 1
38 simulated the cortical activation that would result in A1 from the near-simultaneous perception of the speech sounds generated by the articulatory movements driven by the activity in M1. The main prediction here was that well-defined, strongly connected CAs would develop for the sensory-motor pairs, associating auditory and articulatory activation patterns and representing the network equivalents of brain circuits for words (Pulvermüller, 2003). The theory predicted that these CAs should be (a) distributed across cortical areas; (b) word-specific, and (c) activated even by partial (e.g., only auditory) stimulation. Due to their strong internal and reciprocal connections, CAs were also expected to exhibit “memory” and “pattern completion” features (see also (Wennekers & Palm, 2007)), i.e., reverberation of excitation within the circuit in absence of any input following stimulation, and full activation after only partial stimulation.
3.1.1 Experiment Set 1 – Methods The network was confronted with four stimulation patterns, each pattern representing auditory and articulatory components of a word form: two predetermined, randomly generated sets of cells were activated at the same time in the primary auditory (A1) and motor (M1) areas (see Fig. 3.1), simulating speech production and correlated perception of the same speech element. A1
AB
PB
PF
PM
M1
Area 1 Area 2 Area 3 Area 4 Area 5 Area 6 Figure 3.1. Schematic illustration of network simulation of early word acquisition processes: predefined stimulus patterns were presented simultaneously to areas A1 and M1, resulting in a temporary wave of activation that spread across the network. Black (gray) cells indicate strongly (weakly) activated cells. Synaptic links between cells are not depicted to avoid clutter. See text for details.
The number of cells (seventeen) activated in each primary area equalled 2.72% of the
39 total number of cells of one area. The training consisted of the cyclic presentation of the four different pairs of patterns; during each cycle, one stimulus pair was presented continuously to the network for 2 simulation time-steps, followed by a period of 50 steps during which no input was given and activity was driven by white noise. A different stimulus pair, chosen randomly among the other three, would then follow, until each of the four stimuli had been presented to the network for thirty five hundred times (adding up to 14·103 stimulus presentations in total). Throughout the training (including the period in which no input patterns were present) the weights of all the links between E-cells were left free to adapt according to Sejnowski’s covariance rule (see Sec. 2.2.2), which leads to the strengthening of the links between co-activated cells and the weakening of links between cells that present uncorrelated activation. After the training, the network was tested with a view to reveal the presence and properties of cell assemblies, which were expected to emerge for the given auditorymotor pattern pairs. More precisely, for each of the four patterns presented in input, the time-average of the response (output value, or “firing rate”) of each E-cell in the network was computed and stored.11 These averages were used to identify the CAs that developed in the network in response to the four input pairs, as follows: a CA was defined simply as the subset of E-cells exhibiting average output above a given threshold γ∈[0,1] during stimulus presentation.12 Using the above functional definition, we then measured, for different values of γ, (i) CA size (averaged across the CAs that emerged in the network as a result of learning) and (ii) distinctiveness of a CA, quantified as the average overlap (number of cells that two CAs shared) between one randomly chosen CA and the other three (this is also a measure of the amount of cross-talk between pairs of CAs). We repeated the above process and collected these measures for ten different networks, each randomly initialized and trained with a different set of stimulus pairs.
11
The time-averages of the output values were computed during the training, recording the
cell responses as the four patterns were presented to the network for learning. 12
E.g., if γ = 0.75, all cells presenting output above 75% of the output of the maximally active
cell in their area during stimulus presentation were considered to belong to the active CA.
40 3.1.2 Experiment Set 1 – Results As the training progressed, we observed the emergence of distributed cell assemblies, different assemblies responding selectively to a different input pattern. This phenomenon becomes apparent by examining the time-averaged response that each input pattern induced in the network at the different stages of the learning process.
10
A1
AB
PB
PF
PM
M1
W1
W1
W2
W2
W3
W3
W4
W4
50 W1
Figure 3.2.(a). W1
Average
response of one W2
W3
W2
network to the 4 input patterns
W3
(W1,..W4) at different
W4
W4
learning: after
100 W1
stages of
W1
10 (top), 50 (middle) and
W2
W2
100 (bottom) stimulus presentations
W3
W3
(see also Fig. 3.2.(b)
W4
W4
on next page).
41 Figure 3.2 (panels (a) and (b) are shown on two separate pages) contains the timeaveraged response of one (randomly chosen) network to the four input patterns pairs (one for each row), at different points during the training (after 10, 50, 100 stimulus presentations in Fig. 3.4.(a), and after 1000, 2000, 3500 in Fig. 3.4.(b)). 1000
A1
AB
PB
PF
PM
M1
W1
W1
W2
W2
W3
W4
W3
W4
2000 W1
W1
W2
W2
W3
W3
W4
W4
3500 W1
W1
W2
W2
W3
W3
W4
W4
Figure 3.2.(b). Average response of one network to the 4 input patterns after 1000 (top), 2000 (middle) and 3500 (bottom) stimulus presentations. See text for details.
42 In the figure, the different output value (firing rate) of each cell within an area is coded using different brightness levels: very bright or white squares indicate cells with average output ∼1.0, dark or black areas indicate silent cells (output ∼0.0). Initially, the presentation of the input pattern pairs produces only weak activation in the two secondary areas AB and PM, and no activation in the central (or associative) areas PB and PF. As the learning progresses, however, the average response produced by the same stimulus reaches further towards the central areas (Fig. 3.2.(a)), where the binding of the sensory-motor patterns is expected to take place. Note that the average responses after 2000 and 3500 stimulus presentations (Fig. 3.2.(b)) are essentially identical, suggesting that the four CAs have reached a stable size and their boundaries have not changed during the past six thousand alternated stimuli presentations. The time-averaged response of the other trained networks was qualitatively equivalent. To see that the binding of the four auditory and articulatory pattern pairs induced by the learning process has taken place, consider Figures 3.3 and 3.4. In them, the rows represent “snapshots” of a network activity taken at successive time points following brief (2-step) stimulation pulse to Area 1 with the auditory part (left pattern only) of a stimulus pair. Time t is in simulation steps. The network of Fig. 3.3 was untrained (i.e., the stimulus presented to A1, shown in the leftmost column, had never been “heard” before by the network). Figure 3.4 shows the response of the network to a learnt auditory pattern after the training had been completed. In absence of training, activity propagates in a rather cloudy and unfocussed manner, reaching only the first and second areas, and is then dispersed (Fig. 3.3). One point to notice is that the wave of activation spreading appears to be “pushed” to the right. This is due to the presence of the FI mechanism (see Sec. 2.2.3): the area-specific inhibition loop takes effect as soon as the activation within one area increases, and remains active for a few steps; this prevents activation to immediately “re-enter” an area which has just been active. The response of a trained network to a known, familiar auditory pattern differs significantly (see Fig. 3.4). First of all, the activity is now much more focussed: only very specific sets of cells are strongly activated. At time t=2 the active cells in Area A1 already produce activation in a specific subset of cells in area AB. The activity of these cells is significantly higher than that of cells activated in the surround by the non-specific wave (compare their brightness with that of the active cells in AB in Fig. 3.3). This indicates that their input must come directly from the strongly active cells
43 in A1. Hence, these cells will respond strongly whenever this specific input pattern is present. Furthermore, the activation does not stop at the first few areas, but progresses through the entire network until it reaches area M1. This indicates the existence of strong (possibly reciprocal) links between cells distributed across the six areas, which developed as a result of learning. Crucially, the cells activated in M1 reconstruct part of the motor pattern (shown in the figure for illustrative purposes only) that had been presented to that area in association with this specific “word”. Thus, the observed behaviour suggests the presence of a distributed, stimulus-specific CA in the network associating the two sensory-motor patterns. Input to A1
A1
AB
PB
PF
PM
M1
t=0
t=1
t=2
t=4
t=6
t=8
t=10
Figure 3.3. Network response to stimulation of A1 (auditory cortex) with an activation pattern before training. Each row in the figure is a snapshot (taken at time-steps t=0, 1, 2, ..., 10) of the output activity of the six model areas (columns). The input pattern briefly presented to Area 1 is shown on the left.
44 Input to A1
A1
AB
PB
PF
PM
M1
t=0
t=1
t=2
t=4
t=6
t=8
Figure 3.4. Network response to A1 stimulation with an auditory activation pattern (on the left) after training. The motor pattern that had been paired with the auditory input is shown on the right for illustrative purposes. Refer also to Fig. 3.2 [after (Garagnani, Wennekers, & Pulvermüller, 2007)]
Figures 3.5 and 3.6 below plot cell assembly size and specificity, respectively (averaged across ten trained networks) as a function of the minimal-activation threshold γ, the parameter used for identifying the CAs and their boundaries (see Sec. 3.1.1). Fig. 3.5 indicates that, on average, distributed, stimulus-specific CAs reliably emerged in all the network simulations. However, their size decreased approximately as a linear function of the minimal-activation threshold γ. This suggests the absence of a “critical” level of activation above which only a well-identifiable set of cells is reliably activated. Instead, the boundaries of the CAs appear to be somewhat “fuzzy” and not so well defined, and to overlap significantly with those of other CAs. The average overlap (or cross-talk) between pairs of CAs is reported in Figure 3.6, which shows the % of shared cells between a randomly chosen CA and (i) the other three CAs (we plot the mean of the three overlaps) and (ii) the CA maximally overlapping with the chosen one, averaged across the ten networks.
45
Average cell-assembly size number of component cells
120 100 80 60 40 20 0 0
0.2 0.4 0.6 0.8 minimal-activation threshold γ
1
Figure 3.5. Average cell-assembly size. The average (SEM) number of cells within the entire network that were activated above threshold γ by a specific input stimulus (auditory and articulatory word forms) is plotted as a function of the threshold γ. Vertical bars give standard errors of the mean (SEM).
Overlap between pairs of cell assemblies average overlap
maximum overlap
% shared cells
35 25 15 5 -5 0
0.2
0.4
0.6
0.8
1
minimal-activation threshold γ Figure 3.6. Cell-assembly distinctiveness: average (SEM) overlap between pairs of CAs as a function of the minimal-activation threshold γ (see text for details).
46 3.1.3 Experiment Set 1 – Interim Discussion We applied the model of the left-perisylvian language cortex to simulate brain processes of early language learning. The sensory-motor patterns that were repeatedly presented to the network (producing simultaneous activation of Area 1 and Area 6) led to the formation, through Hebbian learning processes, of strongly interconnected sets of cells, associating the acoustic and articulatory components of the simulated word patterns. These cell assemblies were (a) distributed across cortical areas, (b) word-specific, and (c) activated even by partial (e.g., purely auditory) stimulation. The formation of distributed and distinct (although partly overlapping) circuits associating activity patterns as a result of biologically grounded correlation learning in a network structure involving several areas is remarkable and of theoretical significance, particularly in view of the random and sparse connectivity realised between and within the areas. Indeed, it is often argued (O'Reilly, 1998) that learning (hetero) associations between arbitrary pairs of patterns requires supervised mechanisms analogous to back-propagation (Rumelhart, Hinton, & Williams, 1986), whose biological plausibility remains questionable. As discussed in Sec. 2.3, the connections implemented in the model are well motivated by neuroanatomical studies in both humans and monkeys (cf. (Pulvermüller & Preissl, 1991)). Still, one may want to ask questions about the dependence of the results on the network structure. The model is robust to a reduction in the number of areas, and produces analogous results when 4 or 3 areas are used. This is because a smaller number of areas actually means a shorter path to be traversed by the auditory and motor activation patterns in order to “meet” the wave of activity coming from the opposite end. Indeed, if the number of areas is reduced to only two, the model becomes a simple two-layer interactive network with no “associative” layer (analogous to that used by Westermann & Miranda (2004)) and the binding between the two patterns takes place through the reinforcement of the synapses that exist between co-active cells. Hence, the introduction of such more direct links is not expected to produce any significant change in the qualitative behaviour of the network. On the other hand, an increase in the total number of areas separating the two “primary” areas A1 and M1 is expected to make CA formation slower and more
47 difficult. Subject to some parameter changes, however, and up to a certain number of additional areas, results should still hold, although a greater number of training steps will be required. It should be noted, however, that there is relatively strong evidence for the existence of a 6-area pathway connecting A1 to perisylvian primary motor cortex (Pulvermüller, 1992). Even if additional, “parallel” pathways, connecting A1 and M1 through a number of areas higher than 6, were introduced in the model (see, e.g., (Catani, Jones, & Ffytche, 2005)), it is unlikely that their presence would prevent the development of cell assemblies within the shorter, still viable, 6-area pathway, which would be automatically recruited. Although in many cases CAs were entirely word-specific (i.e., none of the cells active above threshold for a specific word was also active for a different word), sometimes they did overlap significantly (see Fig. 3.6). A high level of overlap (or cross-talk) is undesirable as it may cause a CA to activate in response to the wrong stimulus pattern, and activity in one CA to reliably induce ignition of another CA; in presence of Hebbian correlational learning, this eventually leads the two CAs to merge into a single one which responds to both input stimuli. Indeed, this phenomenon (and other inter-related problems) often hindered the formation of distinct CAs in the network during preliminary simulations (see Appendix B). The significant overlap between CAs is a symptom of the network’s inability to separate, or “pull apart” input representations that produce overlapping activations. We attribute this to the fact that Sejnowski’s covariance rule (Sec. 2.2.2) does not implement competitive learning (K. D. Miller & Mackay, 1994). Competitive learning (Grossberg, 1976a, , 1976b; Kohonen, 1984; Kohonen & Makisara, 1989) is a form of unsupervised learning in which the network learns how to categorize and gradually “separate” input patterns so that only one output unit responds to a given pattern. The covariance rule fails to achieve this, and encourages CA merging rather than CA separation. To see why this is so, consider the 2-area network of cells depicted in Figure 3.7 below. Let us assume that the network uses sparse coding, and that the cells in area 1 are repeatedly confronted with different patterns of activation. Assume that two input patterns (called A and B) strongly activate cells A1, A2, C1, C2 and B1, B2, C2, C3 respectively.
48
w1
A1
C1
w2
A2
w3
B1
w4 B2
C2 w5
C3
w6 area 2
area 1
Figure 3.7 Schematic illustration depicting an example of overlapping cell assemblies. Nodes simultaneously active are depicted using the same fill pattern. The weights of the links between area 1 and area 2 are labelled w1,....,w6. The dashed and dotted lines identify the two CAs activated by two different input patterns (see text for details).
During learning, the weights are modified according to the co-variance rule, which can be summarized by the following table:
Pre-synaptic cell
∆w= pre* post
Post-synaptic cell
active
↑
active
↑
↑
(a)
silent
↓
active
↑
↓
(b)
active
↑
silent
↓
↓
(c)
silent
↓
silent
↓
↑
(d)
The size of the arrows in the table indicates the magnitude of the difference between current and average activity of that cell; the orientation indicates the sign of such difference (up: positive; down: negative). The differences are larger when cells are fully active than when they are silent (in a sparsely active network, a cell’s average activity is much closer to zero than to its maximum level of activation). First, note that links between two cells that are simultaneously silent are strengthened (case (d)). In addition to not being neurobiologically plausible, this leads to an overall “gluing” effect. Addressing this issue by simply setting ∆w = 0 in case (d) would not be sufficient to solve the merging problem. In fact, because of the
49 differences in magnitude, the net effect produced by the alternated strengthening (a) and weakening (cases (b) or (c)) of a link is an increase in strength. In the example of Fig. 3.7, alternation of inputs A and B means alternated increase (a) and decrease (b) of w3 and w4: the net effect is a weight increase in both, which, in the long run, will cause the two cell assemblies to merge into a single one. This problem may be addressed in different ways, e.g., by imposing a fixed ∆w (so that weakening and strengthening would produce weight changes of equal magnitude), changing the density of the between-areas connectivity, or increasing the level of spontaneous activity in the network (so that the average activation of a cell is mid-way between silent and fully active). Some of these strategies were adopted in the revised version of the model, in which the covariance rule was replaced by the second, more biologically accurate Hebbian rule, based on the ABS model of LTP/LTD (see Sec. 2.2.2). Unlike the covariance rule, the ABS rule: •
uses the same amount of weight change ∆w per unit time for both LTP and LTD;
•
does not strengthen links between cells that are simultaneously silent;
•
uses a single parameter’s value (the postsynaptic membrane potential) to determine whether LTP or LTD should occur – see Eq. (2.4).
In view of the previous considerations, we expected the first two features to lead to a lower degree of merging and overlap between CAs. The last feature (also based on neurobiological evidence) allows one to precisely define the ranges of values of the postsynaptic membrane potential for which either LTP or LTD will occur. We conjectured that, by changing the ratio between the widths of these ranges, it should be possible to modulate the total amount of competitive learning that takes place in the network. Experiment 1 was then repeated using the revised model; the results of these simulations are reported below.
3.2 Experiment Set 2 – Emergence of CAs in the revised model This set of experiments was analogous to Experiment Set 1 (previous section), but was performed using a model that implemented the Artola-Bröcher-Singer rule instead of Sejnowski’s covariance rule to simulate synaptic plasticity. This aimed at
50 reducing the amount of overlap between the CAs and hence the likelihood of them merging. In addition to replicating and improving on the results of Experiment Set 1, we
were
interested
in
quantifying
the
functional
characteristics
and
neurophysiological properties of the CAs in terms of their distributedness, memory features and pattern completion abilities.
3.2.1 Experiment Set 2 – Methods The methods for this set of experiments are analogous to those used in Experiment Set 1, Sec. 3.1.1: we generated and randomly initialised eight different networks, and trained each of them with four different pairs of random sensory-motor patterns; here, each stimulus pair was presented five thousand times. As in Experiment 1, subsequently to the successful emergence of distributed cell assemblies, we measured (i) average CA size and (ii) average overlap (number of cells that two CAs shared). In addition, by recording the networks’ responses to stimulation of Area 1 only, we also measured CA input specificity and recollection (or “pattern reconstruction”) ability of a CA, which quantified how easily (what portion of) a CA became fully active following activation of just a subset of its component cells. This was done by presenting, for four time steps, only the auditory component of the four learnt pairs and measuring, area by area, the average of (a) the induced CA activity (in %), and (b) the cumulative portion of CA cells that were reactivated by the stimulus. The averages were calculated across all the four patterns for each of the eight different networks, producing a total of 32 different (stimulus, network) pairs.
3.2.2 Experiment Set 2 – Results Like in Experiment Set 1, as the training progressed, we observed the emergence of distributed cell assemblies associating sensory-motor patterns. However, the CAs that emerged were qualitatively different from those observed in the previous set of experiments. Figure 3.8.(a) shows the time-averaged response of one (randomly chosen) of the networks to the presentation of one of the four input patterns (words) at different stages of learning. Compare the network responses shown in this figure with those shown in Figure 3.2 (a) and (b).
51 A1
AB
PB
PF
PM
M1
10
100
1000
5000 Figure 3.8.(a). Average response of one network to one of the 4 word pattern pairs that it had been trained with, at different stages of learning: after 10, 100, 1000 and 5000 stimulus presentations.
Like before, activation is initially weak in the middle areas; however, as learning progresses, the CA quickly reaches and expands within areas PB and PF, where the binding between sensory and motor patterns takes place. The number of cells that are involved in the binding is significantly higher than that observed in the previous simulations. Crucially, at later learning stages, the size of the CA in the middle areas decreases (compare the responses after 100 and 5000 stimulus presentations: both the number of white squares and the intensity of their activation is reduced). This indicates that, after the initial period of expansion, the cells in areas PB and PF, most densely populated, undergo a process of competition, which allows only the most active ones (and the strongest links) to survive, leading to a “pruning” of the synaptic connections and CA size reduction. Figure 3.8.(b) illustrates an interesting example of one of the networks responding to the auditory pattern of a word stimulus after training. The behaviour of the network during the first 12-16 steps is analogous to that obtained with the previous version of the model (see Fig. 3.4). Notice, however, also the presence of a fast, unfocussed wave of activity, produced by non-specific activation in the auditory area, which quickly traverses the entire network and is over by time t=20.
52
Area 1
Input to Area 1
Area 2
Area 3
Area 4
Area 5
Area 6 t=0
t=1
t=2
t=4
t=8 t=12 Figure
3.8.(b).
Network response to Area
1
with
the
t=16
stimulation auditory
t=20
component of one of the learnt pairs after training. Each row is a
snapshot
of
the
network output taken at
successive
time
points. The associated motor pattern that the
t=40
network was trained with is shown, for
t=44
comparison only, on the right hand side. See text for details.
t=48
53 Consider Area 1-3: the specific cells activated there remain active well beyond the removal of the input stimulus. This suggests that these cells are part of a circuit of strongly connected cells, which emerged with learning and which create within- and between-area reverberant activity. As in Experiment 1, the somewhat slower propagation of activity within specific, isolated cells continues across the network, although the number of cells strongly active appears to decrease as the middle and rightmost areas of the network are reached (time t=12–24). When the reverberant activity reaches the final area (t=20), an interesting process takes place: from the activity of a few cells situated mostly in the top part of Areas 4-6, an entire new “pulse” of reverberant activation develops, not producing a dispersed cloud but strongly activating only a very specific set of cells in Areas 6, 5 and 4. Notice that when this second slow wave “peaks” (t~36), the articulatory activation pattern (shown in the rightmost column of Fig. 3.8.(b) for illustrative purposes only) that had been paired with this auditory input pattern is reproduced almost entirely in Area 6. Finally, the wave of reverberant activation stops when it fails to activate a specific set of cells in Area 3 strongly enough so as to allow self-sustained activation to continue.
Average CA size Number of cells.
100 Size
80 60 40 20 0 0
0.1
0.2
0.3
0.4
0.5
0.6
0.7
0.8
0.9
1
Activation threshold γ Figure 3.9. Average CA size. The average (SEM) number of cells within the entire network that responded above threshold to a specific input stimulus is plotted as a function of the threshold γ.
Figure 3.9 plots CA size (averaged across 32 CAs, produced by the four input stimuli in each of the eight networks) as a function of the threshold γ, where a CA is defined as specified in Sec. 3.1.1. As one would expect from such a functional definition,
54 small values of γ still correspond to larger assembly sizes, and vice versa. However, the size of the CA does not change much when γ is in the range [0.05, 0.7], and, even for γ=0.95, the CA size is around 50 cells. Thus, CAs appear to be well identifiable entities formed by a “core” of about 50 cells that respond very strongly (at least 95% of the maximally active cell, on average) to the input stimulus, and by an additional “belt” of about 30 cells that respond more moderately but still well above average (at least 70% of the maximally active cell). Figure 3.10 plots the results concerning the CA distinctiveness. The maximum overlap (i.e., maximum % of cells in a CA that are shared with another CA) is above 5% only for values of γ < 0.1. The average overlap between two CAs, on the other hand, is always below 5% and less than 2% for γ > 0.2. This makes cross-talk very unlikely, as activation of 2%-5% of the cells is not sufficient to cause full CA activation (see also Fig. 3.13).
Overlap between pairs of cell assemblies % of shared cells
10 Maximum overlap
8
Average overlap
6 4 2 0 0
0.2
0.4
0.6
0.8
1
minimal-activation threshold γ Figure 3.10. CA distinctiveness. The graph plots the mean overlap between one CA and the other three (solid line) and the overlap between one CA and the maximally overlapping CA (dashed line) as a function of the minimal-activation threshold γ. The data are the average (SEM) of the results of eight network simulations.
Figure 3.11 and 3.12 show the area-specific spatio-temporal activation and pattern completion properties of the CAs, respectively. Figure 3.11 plots the percentage of
55 CA cells active above threshold γ13 in each area after stimulation of Area 1 only with a learnt auditory pattern. The figure delineates how the wave of CA activation spreads across the network, and the contributions of the different areas to the total activation, each area peaking at a different time and with different intensity. Figure 3.12 summarizes the average pattern-completion abilities of the network, plotting the cumulative portion (in %) of CA cells in the different areas that are re-activated following stimulation of Area 1. This graph is obtained by integrating over time the plots of Figure 3.11. As one might expect, pattern completion worsens as activity propagates further away from the input area and activation becomes weaker. The motor pattern that had been paired in Area 6 with the auditory pattern in Area 1 (now given as input to the network) is, on average, reconstructed only partially (approximately 30%), while the average pattern reconstruction across the six areas is above 75%. It should be noted that the network responses to learnt patterns never contained any “spurious” cells; in other words, the only “errors” are missing cells that fail to be fully reactivated. Thus, although the associated pattern is not entirely reconstructed, all the cells activated by the stimulus are correct and can be seen as a reliable set of “core” representation units.
Average CA activation following Area-1 stimulation % CA cells active above . threshold .
100 80
Area1 Area2
60
Area3 Area4 Area5
40
Area6
20 0 1
11
21
31
41
51
time (simulation steps) Figure 3.11. Spatio-temporal pattern of activation of a CA. The curves show the average area-specific CA activation following Area-1 stimulation with one of the learnt auditory patterns (words) as a function of time. 13
We used γ=0.45, but, as discussed above, any γ∈]0.2, 0.7] is expected to produce similar
results.
56
% CA cells activated
Cumulative portion of CA cells re-activated by stimulation of Area 1 Area1
100
Area2
Area3 Area4
Average
80 60
Area5
40
Area6
20 0
Figure 3.12. Average pattern-completion abilities of a CA. The bars show the cumulative portion of a CA (% of CA cells per area) that a learnt stimulus presented to Area 1 successfully reactivates over the 50 steps following stimulation, averaged across 32 different auditory patterns (four patterns per network). The rightmost bar indicates the average of the six area-specific values.
Cell-assembly responses to Area-1 stimulation with a word Maximally active CA
40
sum of cells' output (within CA) ..
2nd best CA 3rd best CA
30
4th best CA 20 10 0 1
11
21
31
41
51
simulation time-step Figure 3.13. CA specificity. The graph shows the average (SEM) response of the four different CAs following auditory (Area 1) stimulation with one of the learnt patterns. The activation threshold used was γ=0.45.
Finally, Figure 3.13 illustrates the results on CA input specificity. Each curve plots the sum, across the six areas, of the output of all the cells of each CA as a function of time. CAs appear to be highly specific: only one CA is strongly activated by the pattern in input, while the others show very little, if any, activity. These results
57 confirm the conclusions drawn from Figure 3.10, which suggested little probability of cross talk between CAs.
3.2.3 Experiment Sets 1 & 2 - Discussion The results of Experiment Sets 1 and 2 demonstrate the emergence of CAs in the network. As mentioned in Sec. 3.1.3, the successful setup of distributed Hebbian circuits spanning a realistic number of cortical areas forming the substrate of perception-action learning is remarkable, given that no computational “tricks” such as back-propagation of errors (Rumelhart, Hinton, & Williams, 1986) were used during the training. The emerging CAs are strongly interconnected sets of cells that exhibit: (a) Distributedness and sparseness (Fig. 3.9 and Fig., 3.11, respectively): one CA consists, on average, of less than 100 cells distributed across the six areas, equivalent to less than 2.67% of all cells within the network; (b) reverberation and persistence of activity (Fig. 3.13 shows strong CA activity until 35-40 steps after stimulus offset) in absence of input within wellidentifiable sets of cells; (c) relatively stable size for different critical activation thresholds γ (Fig. 3.9); (d) small overlap and cross-talk between pairs of CAs (less than 5% on average), and high specificity of response (Figures 3.10 and 3.13); (e) pattern completion abilities (averaged across areas) above 75%, in spite of the sparse and random character of the network connectivity (Fig. 3.12). These results suggest that a CA behaves as a highly specialised, discrete activation (“on-off”) functional unit which, if sufficiently stimulated, becomes fully active through a positive-feedback process of reverberation (Braitenberg, 1978; Hebb, 1949; Pulvermüller, 1999). Indeed, the macroscopic behaviour of a CA appears to be nonlinear and characterised by a specific activation threshold, very much like a single neuron. For the positive-feedback loops that form a CA to be able to “drive” the circuit towards full activation, it is necessary that sufficient activity is captured by them so that the amount of self-generated excitation overcomes the amount of “leakage” and dispersion. If the activity present in the positive-feedback loops
58 exceeds this threshold (the value of which depends on the specific characteristics – strength, reciprocity – of the internal connections of the CA), the total activity in the CA does not dissipate but starts to increase and propagate to the rest of the CA, in a wave-like fashion (see Figures 3.4 and 3.8), producing a momentary “pulse” or peak of activation in the entire CA (see Fig. 3.13). This surge of activity in the network (sometimes called “ignition” (Braitenberg, 1978)) causes the area-specific inhibition mechanism to take effect, which then subsequently inhibits the CA and the entire network (overshoot). In the revised version of the model, Hebbian learning was implemented according to the ABS model of LTP and LTD (Artola & Singer, 1993). Compared with the original concept of coincidence learning mentioned by Hebb (in which synaptic modification occurs only as strengthening of connections between two co-active neurons), both the covariance and ABS rules envisage, in certain cases, the weakening of links: more precisely, while co-occurrence of sufficient pre-synaptic activity (O(x,t)≥θpre) and strong post-synaptic depolarization (V(y,t)≥θ+) leads to a weight increase (LTP), presence of only one of these conditions leads to a decrease (LTD). Such weakening contrasts the ever increasing synaptic weights that are brought about by coincident activation. The effects of adopting the more neurobiologically realistic (ABS) rule, however, are evident. First of all, CA size is much more stable across different threshold values (compare Fig. 3.9 and Fig. 3.5); the results indicate that the distributed representations that emerged are clearly identifiable sets of strongly interconnected cells. Secondly, CAs are significantly “thicker” in the middle areas (compare Fig. 3.8.(a) and Fig. 3.2); this allows more cells to be involved in the binding between sensory and motor patterns, leading to stronger CAs and better pattern completion capabilities (compare the portion of the motor pattern reconstructed in Area 6 by the response shown in Fig. 3.8.(b) with that shown in Fig. 3.4). Most importantly, the adoption of the ABS rule introduced a competitive element in the learning process (see Fig. 3.8.(a)) which minimized the problems of merging and cross-talk (compare Fig. 3.10 and Fig. 3.6) and led CAs to become anatomically distinct (and functionally discrete) units. The adoption of a more realistic unsupervised learning rule made the formation of relatively stable cell assemblies more difficult than it would have been using supervised (e.g., backpropagation) learning methods, and made it subject to the
59 optimization of various parameters of the network. Appendix B describes these problems in detail and the way in which they were addressed. In the past, some of these issues have been used as arguments against the feasibility of correlation learning and of the Hebbian cell-assembly model. For example, in a useful compendium of such arguments, Milner (1996) wrote: “It is difficult […] to understand why the synaptic modification that links neurons to form an assembly fails to involve more and more neurons until the whole brain becomes one immense and useless cell assembly” (ibid., p.70) and, later: “Another serious problem is that an assembly of neurons linked by excitatory connections would be inherently unstable and liable to fire out of control at the slightest disturbance” (ibid., p.72). Our model provides evidence that these problems can be overcome, even if biologically plausible associative learning is used. First of all, the growth of a CA is limited by the slow but constant competition for shared cells that takes place between different CAs (see Fig. 3.8.(a)). To clarify: every time a CA is stimulated, the learning causes some synapses to strengthen and others to weaken. As a result, some cells become more strongly connected to a CA (i.e., more likely to be activated by it), and less to other, inactive, CAs. If the network were always confronted with only one stimulus, the corresponding CA would indeed keep growing and take over the entire network. However, during training, the input stimuli alternate continuously (see Sec. 3.1.1); each different stimulus excites a different CA, possibly overlapping with other CAs. The continuous alternation of different stimuli causes the cells that are shared by the different CAs to be alternatively bound more strongly into one or the other assembly. If the input stimuli alternate in a balanced way (as was ensured here), the cells in the overlap never become entirely an exclusive part of any of the competing CAs; rather, they are the site of a constant competition in which each of the assemblies is limiting the growth of the others, producing a state of dynamic equilibrium. Secondly, regarding the instability of a CA (and of the network), spontaneous activation of CAs during periods in which no input was presented did occur, as
60 predicted, due to the background noise present in the network.14 However, whenever this happened, the self-regulation mechanism (FI) started to operate, causing the CA to be “switched off” soon after its full activation and preparing the ground for the next CA activation. One last point concerns the number of (sensory-motor) pattern pairs used to train and test the network, which is very small (four) when compared to the number of words that our brain can store. Implementing a large-scale network capable of storing a realistic number of lexical items was not one of the objectives of this work: our main aim was to show proof-of-concept simulations that enable the explanation of previous experimental findings and prediction of future ones. As the next Chapter will demonstrate, for these purposes it is sufficient to model the acquisition and processing of a limited number of exemplar sensorimotor patterns, lexical items, or words.
3.3 Summary and main contributions We used the model described in Chapter 2 to test the mechanistic validity of the theory according to which speech-related co-activation of neurons in IF and ST cortex should lead, in presence of Hebbian learning, to the formation of word cell assemblies (CAs) distributed over these areas (Braitenberg, 1978; Pulvermüller, 1999). The simulations demonstrated the spontaneous, unsupervised emergence of such strongly connected perception-action circuits, providing proof-of-principle evidence in support of the theory, and demonstrating the viability of correlational learning for the formation of (sensory-motor) associations in a hierarchical, brain-like, multi-layered neural network architecture. A second contribution of the simulations is the prediction that the emerging lexical representations will exhibit the following characteristics: functional discreteness (“onoff” activation levels), cortical distributedness, sparseness, reverberation (short-term memory features), anatomical distinctiveness, and pattern completion abilities. Some of these characteristics, together with the simulations described in Chapter 4, will give rise to specific predictions about the neurophysiological effects of attention on lexical processes, which will be tested in Chapter 5. 14
This behaviour was not entirely undesired, as it can be interpreted as a model analogue of a
“spontaneous thought”.
61
Chapter 4 – Simulating Lexicality and Attention effects
This chapter describes two additional sets of experiments carried out using the neuralnetwork model of the language cortex presented in Chapter 2. These tested whether a network that had developed a set of word representations as a result of learning (see Chapter 3) could replicate and explain existing neurophysiological data on the effects of lexicality and attention on the processing of speech.
4.1 Experiment Set 3 – Replicating lexicality effects Here we used the set of eight networks resulting from Experiment Set 2 (Sec. 3.2) to simulate the brain responses to meaningful words and meaningless pseudowords (i.e., non-English, phonotactically correct word-like material, such as “sklued”, or “drock”). We wanted to test whether the model could replicate recent evidence according to which early (< 200 ms. post stimulus onset) neurophysiological responses are larger to (spoken) words than to pseudowords – see Sec. 1.1., Figure 1.2 (Korpilahti, Krause, Holopainen, & Lang, 2001; Pettigrew et al., 2004; Pulvermüller et al., 2001; Pulvermüller & Shtyrov, 2006; Shtyrov & Pulvermüller, 2002).
4.1.1 Experiment Set 3 – Methods We recorded the network responses following brief stimulation (four time steps) of the auditory area only (Area 1, see Fig. 3.1) with either one of the learnt patterns (words) or a new, previously unseen, pattern (pseudoword). We generated pseudoword patterns by “gluing” together randomly scrambled sub-word patterns. More precisely, for each network, the four pseudoword patterns were generated by combining sub-parts of the four word patterns at random (recall that these are 25-by25 squares of binary configurations containing n=17 cells set to “1” and 608 cells set to “0”), using the following procedure:
62 •
For all i∈{1,..4}, divide word pattern wi into 25 sub-patterns of size 5x5;
•
For all j∈{1,..4}, initialise the pseudoword pattern pwj as empty;
•
let j=1: (A) copy six randomly chosen sub-patterns from each of the four wi into pwj , so that the original position of each sub-pattern in wi is preserved in pwj; (B) if the number of active cells in pwj is > (pseudowords difference should become significant early in the response, and that this should always happen, if subjects are distracted.
71 Experiment Set 4 shows that variation of the amount of area-specific feedback inhibition (FI) of the network modulates the relative magnitude and latency of the simulated brain responses to words and pseudowords. More precisely, weak FI (corresponding to high attention and excitability) produced – on average – late activation differences, with a stronger response to pseudowords than to words. In contrast, strong FI, simulating suppression and a lack of attentional resources, lead to early activation differences, with a stronger response to words than to pseudowords. Thus, the network behaviour replicates the divergent neurophysiological data presented in Section 1.1 (see Fig. 4.6 below), as the N400 response presents a late (around 400ms) difference, with relatively larger responses to pseudowords, while the MMN exhibits an early (100-250ms) difference, with larger responses to words. We shall now explain the underlying mechanisms that make the neural network respond in this particular way.
Figure 4.6 Real and simulated N400 and MMN brain responses. (A): Typical N400 response to spoken words and pseudowords (from Fig. 1.1). Note the larger N400 amplitude to pseudowords. (B): Magnetic Mismatch Negativity (MMN) response to words and pseudowords (adapted from (Pulvermüller et al., 2001, their Fig. 4)). Note the larger MMN amplitude to words. (C-D): Simulated brain responses to word and pseudoword stimuli under different amounts of attention (from Fig. 4.5). Left: FI=0.90; right: FI=1.20.
72
4.3.1 Explaining the Influences of Lexicality and Attention The network behaviour during the first 8-10 time steps is analogous to that observed in Experiment Set 3 (see Fig. 4.1). As described, when a pseudoword is presented to Area 1, the four CAs are simultaneously (but partially) stimulated, and, as they gather activation, they begin to inhibit each other. What happens afterwards depends entirely on the strength of the FI loop. In case of weak FI, there is weak competition between the CAs; thus, the activity in the maximally active CA is not significantly affected by the activity of the other CAs (indeed, the “wobble” in the pseudoword curve is barely noticeable when FI=0.90). Hence, as exemplified by Fig. 4.2, after a brief period of competition, the “winning” CA will resume its progress16 towards full activation, reached at around 20 simulation time-steps. Unlike in Experiment Set 3, however, here the CA becomes fully active (“on”), as the weak global inhibition is not sufficient (on average) to prevent it from reaching activation threshold. Nevertheless, albeit brief, the transient period of competition still affects the spreading of activation within the CA, making it peak later than it would have if it had been stimulated in isolation. Simultaneously, activity in the other CAs is suppressed; due to the presence of strong self-excitatory loops within the CAs circuits and the weak FI, however, this activity does not immediately disappear, but continues to reverberate and is still present in one (or more) nonwinning CAs when the winner CA reaches full activation. At that point, the total network output is the result of the activity of the maximally active CA (at its peak) plus the residual activation in the other CAs. This makes the peak of the total network response to a pseudoword larger than that to a word: all the rest being equal, the total activation due to one fully active CA is (on average) smaller than the total activation due to one fully active CA plus one or more partially active CAs. The possible psycholinguistic correlate of this computational process may be the activation of several neighbours of a stimulus pseudoword. Let us now consider the case of strong FI (this was the case in Experiment Set 3). If the level of FI is sufficiently high, the co-activated CAs inhibit each other so strongly that they will be prevented from entering the unstable positive-feedback state that 16
This now takes place in complete absence of the input stimulus, which lasts only 4 steps.
73 leads to their full activation. As a result, the total network response to a pseudoword, consisting of the sum of the activities produced by only partially active CAs, remains (on average) below the total response to a word (as exemplified by Fig. 4.2). While attention modulation induced a large variation in the amplitude of the pseudoword curves, word responses do not appear to be significantly affected by attention. At the basis of this phenomenon are the strong and reciprocal connections that form the word CAs. As mentioned in Sec. 3.2.3, such positive-feedback circuits produce a non-linear behaviour in the CAs, such that, when activation threshold is reached, the CA ignition is largely independent of the level of attention/inhibition. As Hebb wrote, when igniting the cell assembly is “acting briefly as a closed functional system” (Hebb, 1949, p. xix). This functional discreteness explains the relative stability of the responses to words under variable inhibition. In contrast, as pseudowords activate several CAs but only partially, the reduced (below threshold) activity is strongly dependent on inhibition level, extinguishing under low attention and resuming full activation if FI is low. The possible psycholinguistic correlates of these processes may be, in the case of a pseudoword stimulus, the lack of recognition of any lexical item under distraction, and, in the case of words, the ability to automatically recognize and respond to familiar items even when heavily distracted. An example of this phenomenon, known as attentional capture (or “cocktail party”) effect, is our ability to automatically detect the sound of our own name even under conditions of inattention (Moray, 1959; Wood & Cowan, 1995).
4.3.2 Fit of model predictions and neurophysiological data The model simulates the cortical sources that generate electric potentials and magnetic fields at the surface of the head. Therefore, strictly speaking, the predictions and explanations apply at the level of brain activation, not at that of event-related potentials and fields (ERP/Fs). However, the differential activation to words and pseudowords revealed by ERP/Fs is also manifest at the level of sources localised in the perisylvian region (e.g., Hauk, Davis, Ford, Pulvermüller & Marslen-Wilson (2006); Pulvermüller et al. (2001)). Thus, larger (smaller) words/pseudowords responses or ERP/Fs are assumed to be generated by correspondingly larger (smaller)
74 underlying sources. This assumption is supported by experimental evidence reported in Chapter 5. Furthermore, other works have adopted the same approach and successfully modelled EEG/MEG signals as the average depolarisation of pyramidal cells (e.g., David & Friston (2003)). Interestingly, the time course of the simulated peak differences between word and pseudoword responses roughly reflects the one exhibited by experimental data. In fact, in the model, early differences (see Figure 4.5, bottom graph) peak at around 7-8 time-steps after stimulus onset (which is at step 2 in all cases), while the late differences peak at 18 time-steps after stimulus onset (Fig. 4.5, top graph). If we assume that the MMN response peaks at about 120ms after stimulus onset, one ∆t in the simulation corresponds to 120/7≈17ms, and the simulations predict a late peak (in presence of attention) at around 18*17ms = 306ms. If, on the other hand, we work from the assumption that the N400 response peaks at 400ms, then one ∆t corresponds to 400/18ms ≈ 22ms, and the simulations predict an early peak (when attention is directed away) at around 7*22ms = 154ms. Although these calculations should be taken with caution as they are the result of simple extrapolations, they do provide some evidence for the ability of the model to make predictions of the correct order of magnitude on the spatio-temporal patterns of cortical activation. In view of the above, one simulation time-step ∆t can be considered to correspond approximately to 20ms.
4.3 Summary and main contributions Chapter 2 described the implementation of a neuroanatomically grounded neuralnetwork model of the left-perisylvian language cortex, and its use to simulate brain processes of early language learning. Chapter 3 described the formation of sets of strongly interconnected circuits across cortical areas in the network, which we referred to as cell assemblies. Building on these results, this Chapter simulated activation of the language cortex when meaningful familiar words (learnt patterns) and senseless unknown pseudowords are presented as input under different amounts of attention. The model simulations replicate both MMN and N400 brain responses to words and pseudowords, typically observed under different experimental conditions, suggesting that these opposite results can be explained by the modulatory effects of attention on the cortical responses to pseudoword (and not to word) stimuli. The main original contributions of the work described in this chapter are the following: (1) the
75 model is the first one to reconcile and mechanistically explain, at the cortical-circuit level and by means of a single set of neurobiological principles, existing experimental results previously not well-understood; (2) the model points to the level of areaspecific feedback inhibition as a basis for the brain mechanisms of attention, and makes strong predictions on how and why this cognitive process modulates the magnitude of event-related brain responses to speech stimuli. In particular, according to the simulation results, attention modulation should be able to bring out both types of responses (N400 and MMN, i.e., words up vs. pseudowords up) in the same experiment. In other words, attention modulation should make the MMN bigger to words when subjects’ attention is directed away from speech, but produce the reversed effect (MMN larger to pseudowords) when subjects are paying attention to the – same – speech stimuli. Crucially, the model also predicts that the amount of attentional resources available should significantly modulate the brain responses to pseudowords, but not to words, which should be relatively unaffected by changes in attention. The experimental testing of these critical predictions is the object of the next Chapter.
76
Chapter 5 – Neurophysiology of Attention and Language interactions: an MEG study
This Chapter describes the use of magneto-encephalography (MEG) techniques to test the novel predictions of the model of the language cortex that were generated by the simulations described in Chapter 3 and Chapter 4.
5.1 Introduction The
network
simulations
presented
in
Chapter
4
explain
the
opposite
neurophysiological activation patterns to words and pseudowords seen in N400 and MMN experiments. The explanation rests on the fact that words activate discrete cell assemblies whose strong internal connections guarantee that activation is largely independent of external inhibition level (Hebb, 1949; Pulvermüller, 1999). Pseudoword stimuli, in contrast, activate several competing representations and global inhibition determines the degree to which their activations may co-exist: with attention to stimuli, the model response is therefore larger to pseudowords than to words, but under limited attentional resources (stronger inhibition) pseudoword responses are reduced below the level of word responses (see Fig. 4.6). Although the model provides a tentative explanation of N400 and MMN results, it attributes the difference to a single factor (attention), and it is this statement that needs testing in new critical neurophysiological experiments. Comparing typical tasks used to record the N400 and the passive oddball paradigm, where the lexical MMN enhancement is seen, there are differences in memory requirements, lexico-semantic processing, context processing, variability and repetition of stimuli and, of course, attentional demands which make it impossible to attribute with certainty neurophysiological differences to a single psychological variable. Here, we used MEG to test the predictions of the model, namely, that keeping all other features constant, focussed attention to speech is the critical variable leading to the reversal of the neurophysiological lexicality effect. A second prediction was that such inversion
77 is mainly produced by the (strong) modulation of the pseudoword response, whereas the word response stays relatively stable (see Fig. 4.5). In order to administer this critical experiment, we used variants of the oddball task. To precisely control for stimuli properties, we applied an orthogonal design where the same sounds were played in word and pseudoword contexts. In addition, attention was also varied orthogonally, so that, for each lexical context, the same sounds were processed while attention was either directed (1) to speech, or (2) away from speech.
5.2 Materials and Methods 5.2.1 Subjects Twenty four healthy right-handed (Oldfield, 1971) monolingual native speakers of English (9 women) aged 20-41 years participated in all parts of the experiment. They had no record of neurological diseases, vision or hearing problems, and reported no history of drug abuse. All subjects gave their written informed consent to participate in the experiment and were paid for their participation. The experiments were performed in accordance with the Helsinki Declaration. Ethics approval had been issued by the Cambridge Psychology Research Ethics Committee (CPREC).
5.2.2 Design The processing of spoken words and pseudowords was studied in two tasks carried out in separate sessions, referred to as “Attend” and “Ignore” sessions (or conditions). Attention was manipulated in the two sessions by instructing subjects to either focus completely on the auditory stimuli (Attend condition) or on a silent video (Ignore condition). The auditory stimuli were identical across the two sessions; each session consisted of two blocks; block and session order was counterbalanced across subjects. As clarified by Table 5.1, we adopted an orthogonal design: across the two blocks, lexicality and acoustic-phonetic features of the auditory stimuli were varied independently of each other (see details below).
78 5.2.3 Instructions Subjects were seated in front of a screen on which the silent film was being projected; during the recording, acoustic stimuli were delivered binaurally to the subjects. In the Ignore session, subjects were asked to ignore the auditory stimuli and concentrate on the video; they were made aware that at the end of the recording they would be given a test on the contents of the movie to assess whether they had paid attention to the video. In the Attend session, subjects had to focus their attention on the acoustic stimuli and react to some of them by pressing a button with their left index finger; they were asked to ignore the movie but not close their eyes. In order to become familiar with this task, subjects were given a 15-minute training prior to the beginning of the recording.
5.2.4 Tests Perceptual and cognitive properties of the stimuli which could, in principle, affect neurophysiological activity and confound the results were assessed through a questionnaire posed at the end of the second session. All subjects rated (1) whether they could easily understand the recording, (2) whether they would consider the stimuli to be frequently used in everyday language, (3) whether the stimuli made sense, (4) whether they reminded subjects of an action they could perform themselves, (5) whether the stimuli were imageable, and (6) whether they reminded them of bodily sensations. At the end of each session, subjects were asked to rate (on a scale from 1 to 7) the amount of attention that they had paid to the sounds and silent video during the session, and had to answer 10 multiple-choice questions on the contents of the film.
5.2.5 Stimuli preparation and delivery Digital recordings (sampling rate 44.1 kHz) of a large sample of the items [baj], [paj], [hajp], [hajt], [hajk] and *[hajg] spoken in random order by a female native English speaker were acquired in a soundproof room. From this set we chose a pair of CV syllables [baj] and [paj] and extracted the syllable-final phonemes [p], [t], [k] and [g]. The full set of stimuli used in the experiment (including the two critical words [bajt] (bite) and [pajp] (pipe) and pseudowords *[bajp] and *[pajt]) were obtained by crosssplicing the same recordings of the coda consonants [p], [t], [k], [g] onto both CV
79 syllables [baj], [paj] (see Table 5.1 and Fig. 5.1). This avoided differential coarticulation cues and minimized acoustic differences between the stimuli. The two chosen CV syllables had the same F0 frequency (272Hz), and were carefully adjusted to have equal duration (330ms) and average sound energy (rootmean-square (RMS) power; −9.4dB). The chosen samples of the critical phonemes [p], [t] had the same length (75ms) and similar envelopes; their amplitudes were also normalized to match for averaged RMS power (−36.6dB). The silent closure time between CV end and onset of the plosion of the final stop consonant was adjusted to a value typical for English unvoiced (80ms) and voiced (30ms) stops. The [k] and [g] plosions were also presented after an exceptionally long closure time (230ms and 180ms, respectively), a phenomenon occurring naturally in the geminate stops of some languages (e.g., Finnish, Italian). The pseudowords containing such “artificial” geminates were used as target stimuli in the Attend condition; this was intended to make the detection of targets more challenging for the monolingual native English speakers. Block A
Block B
[baj]
[paj]
[bajp]
[pajp]
pseudoword
word
Context Coda CV C
[p]
0
[t] 18
622
22
605
[bajt]
[pajt]
word
pseudoword
2601
0
2558
Table 5.1. Orthogonal variation of acoustic-phonetic features and lexicality across blocks for the four critical items. Numbers indicate word (left) and trigram (right) frequency (per million) for that item (CELEX Lexical Database (Baayen, Piepenbrock, & van Rijn, 1993)).
For the analysis and generation of the acoustic stimuli, we used the CoolEdit 2000 program (Syntrillium Software Corp., AZ). The stimuli were delivered at a
80 comfortable hearing level through plastic tubing attached to foam earplugs using the MEG Etymotic system, based on ER·3A insert earphones (Etymotic Research, Inc., IL). The delivery was controlled by a personal computer running E-prime software (Psychology Software Tools, Inc., Pittsburgh, PA). STD DEV3 STD DEV1 STD DEV2 STD DEV5 STD DEV2 …… 1.0s
time
STD
DEV1
DEV2 [bajt]
*[bajp]
Block A
[baj]
Block B
330ms
485ms
[paj]
80ms
[pajp]
485ms
80ms
*[pajt]
Figure 5.1. Stimulation paradigm and stimuli of interest. Top: schematic illustration of the oddball design used for the presentation of the auditory stimuli (STD = standard, DEV = deviant stimuli; horizontal axis represents time). Bottom: waveforms of the standard and deviant stimuli of interest, with respective durations and phonetic representation.
5.2.6 Procedures The auditory stimuli were delivered using an oddball design. The stimulus onset asynchrony between two consecutive items was 1000ms. Conforming to Näätänen and colleagues’ optimal paradigm (Näätänen, Pakarinen, Rinne, & Takegata, 2004), the frequently-occurring standard stimulus (STD) constituted 55% of a block sequence; four different deviant stimuli (DEV1-4), each with 10% frequency, were randomly presented in alternation with the standard (see Figure 5.2, top). A fifth deviant stimulus (DEV5) filled the remaining 5% of the sequence: this was one of the two possible targets that the subjects had been instructed to respond to (each 2.5% frequency). Each block sequence contained 1920 stimuli in total, providing 32 minutes of auditory stimulation.
81 During each session recorded in the Attend condition, subjects were provided online feedback on their performance (hit rate and number of false alarms) at four different times (in the middle and at the end of each of the two blocks) to ensure their attention to the stimuli, at which point auditory and visual stimulation was temporarily suspended. In the Ignore condition sessions, auditory and visual stimulation was also suspended briefly at the same time points (during which the condition of the subjects was assessed).
5.2.7 MEG Recording Throughout the experiment, the brain’s magnetic activity was continuously recorded using a 306-channel Vectorview MEG system (Elekta Neuromag, Helsinki, FI) with passband 0.10–330 Hz and 1KHz sampling rate. To enable the removal of artifacts introduced by head movements, the position of the subject’s head with respect to the recording device was tracked throughout the session. In order to do so, magnetic coils were attached to the head and their position (with respect to a system of reference determined by three standard points: nasion, left and right pre-auricular) was digitized using the Polhemus Isotrak digital tracker system (Polhemus, Colchester, VT). To allow the off-line reconstruction of the head model, an additional set of points randomly distributed over the scalp was also digitized. During the recording, the position of the magnetic coils was continuously tracked (continuous HPI, 5Hz sampling rate), providing information on the exact position of the head in the dewar.
5.2.8 MEG Data Processing For each subject, MEG channel, block and condition, we applied the following preprocessing steps: (a) The continuous raw data from the 306 channels where pre-processed off-line using MaxFilterTM software (Elekta Neuromag, Helsinki), which minimises possible effects of magnetic sources outside the head as well as sensor artifacts using a Signal Space Separation method (Taulu & Kajola, 2005; Taulu, Kajola, & Simola, 2004). MaxFilter was applied with spatio-temporal filtering and head-movement compensation, which corrected for within-block motion artifacts.
82 (b) Using the MNE Suite (Martinos Center for Biomedical Imaging, Charlestown, MA), stimulus-triggered event-related fields (ERFs) starting at 100ms before stimulus onset and ending 500ms after offset were computed from the MaxFiltered data for each stimulus of interest ([baj], [paj], [bajt], *[bajp], *[pajt], [pajp]). Epochs containing gradiometer, magnetometer or EOG peak-to-peak amplitudes larger than 3000fT/cm, 6500fT or 150µV, respectively, were rejected. Only ERFs with a minimum of 100 accepted trials were used (this led to the exclusion of four subjects). The responses to the (deviant) stimuli ending in [k] or [g] were excluded from the analysis because of their acoustic similarity to the target stimuli. (c) In each block, the magnetic MMNs were obtained by subtracting the averaged response to the CV sound presented as standard stimulus from that to the CVC deviant stimuli: in block A, the ERF to the standard [baj] was subtracted from the ERFs to the deviants [bajt] and *[bajp]; similarly, in block B, [paj] was subtracted from *[pajt] and [pajp]. (d) The resulting magnetic MMN and standard curves were detrended, filtered on 2– 20 Hz and baseline-corrected. For the MMN responses, the baseline used was the 80ms silent closure period preceding the onset of the plosion of the syllable-final (coda) stop consonant (point at which standard and deviant stimuli differed for the first time – see Fig. 5.1); this time interval (330 to 410 ms after standard stimulus onset) will below be referred to as “pre-coda baseline”. For the responses to the standard CV stimuli, the 100 ms preceding stimulus onset were used as baseline (“pre-stimulus baseline”). (e) The amplitude of the local magnetic gradient response was calculated for each local pair of orthogonal gradiometers as the square-root of the summed squares (SRS) of their amplitudes. The resulting SRS data were used in the statistical analysis and for producing grand-average data. Matlab 6.5 programming environment (Matlab 6.5 – MathWorks, Boston, MA) was used for preprocessing steps (c)-(e). Finally, in order to estimate the cortical sources underlying the magnetic MMN, we applied a minimum-norm current estimation (MCE) technique (Hämäläinen, Hari, Ilmoniemi, Knuutila, & Lounasmaa, 1993; Ilmoniemi, 1993), L1 MCE (Uutela, Hämäläinen, & Somersalo, 1999), which minimizes the sum of the rectified current amplitudes over the whole brain, and previously has been shown to produce a realistic
83 and robust set of generators in experiments on spoken language processing (Pulvermüller, Shtyrov, & Ilmoniemi, 2003, , 2005). Using the MCE Matlab toolbox (Elekta Neuromag, Helsinki), MCEs were calculated for the across-subject averaged MMN responses for each Stimulus type (word or pseudoword), Condition and time point (in 20-millisecond time-steps), and projected on a triangularized gray matter surface of an averaged brain (Uutela, Hämäläinen, & Somersalo, 1999).
5.2.9 Statistical Analysis Statistical analyses were performed on local magnetic gradient responses. Using the maximal local SRS of the standard responses in the Ignore condition, we computed signal-to-noise ratios (SNR) as the ratio between the peak in the 0–150ms interval post stimulus onset and the peak in the pre-stimulus baseline. Only datasets with SNR larger than 5 were included in further analyses. Loci with the largest MMN gradient vector amplitudes were entered in the analyses. These were located above the left hemisphere’s temporal and fronto-central areas (see Sec. 5.3). For each locus, the averages of the local SRS of the magnetic MMN were computed for the 60-ms window around the peak of the maximal local SRS response. To ascertain the effects of attention on the brain responses to lexical items, we also computed the average local SRS of the ERFs to the standard stimuli in the two conditions during six different time windows: pre-stimulus baseline (-100–0ms), precoda baseline (330–410ms), the 80-ms window 500–580ms centred around the MMN main peak, and three additional windows centred at the times at which the standard responses displayed three prominent peaks (see Sec. 5.3, Results). Window widths were adjusted to the width of the half maximum of the respective peak (30, 40 and 60 ms). The time-averaged SRS values obtained from each of the critical recording locations, subjects, stimulus types and conditions were subjected to repeatedmeasures analyses of variance (ANOVAs). ANOVA tests with the factors Attention (Attend vs. Ignore), Lexicality (word vs. pseudoword), Stimulus (coda [p] vs. [t]) and Region-of-Interest (ROI, further split into “Anterior-Posterior” and “Lateral-Central” factors, with two and up to four levels, respectively) were computed on the data extracted from the MMN curves; additional ANOVAs with the factors Attention, Stimulus ([baj] vs. [paj]) and ROI were calculated on the local SRS extracted from the
84 responses to the standard stimuli, one for each time window of interest. Significant interactions were investigated further using additional t tests for planned comparisons.
5.3 Results 5.3.1 Behavioral ANOVA tests on the attention ratings data (Fig. 5.2) revealed a significant 2-way interaction of the factors Condition (Attend vs. Ignore) and Modality-Attended (Sound vs. Video) (F(1,15)=134.2, p