Brain-Computer Interface using P300 and Virtual Reality: A Gaming Approach for Treating ADHD Darius Adam Rohani1,2 , Helge B.D. Sorensen1 , and Sadasivan Puthusserypady1 Abstract— This paper presents a novel brain-computer interface (BCI) system aiming at the rehabilitation of attentiondeficit/hyperactive disorder in children. It uses the P300 potential in a series of feedback games to improve the subjects’ attention. We applied a support vector machine (SVM) using temporal and template-based features to detect these P300 responses. In an experimental setup using five subjects, an average error below 30% was achieved. To make it more challenging the BCI system has been embedded inside an immersive 3D virtual reality (VR) classroom with simulated distractions, which was created by combining a low-cost infrared camera and an “off-axis perspective projection” algorithm. This system is intended for kids by operating with four electrodes, as well as a non-intrusive VR setting. With the promising results, and considering the simplicity of the scheme, we hope to encourage future studies to adapt the techniques presented in this study.
I. INTRODUCTION Attention-Deficit/Hyperactivity Disorder (ADHD) is a major disorder among children characterized by behavioral problems in form of inattentiveness, hyperactivity and impulsivity. The treatment for such disability involves pharmacotherapy by psychostimulants, which directly affects the central nervous system, as it is associated with severe sideeffects [1]. Brain-Computer Interface (BCI) is an assistive system that utilizes recorded brain signals (electroencephalogram - EEG) to control an external device. However, in recent years, BCI has been used as a treatment method that guides the user through feedback from the recorded EEG [2]. In an effort to avoid psychostimulants in ADHD treatment, researchers have focused on BCI training as an alternative treatment [3]. Their methods are based on event-related (de)synchronization (ERD/ERS) [4]. Here, the subjects have to alter the frequency composition of the EEG toward higher frequencies, justified by the “low-arousal hypothesis”, that ADHD subjects show excessive low frequency (θ- and α) activity and less amount of high frequency (β) activity [3]. Attention has been defined as: “... mental ability to select stimuli, responses... that are behaviorally relevant among the many others that are behaviorally irrelevant” [5]. This ability is achieved through a two-way (posteriorand anterior-) attention system (PAS and AAS) [6]. PAS includes the parietal cortex and is responsible for locating relevant objects, orienting the sensory organs and/or filtering irrelevant information. AAS includes the prefrontal cortex and is responsible for selecting and initiating a response [6]. 1 Department of Electrical Engineering, Technical University of Denmark, Denmark, 2800 Kgs. Lyngby DK 2
[email protected]
978-1-4244-7929-0/14/$26.00 ©2014 IEEE
The ERD/ERS interventions are only focused on the AAS, and the users can change their EEG frequency composition simply by closing or opening their eyes, or by performing hard mental tasks. The interventions cannot be linked as a measure of attention to the relative task, and we believe a method that incorporates the entire attention system is needed. We propose a first-of-a-kind (to the best of our knowledge) BCI system for attention training that is based on the P300 potential. P300 is a large positive voltage in the recorded EEG, peaking around 300 ms after a cognitive attended rare stimulus [7]. Therefore, we believe that P300, as a potential only present at cognitive involvement, would be a suitable measure that contains information on whether the subject is attentive or not. A prototype of the BCI system has been developed using two different feedback games. The games require the subjects to locate relevant information presented in a short amount of time, and provides points for the presence of both P300 and correct information gathering. The prototype has been embedded in a Virtual Reality (VR) classroom that serves as a motivating environment where real-life distractions can be simulated and controlled. II. MATERIALS AND METHODS A. System Environment The VR classroom environment has been created with the game engine U NITY, the 3D modeling software B LENDER and the Kinect (an infrared camera developed by M I CROSOFT ). The Kinect provides an immersive 3D illusion of the classroom by an “off-axis perspective projection” algorithm that updates the projection of the entire VR classroom based on the tracked subject’s position [8]. The subject is tracked by isolating infrared depth measures corresponding to the subject’s torso. Two snapshots of the VR classroom and its interior are shown in Fig. 1. To keep subjects motivated and accelerate their progress, a challenging environment was created. These challenges have been simulated as distractions in the VR classroom, split into auditory- (e.g. cars passing outside, ambient classroom noise of children talking, pencil dropping and chairs moving) and visual distractions (e.g. people entering and exiting the classroom, and fan rotating) inspired by [9]. However, these distractions have been disabled in the current study, and are intended for training protocols on ADHD subjects. Two games were designed to run on the projection screen inside the VR classroom. The games were designed to challenge the sustained visual attention and visual discrimination,
3606
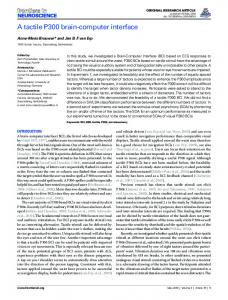
(a)
(b)
Fig. 1. Two screenshots of the VR classroom scene. (a) View from the back of the VR classroom. A NISPELL is running on the projection screen while a construction worker enters (visual distraction). (b) A side view of the VR classroom where both windows are visible, as well as a small portion of the bookshelf.
abilities that are hard for ADHD subjects [10]. The first game, namely the A NISPELL is a variant of the famous Farwell and Donchin’s P300 speller [11]. A 4 × 4 grid of neutral animal pictures was presented in grayscale with black background. A row or column of pictures were flashed-up (in a pseudorandom fashion), by displaying the true colors with a white background (Fig. 2). An inter-stimulus interval (ISI) of 200 ms was used. The subject was asked to attend a specific animal for the entire trial, and locate the most dominant color, a unique color which could be a small area with manually changed pixel values, and answer a third question that was specified after the trial.
(a)
(b)
Fig. 3. Illustration of two out of the twelve images presented during the attention game, T- SEARCH. The images were shown one at a time with a frequency of five images each second, repeated ten times. The subject was asked to locate any blue colored “T” symbol presented in the images.
scoring system to create a competitive game between the subjects.
Fig. 2. A close-up of the attention game, A NISPELL. It consists of 16 animal images in a 4 × 4 grid. An entire row or column is flashed-up in a pseudorandom sequence displaying the true color of the animals with white background. The subjects’ were asked to pay attention to a specific animal, and answer questions related to the animal at the end of a trial
The second game called the T- SEARCH was designed with inspiration from Frintrop et al. [5]. Twelve different images were shown randomly one at a time with an ISI of 200 ms containing several English letters “X” and “T”. Two example images are displayed in Fig. 3. The images were repeated, pseudorandomly, ten times. In rare occasions an image containing a blue “T” was displayed where the user was instructed to remember the position. At the end of a trial, the user had to select, in a compartmentalized square, where the blue “T” letters were located. The points from the questions that were correctly answered in the two games, together with points if the P300 was present at the correct times, were used in a cumulative
B. Experimental Setup Five healthy young subjects participated in the preliminary experiment to test the developed prototype system. The EEG recordings were done using four electrodes. The unipolar reference electrode was placed at the left earlobe, a ground electrode at Fpz, an electrooculography (EOG) electrode below the left eye, and a measurement electrode at Pz. These positions were in accordance with the 10-20 international standard of EEG electrode placement. The electrodes were all attached to the G TEC bio-amplifier (G.USBamp). The signals were band-pass (0.5 − 30 Hz) filtered with an 8th-order Butterworth filter, and digitized at 256 Hz. The amplifier was connected with a computer responsible for collecting and further filtering the EEG signal. The filtering included a moving average (cut-off frequency of 12.8 Hz) and a Recursive Least Squares (RLS) algorithm [12], to remove head- and eye movements, respectively. Another computer was running the VR setup, with a UDP connection used to communicate between the two computers. Fig. 4 illustrates the setup with the VR interface that was presented to the subject. The subjects reported no discomfort with the tasks as well as mounting of the electrodes. They reported that the questions and competition element made it motivating to stay engaged during the entire recording session. C. Classifier The preprocessed signal was divided into epochs each representing 700 ms (179 samples) of the data right after
3607
with the zero-mean and unit variance version of sm = T [sm,1 , sm,2 , . . . , sm,N ] , and st (column vector representing the template epoch). Weighted Euclidean: A weighted Euclidean distance mea12 sure between the epochs and the template, denoted as fm in (4): N X √ 12 fm = k D · (sm − st )k ; wn = 1, (4) n=1
Fig. 4. Illustration of the experimental setup. G.USBamp is seen on the table with the attached EEG electrodes. The Kinect situated below the interface screen is turned on and tracking the subject (who is looking slightly to the left). The tracked area is visualized in the left screen as the red area, with the ceiling and the person taking a photo is colored gray representing ignored depth value measurements.
the stimulus onset. Five epochs representing identical stimuli were then averaged together. The subjects’ P300 duration from onset to ending (P300 area) was established through a permutation test using the paired t-test statistics, and corrected for the multiple comparisons problem by the tmax method described in Groppe et al. [13]. The null hypothesis defined, the P300 epochs subtracted from the non-P300 epochs, to have a mean value of zero and was tested against the two-sided alternative hypothesis that the mean value was different from zero. The type I error tolerance was set at 5%. A total of 24 features was extracted from the averaged epochs. The features cover temporal shape information, and (dis)similarity information that were produced by comparing the averaged epochs with a template. The template was an average response generated during two initial runs where the user had to count the number of flashes. Two features of each category are presented below: Standard fraction: The ratio between the standard deviations 3 in the P300 area (tp ) and baseline (tb ), denoted as fm in (1): 1/2 P tp (Tp ) 2 1 n=t (1) (sm,n − µm (tp )) T 3 , (1) fm = p 1 PTbp 2 (s − µ (t )) m,n m b n=1 Tb where sm,n is the n’th sample point in the m’th epoch. Tp and Tb are the number of samples respectively in tp and tb , and µm (·) is the corresponding mean value of epoch m. Triangle area: The area of a triangle within the P300 area, 23 denoted as fm in (2). The points in the area were found by the maximum value (x2 , y2 ) and the minimum value to the left- (x1 , y1 ) and to the right- (x3 , y3 ) of the maximum. x1 y1 1 1 23 (2) fm = x2 y2 1 , 2 x3 y3 1 where | · | denotes the determinant. Pearson correlation: A measure of the linear relationship between the epochs and the template. It is calculated using 9 (3), and is denoted as fm : 9 fm =
sTm st , N −1
(3)
where D = diag (w1 , w2 , . . . , wN ) is an N × N diagonal matrix with the elements representing the weighting of the sample points (the tp interval was weighted four times as large). The extracted features were used with a subject specific Gaussian kernel-based support vector machine (SVM) classifier. This classifier was chosen due to its stability, low variance and generalization property [14]. The classifier has two variables (σ, C) controlling respectively the degree of non-linearity and the tolerance towards false classification during training. An optimization of these variables was performed, through a 3-fold cross-validation (CV), by the Pattern Search algorithm (with 10 different starting points) included in the Global Optimization Toolbox in M ATLAB. The optimization was done together with a forward sequential search algorithm (fSSA), to find the best feature combination. The performance criterion for the CV was chosen as the φ coefficient; a value of φ = 1 indicates a perfect prediction, φ = 0 represents random prediction, and φ = −1, a complete mismatch [15]. The feature with the highest-averaged φ value from the CV test-set was kept, and a new round with two features was run. This was continued until the performance in the averaged CV test-set saturated. Prior to training the classifier, 25% of the feature samples were separated as a performance-set to evaluate the classifier on unknown samples, assisted with a receiver operating characteristic (ROC) analysis that contains the area under the curve (AUC), sensitivity (SE), and specificity (SP). III. RESULTS AND DISCUSSION The results from the five test subjects are presented in Table I. The P300 area, depicted by the tmax based permutation method (first row, Table I), was on average 174 (±65) ms long with an onset after 386 (±36) ms. It was detected on all subjects with subject 1 achieving the smallest averaged statistical significance (t(1, 9) = 5.78, p < 0.0153), while subject 4 achieved the largest (t(1, 9) = 17.31, p < 0.0022). The only difference with the literature was a slightly delayed onset. The delay was software based due to the trigger point in the EEG signal being placed right before M ATLAB initiated the stimuli. The ability to detect the P300 response, achieved at best 23.33% error (subject 4) with an average of 29.33 (±4.94) % error. The φ coefficient along with the AUC, SE, and SP values all displayed a detection ability superior to random guessing. Better performance results are seen in the literature but our results suffer from the non-intrusive children friendly setup using a single classification electrode (Pz), five
3608
TABLE I A TABLE WITH RESULTS FROM THE A NI S PELL RECORDINGS ON THE PERFORMANCE - SET. T OTAL GAME SCORE (TGS) REPRESENTS THE
ACKNOWLEDGMENT The authors would like to thank MD. T.W. Kjaer and Assoc. Prof. C. E. Thomsen for their valuable suggestions and inputs during the course of this work. The authors acknowledge the numerous interesting discussions they had with Ph.D. students M. Ordikhani-Seyedlar and A. Vilic. Thanks goes to B.Sc.(CS) M. H. Erichsen for introducing the authors to the domain of computer science where the idea behind the infrared camera came. Lastly, thanks goes to the volunteers who unconditionally and enthusiastically participated in the experiments.
POINTS THE SUBJECTS ACHIEVED DURING THE EXPERIMENTS .
Subject tp (10−2 s) Features φ CV test Def. error (%) Opt. σ Opt. C Opt. error (%) φ AUC SE. SP. TGS
1 38 : 53 [9 16] 0.77 46.66 0.66 17.10 36.66 0.27 0.68 0.53 0.73 80.5
2 44 : 59 [20 24 18 4] 0.66 33.33 1.80 0.59 30.00 0.41 0.77 0.60 0.80 78.5
3 39 : 64 [9 18 13] 0.60 30.00 6.00 1.20 26.67 0.47 0.68 0.67 0.80 85
4 38 : 61 [9 12 5] 0.66 23.33 20.35 11.00 23.33 0.54 0.80 0.80 0.67 79
5 34 : 43 [1 3 24] 0.51 36.67 1.60 1.24 30.00 0.42 0.73 0.87 0.53 87.5
R EFERENCES
averages and no soft score measure (classifies the most likely epoch as the P300 epoch). Therefore, the results are highly encouraging managing an average error rate below 30%. To ensure that attention was paid towards the task only healthy subjects was used. By doing so we successfully demonstrated that the P300 potential can be used as a measure of attention in a gaming environment. Furthermore, we present an approach to how games should be designed and how distractions should be added as an important factor towards improvement through training. Through a scoring system, our system was capable of telling whether the user paid attention to the relative task. The training system can become a future rehabilitation protocol for ADHD children, but needs redesign for several aspects. The error rate has to be lower to provide reliable feedback to the user. A high error rate will negate a possible 9 rehabilitation. The fm feature was proven superior since it was selected frequently as the best feature to discriminate P300 epochs from non-P300 epochs. As a template-based feature, this can prove cumbersome in a future training protocol for ADHD subjects due to changes in the P300 response as they improve attention [16]. IV. CONCLUSIONS By demonstrating the efficacy of the proposed prototype system, we hope to encourage the neurofeedback community to include their BCI systems with interactive settings, competitive games, and the use of the P300 potential when aimed at ADHD treatment for children. With cheap hardware and a simple “off-axis perspective projection” algorithm, an affordable portable interactive environment was achieved, with added visual and auditory distractions that can easily be used directly at schools, institutions or at private homes. The setup will require minimal instructions for the school- or after-school care personnel and we envision that the training games would be an integrated part for children with ADHD, just as medication is an integrated part in our present day life.
[1] M. D. Rapport and C. Moffitt, “Attention deficit/hyperactivity disorder and methylphenidate: a review of height/weight, cardiovascular, and somatic complaint side effects” Clin. psychology review, vol. 22, no. 8, pp. 1107–1131, 2002. [2] J. J. Daly, and J. R. Wolpaw, “Brain-computer interface in neurological rehabilitation” The Lancet Neurology, vol. 7, no. 11, pp. 1032–1043, 2008. [3] J. F. Lubar, “Discourse on the development of eeg diagnostics and biofeedback for attention-deficit/hyperactivity disorders” Biofeedback and Self-regulation, vol. 16, no. 3, pp. 201–225, 1991 [4] M. E. Toplak, L. Connors, J. Shuster, B. Knezevic, S. Parks, “Review of cognitive, cognitive-behavioral, and neural-based interventions for attention-deficit/hyperactivity disorder (adhd)” Clinical Psychology Review, vol. 28, no. 5, pp.801–823, 2008. [5] S. Frintrop, E. Rome, and H. I. Christensen, “Computational visual attention systems and their cognitive foundations: A survey” ACM Transactions on Applied Perception (TAP), vol. 7, no. 1, pp. 1-46, 2010. [6] J. Himelstein, J. Newcorn, and J. Halperin, “The neurobiology of attention-deficit hyperactivity disorder” Front. Biosci., vol. 5, pp. 461– 478, 2000 [7] D. Emanuel, W. Ritter, and C. W. Mccallum, “The endogenous components of the erp” Event-related brain potentials in man, pp. 349-411, 1978. [8] R. Kooima, “Generalized perspective projection” School of Elect. Eng. and Computer Science, pp. 1-7, 2008. [9] M. T. Schultheis and A. A. Rizzo, “The application of virtual reality technology in rehabilitation” Rehabil. Psychology, vol. 46, no. 3, pp. 296-311, 2001. [10] L. A. Kurtz, Visual perception problems in children with AD/HD, autism, and other learning disabilities: a guide for parents and professionals. Jessica Kingsley Publishers, 2006. [11] L. A. Farwell and E. Donchin, “Talking off the top of your head: toward a mental prosthesis utilizing event-related brain potentials” Electroence. and clin. Neurophys., vol. 70, no. 6, pp. 510-523, 1988. [12] P. He, G. Wilson, and C. Russell, “Removal of ocular artifacts from electro-encephalogram by adaptive filtering,” Med. and biological eng. and computing, vol. 42, no. 3, pp. 407-412, 2004. [13] D. M. Groppe, T. P. Urbach, and M. Kutas, “Mass univariate analysis of event-related brain potentials/fields i: A critical tutorial review” Psychophysiology, vol. 48, no. 12, pp. 1711-1725, 2011. [14] F. Lotte, M. Congedo, A. Lecuyer, F. Lamarche, B. Arnaldi et al., “A review of classification algorithms for eeg-based braincomputer interfaces” Journal of neural eng., vol. 4, pp. 1-24, 2007. [15] B. W. Matthews, “Comparison of the predicted and observed secondary structure of t4 phage lysozyme” Biochimica et Biophysica Acta (BBA)- Protein Structure, vol. 405, no. 2, pp. 442-451, 1975. [16] R. J. Barry, S. J. Johnstone, and A. R. Clarke, “A review of electrophysiology in attention-deficit/hyperactivity disorder: Ii. event-related potentials” Clin. Neurophysiology, vol. 114, no. 2, pp. 184-198, 2003
3609