International Journal of Computer Applications (0975 â 8887). Volume 87 â No.18, February 2014. 8. Brain Tumor Detection, Demarcation and Quantification.
International Journal of Computer Applications (0975 – 8887) Volume 87 – No.18, February 2014
Brain Tumor Detection, Demarcation and Quantification via MRI Navneet Kaur[1]
Mamta Juneja[2], Ph. D
M.E., C.S.E., U.I.E.T., P.U., CHD, India.
Assistant Professor., C.S.E.,U.I.E.T., P.U., CHD, India.
ABSTRACT Under the scope of this paper an algorithm has been developed which takes the gradient differential as main criteria for identification of the brain tumor. The algorithm also tries to skip the areas of brain which do not suits the criteria of high intensity and high entropy as these are the main two characteristics of tumor area. Finally, the image is reconstructed using extended maxima transformation and regional maxima are found, and finally we get the most susceptible part of tumor. The results have shown that the algorithm takes only 3.98 seconds on an average to identify the tumor and has good accuracy in terms of identification of tumor.
Keywords Tumor, MRI, boundary, image model, and extended maxima transform.
1. INTRODUCTION A mass of tissue that does originate by a gradual growth of abnormal cells is called a tumor. Usually, in our body the cells get aged, dies and then they are replaced by newly born cells. But in the case of cancers and tumors, this cycle gets interrupt which leads to their formation. Tumor cells are those cells that grow, even though when the body does not requires them, and moreover as normal old cells, they do not expire. Now in the prolongation of this process, the tumor keeps on adding more and more tissues to the mass which grows up into a cyst. Tumors has been basically categorize into primary and secondary tumors. When the tumors emanate from the tissues of the brain itself are said to be primary tumors. Secondary brain tumors are those tumors that are caused from cancer that arises from another part of the body. Brain tumors have been further categorized into benign primary tumors which are noncancerous and malignant primary brain tumors that are cancerous. Benign brain tumors could be easily recognizable as they have clear borders around them and are not intensely rooted into the brain tissue. A malignant brain tumor ordinarily grows faster than benign tumors and intrusively violates the enclosing tissues boundary. Our research paper “Brain Tumor Detection, Demarcation & Quantification via MRI” also discusses about the detection of tumor in human brain and the calculation of the area that tumor possesses but with a more capable technique. Brain tumor detection is really a burdensome assignment as it involves full automation in it. The machine has to identify, mark and quantify the tumor portion as canonical as a human vision can discern. The detection of benign brain tumor is an effortless task because it has a natural border around it and does not have deep intense roots as of malignant tumor. When MRI is done the system develops many image slices of a single brain, and if the tumor is benign in nature it will be seen through some of the slices
only as benign tumors do not go to the deeper part of the brain. So, this would help us in discriminating the two types of brain tumors. Probably, to identify the tumor we even need to study some paramount properties of the MRI image which would help us in differentiating the abnormality from normal part in an MRI image of brain.
2. RELATED WORK Tumor segmentation from magnetic resonance (MR) images may aid in tumor treatment by tracking the progress of tumor growth and/or shrinkage. Nobuyuki Otsua [1]has presented a nonparametric and unsupervised method of automatic threshold selection for picture segmentation. Michael R. Kaus et.al [2] had proposed an automated brain tumor segmentation method was validated against manual segmentation with three-dimensional magnetic resonance images. Lynn M. Fletcher-Heath et.al [3] in their paper has presented the automatic segmentation method which separates nonenhancing brain tumors from healthy tissues in MR images to aid in the task of tracking tumor size over time. Alain Pitiot et.al [4] presented a fully automated segmentation method for medical images. Djamal Boukerroui et.al [5] proposed a robust adaptive region segmentation algorithm for noisy images, within a Bayesian framework. Kristin R. Swanson et.al [6] reviewed some of the recent developments in mathematical modeling of gliomas in this article. Yuri Boykov et.al [7] proposed minimum cut/maximum flow algorithms on graphs emerged as an increasingly useful tool for exact or approximate energy minimization in low-level vision. Stuart S. C. Burnett et.al [8] developed a deformabletemplate algorithm for the semiautomatic delineation of normal tissue structures on computed tomography images. Weibei Dou et.al [9] proposed a framework of fuzzy information fusion in this paper to automatically segment tumor areas of human brain from multispectral magnetic resonance imaging (MRI) such as T1-weighted, T2-weighted and proton density (PD) images. Kyungsuk (Peter) Pyun et.al [10] has developed a multiclass image segmentation method using hidden Markov Gauss mixture models (HMGMMs) and provide examples of segmentation of aerial images and textures. Hassan Khotanlou et.al [11] has presented a new general method for segmenting brain tumors in 3D magnetic resonance images. Under the scope of this paper the basic features of tumors demarcation such as texture information have not been taken into consideration while designing the algorithm. Jason J. Corso et.al [12] presented a new method for automatic segmentation of heterogeneous image data that takes a step toward bridging the gap between bottom-up affinity-based segmentation methods and top-down generative model based approaches. T. Logeswari et.al [13] in their paper had described a segmentation method consisting of two phases. Sufyan Y. Ababneh et.al [14] has proposed a new,
8
International Journal of Computer Applications (0975 – 8887) Volume 87 – No.18, February 2014 fully automated, content-based system is proposed for knee bone segmentation from magnetic resonance images (MRI). P. Narendran et.al [15] tried to segment brain tumors, their components (edema and necrosis) and internal structures of the brain in 3D MR images. Sudipta Roy et.al [16] in their work introduced a fully automatic algorithm to detect brain tumors by using symmetry analysis. Mukesh Kumar et. Al [17] used the texture analysis and seeded region growing method which is based on texture of the MRI. Although the author tried to minimize the total execution time of this
method but still it takes minimum more than 8 seconds to provide its results.
Step 1: Read and convert the input image from RGB to grey scale image: An image or digital image is just a data arranged in a form of matrix. It has numbers as data which demonstrates red, green, and blue and theirs modifications at a peculiar location. An image is read by using imread
command. However this command is used to read image from graphics file. Now we need to convert a colored image into a grayscale image. For this conversion we have 2 basic methods. First is Average method and another one is weighted method or luminosity method. Average method is the simplest
3. PROPOSED WORK In this paper the proposed algorithm has been designed by combining the image model technique, extended maxima transformation and regional maxima transformation.
9
International Journal of Computer Applications (0975 – 8887) Volume 87 – No.18, February 2014 one as we take just the average of three colors (Red, Green and Blue). Grayscale image = (R + G + B / 3) But due to this type of conversion the image turned out to black image. These problems arise due to the average of the red, green and blue colors and these colors have 3 different wavelengths so they contribute in their own way while forming an image. The solution to this has been given by luminosity method. As we are aware of the fact that the wavelength of color red is more than other 2 components, another color green gives to the eyes a soothing effect and moreover it’s values of the wavelength is less than that of red color. Which means that we need to decrease the significance of red color, and enhance the contribution of the green color, and set the range of blue between these two. Now new equation formed will be: New Grayscale image = ((0.3 * R) + (0.59 * G) + (0.11 * B)). Accordingly the Red has contributed 33%, Green is 59% (> red and blue colors) and Blue is just 11%. Step 2: Preprocessing steps: First of all we’ll apply median filter for noise removal or noise suppression which is a critical responsibility in our research work. Due to its property of preservation of the edges during smoothing this denoising method had helped in retaining the information. It is a nonlinear operator as the pixels are arranged in a local window in accordance to their intensity values and finally replacing the value of the pixel in the result image by the middle value in this order. Step 3: Grayscale contrast enhancement: Till date, the process of contrast enhancement technique plays a critical role in enriching medical images’ quality. Several previous studies proved that contrast enhancement techniques capable to clean up the unwanted noises and enhance the images’ brightness and contrast [18][19][20]. Thus the resulting improved medical images provide clearer and cleaner images for better and easier disease screening process by doctor. Function imadjust of matlab has been used for contrast enhancement in this paper which does the intensity transformation in grayscale images. The function imadjust is a matlab function that creates gamma transformation. With the help of gamma (γ) transformation we will be able to curve the components of the grayscale towards the brightening up the intensity (if γ < 1) and on the other hand it would darken up the intensity of the pixels (if γ> 1). Gamma is a supreme characteristic for almost entire digital imaging systems. Gamma exemplifies the association of numerical values of pixels and its luminance. If the gamma is left out, the colors grabbed by the cameras would not come out as they normally seen by our eyes (on a standard monitor). This technique could be called as gamma compression, gamma correction or gamma encoding, but basically all these are referred to a congruent theory. Gamma correction can be defined by the following power-law expression: Vout = AVinγ
(1)
where A is a constant. Step 4: Divide image into 4 equal quadrants and calculate max and min values of pixels in each quadrant:Now we are dividing an MRI image into 4 equal quadrants and evaluating the 2 basic properties i.e. entropy and intensity for each window individually. The division has been done due to the
purpose that rather than working on whole image we will be fully focused on that quadrant that is the most suspected to have the tumor. The entropy could be explained in the following way: etp = - sum(p.*log2(p))
(2)
where p contains the histogram counts returned from imhist. Intensity adjustment is an image enhancement technique that maps an image's intensity values to a new range. Step 5: Build matrix for intensity and entropy for analysis and pick the quadrant having max values of intensity and entropy: Next step is to build the matrix for the values of intensity and entropy so that we can select the quadrant which we need to work on and ignoring all other quadrants except the one having maximum values of intensity and entropy. The quadrant which possesses highest values of entropy and intensity is now found, since these two parameters of tumor portion are always maximum in the image as compared to other parts of the image. Step 6: Calculate temporal lower bound of threshold & using upper and lower bound threshold to the target quadrant: A temporal lower bound threshold is applicable to general image observation models involving degradations of blur, signaldependent and signal-independent noise, and sensor nonlinearity is derived. Lower bound on average mean-square errors for any unbiased image restoration scheme is derived. This bound is analytically expressed as a function of degradation parameters of imaging systems. Now we will apply the calculated values of upper and lower bound threshold onto the targeted quadrant. Step 7: Apply extended maxima transformation, regional maxima transformation: Now, we apply these transformations in which we get the maximum (plural: maxima) of a function (intensity range that represents the tumor), known collectively as extrema (singular: extremum), and thus we get the largest value of intensity represented as function, which takes at a point either within a given neighborhood quadrant (local or relative extremum) or on the function domain (image under observation) in its entirety (global or absolute extremum) and finally the application of regional maxima, which are nothing but the connected components of pixels with a constant intensity value, and whose external boundary pixels all have a lower value which do not represent the tumor part , all these transformation are applied based on the image model of the test image under observation . Step 8: Run region properties: We are aware of this fact that we need to know about the properties of a particular connected component (or say object)in order to identify it. In context with this paper, the major task is to detect the tumor present in human brain which is considered as a connected component. Now to verify that whether it’s a tumor or not we would apply regionprops command of matlab over that portion to verify its identity. We are also concerned with the solidity (also known as convexity) property of the region. Solidity is the ratio of an area of an object and some other enclosing container. The solidity property of the region specifies the proportion of the pixels which are in the region also in the convex hull. This property supports only 2-D input label matrices. It could be computed as area or convex area. Solidity is bit tough, but probably a good distinguisher of cells with projections or uneven shape v/s round cells generally within the region (intensity and entropy are also high).
10
International Journal of Computer Applications (0975 – 8887) Volume 87 – No.18, February 2014 Step 9: Mark the boundary around the area which matches to the max profile: Under this step the boundary around detected tumor portion is been built up so that the tumor could be clearly visible and differentiated by the viewer.
Step 10: Count the pixels that lie within the boundary: Finally the tumor portion has been detected and demarcated and now it has to be quantified by counting the no. of pixels that lies within that bordered portion which specifies tumor area.
4. RESULTS AND ANALYSIS
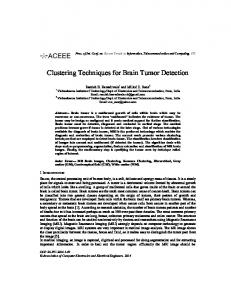
Fig 1. Snapshots of results
Table 1: RESULTS OF 5 DIFFERENT CASES Image name
Image size
Tumor size
Execution time
(in pixels)
(in sec)
brainimg1
200 X 200
62002
2.342
brainimg2
200 X 200
262145
3.099
brainimg3
200 X 200
66565
2.477
brainimg4
200 X 200
122501
2.984
brainimg5
200 X 200
50626
2.109
5. CONCLUSION AND FUTURE SCOPE After looking into the results it could be said that the proposed method is better than the previous one as it has been found that the execution time has been reduced. Moreover rather than looking into the whole image for the pixels showing tumor the proposed algorithm is searching in just the quadrant where the possibility is highest by using entropy, intensity and solidity matrix and transforming the image. This way the computation also has been lessening up. For future scope, it could be suggested that one can take advantage of machine learning non-parameterized algorithms that uses regression decision tree to arrive at the classification of objects like tumor and non-tumor parts.
6. REFERENCES
[3] Lynn M. Fletcher-Heath, Lawrence O. Halla, Dmitry B. Goldgofa, F. Reed Murtagh, “Automatic segmentation of non-enhancing brain tumors in magnetic resonance images” Artificial Intelligence in Medicine 21: 43-63, Elsevier Science B.V., 2001. [4] Alain Pitiot, A.W. Toga, P.M. Thompson, “Adaptive elastic segmentation of brain MRI via shape-modelguided evolutionary programming” IEEE Transactions on Medical Imaging, Vol.: 21, Issue: 8, Aug. 2002. [5] DjamalBoukerroui, AtillaBaskurt,J.Alison Noble, Olivier Basset, “Segmentation of ultrasound images–– multiresolution 2D and 3D algorithm based on global and local statistics” Elsevier Science B.V,Vol. 24, Issues 4–5, February 2003.
[1] Nobuyuki Otsu, “A Threshold Selection Method from Gray-Level Histograms”, IEEE Transactions on systems, Man, and Cybernetics, Vol. SMC-9, No. 1, January 1979.
[6] Kristin R. Swanson, Carly Bridge, J.D. Murray, Ellsworth C. Alvord Jr, “Virtual and real brain tumors: using mathematical modeling to quantify glioma growth and invasion” Elsevier B.V,Vol. 216, Issue 1, 15 December 2003.
[2] Michael R. Kaus, Simon K. Warfield, Arya Nabavi, Peter M. Black, Ferenc A. Jolesz, Ron Kikinis, “Automated Segmentation of MR Images of Brain Tumors” Radiology; 218:586–591, Magnetic resonance (MR), Volume measurement, 10.121412, 10.12143, 2001.
[7] Yuri Boykov, Vladimir Kolmogorov, “An Experimental Comparison of Min-Cut/Max-Flow Algorithms for Energy Minimization in Vision” IEEE Transactions on Pattern Analysis and Machine Intelligence, Vol. 26, No. 9, September 2004.
11
International Journal of Computer Applications (0975 – 8887) Volume 87 – No.18, February 2014 [8] Stuart S. C. Burnett, George Starkschall, Craig W. Stevens,Zhongxing Liao, “A deformable-model approach to semi-automatic segmentation of CT images demonstrated by application to the spinal canal” The International Journal of Medical Physics Research and Practice, Medical Physics 31, 251 (2004), 22 January 2004. [9] Weibei Dou, Su Ruan, Yanping Chen, Daniel Bloyet, Jean-Marc Constans, “A framework of fuzzy information fusion for the segmentation of brain tumor tissues on MR images” Elsevier B.V,Vol. 25, Issue 2, 2006. [10] Kyungsuk (Peter) Pyun, Johan Lim, Chee Sun Won, Robert M. Gray, “Image Segmentation Using Hidden Markov Gauss Mixture Models” IEEE Transactions on Image Processing, Vol. 16, No. 7, July 2007. [11] Hassan Khotanlou, Olivier Colliot, Isabelle Bloch “Automatic brain tumor segmentation using symmetry analysis and deformable models” Bu Ali Sina University and Paristechile de France, 2008. [12] Jason J. Corso, Eitan Sharon, ShishirDube, Suzie ElSaden, Usha Sinha, Alan Yuille, “Efficient Multilevel Brain Tumor Segmentation With Integrated Bayesian Model Classification” IEEE Transactions on Medical Imaging, Vol. 27, No. 5, May 2008. [13] T. Logeswari, M. Karnan, “An improved implementation of brain tumor detection using segmentation based on soft computing” Journal of Cancer Research and Experimental Oncology Vol. 2(1) pp. 006-014, March, 2010. [14] Sufyan Y. Ababneh, Jeff W. Prescott, Metin N. Gurcan, “Automatic graph-cut based segmentation of bones from
IJCATM : www.ijcaonline.org
knee magnetic resonance images for osteoarthritis research” Elsevier B.V.,Vol. 15, Issue 4, August 2011. [15] P. Narendran, Mr. V.K. Narendira Kumar, Dr. K. Somasundaram, “3D Brain Tumors and Internal Brain Structures Segmentation in MR Images” I.J. Image, Graphics and Signal Processing, 1, 35-43, February 2012. [16] Sudipta Roy, Samir K. Bandyopadhyay “Detection and Quantification of Brain Tumor from MRI of Brain and it’s Symmetric Analysis” International Journal of Information and Communication Technology Research, Vol. 2 No. 6, June 2012. [17] Mukesh Kumar, Kamal K.Mehta “A Texture based Tumor detection and automatic Segmentation using Seeded Region Growing Method” International Journal of Computer Technology and Applications,Vol 2 (4), 855-859, August 2011. [18]
Ngah, U. K., Ooi, T. H., Sulaiman, S. N. &Venkatachalam, P. A. (2002). Embedded Enhancement Image Processing Techniques on A Demarcated Seed Based Grown Region. Proc. of Kuala Lumpur Int. Conf. on Biomedical Engineering. 170-172.
[19] Lim, E. E., Venkatachalam, P. A., Ngah, U. K. & Khalid, N. E. A. (1999). “Liver Disease Diagnosis by Region Growing”. Proceedings of International Conference on Robotics, Vision and Parallel Processing for Automation. 1. 38-45. [20] Khalid, N. E. A., Venkatachalam, P. A. & Ngah, U. K. (1999). “Diagnosis of Bone Lesion Based on Histogram Equalization". Proceedings of International Conference on Robotics, Vision and Parallel Processing for Automation. 1. 91-96.
12