Key words: Brain waves; Music and sleeping patterns. 1. ... power of music such as reading and literacy skills, .... cleaned with a dirt remover gel to enhance the.
Journal of Scientific Research and Development 2 (13): 139-146, 2015 Available online at www.jsrad.org ISSN 1115-7569 © 2015 JSRAD
Brainwaves patterns based on musical preference and sleeping patterns Isable Joshua *, Norsiah Fauzan
University of Malaysia Sarawak, Department of Cognitive Sciences, Faculty of Cognitive Sciences and Human Development, 94300, Sarawak, Malaysia Abstract: Music is one of the few activities that involve the use of the whole brain. It is intrinsic to all cultures and has surprising benefits not only for learning language, improving memory and focusing attention, but also for physical coordination and development. Objective: This research aims to compare the sleeping patterns between male and female respondents from both musical and non-musical background in relation to the brainwave patterns based on their musical preferences using quantitative electroencephalogram (qEEG). The findings showed that the participants of Evening Type sleeping pattern with music preferences towards Upbeat and Conventional factor (e.g. country, gospel, oldies, pop, religious and soundtracks. Conclusion: Delta wave is dominant at the frontal cortex during the music listening tasks. On the other hand, comparing frequency bands to that of gender, female undergraduates had higher Beta wave as compared to males. Moreover, the most prominent sleeping pattern was identified among the 8 subjects). Key words: Brain waves; Music and sleeping patterns
1. Introduction
*Music is known as a universal cross-cultural language, found in every human culture in this world. The common use of music in current society is purely for pleasure and enjoyment, another use is the music’s ability itself in inducing physical movement and dance. Moreover, most individuals particularly adolescents use music for mood regulation, reducing loneliness and as a means of defining social identity by listening to music that peers listen to in order to mold personal musical tastes and preferences (Guglor-Rudan, and Tarnai, 2012). From the perspective of Neuroscience, listening to music is one of the most complex things a person can do. Many parts of the brain have to work together in order to comprehend even the simplest tune. Music is one of the few activities that involve the use of the whole brain. It is intrinsic to all cultures and has surprising benefits not only for learning language, improving memory and focusing attention, but also for physical coordination and development. However, not all types of music have favorable effects. Music can be distracting if it's too loud or too jarring, or if it competes to get the person’s attention (Takacs and Bodizs, 2008). Music is sometimes given a quick classification as a ‘right-brained’ activity in which the act of processing music is centered on the right hemisphere of the brain. Brain imaging studies have shown that ‘happy’ music caused the production of the chemical dopamine that had stimulated the *
Corresponding Author.
139
reward centers of the brain, which is the same chemical released when eating great food. Some of the higher brain functions can be enhanced by the power of music such as reading and literacy skills, spatial-temporal reasoning, mathematical abilities and emotional abilities. A person can learn well just by listening to music or playing an instrument. Each individual demonstrates different preferences towards music. Certain music is able to eliminate fatigue symptoms caused by monotonous work in order to uplift the mood and provide extra energy. However, listening to too much of pop and hard music can make a person more jittery than energized. Thus, it is vital to find out the suitable and most preferable type of music to listen to. The most relaxing music to listen to would be classical music that has been known some time to beat people who are suffering from insomnia. Listening to relaxing music especially before bedtime can make a restful night by reducing sympathetic nervous system activity, decreases anxiety, blood pressure, heart and respiratory rate which produces positive impact on sleep through muscle relaxation (McCraty et al., 1998). Differentiating music genre can sometimes be difficult as certain music can have the possible mixture of more than one genre resulting in a very large list. However, all of these music genres which consist of 13 musical style such as Classical music, Rock music, Blues, Jazz, Electronic, Folk, Country, R&B, Hip hop, Ska & Reggae, Latino music, World Music and New Age have been categorized into Mellow/relaxing, Urban/danceable,
Isable Joshua, Norsiah Fauzan / Journal of Scientific Research and Development, 2 (13) 2015, Pages: 139-146
Sophisticated/aesthetic, Intense/aggressive and Campestral/sincere based on the 5 factor MUSIC model created by (Rentfrow et al., 2011).
their effect on student adjustment, academic performance and health are underrepresented in the literature. Such studies have consistently demonstrated that large proportions of students suffer from some form of sleep difficulties, yet the full impact of these sleep difficulties is currently unknown (Buboltz et al., 2001). Thus, the goal of this research is to broaden the understanding on whether different music styles have an impact on the sleep patterns among undergraduate students.
1.1. Background of study
The purpose of this study is to compare the brainwave pattern of subjects from musical and nonmusical background based on gender. The intention is to gather details to compare the different brainwave pattern between male and female respondents and to discover the ultimate music preference that is suitable for most undergraduates. Besides that, this research aims to find out the prominent sleeping pattern as well.
3. Research design
A quantitative method was used to compare the brainwave pattern of music preference and the sleeping pattern between male and females. Quantitative electroencephalograph (QEEG) was used to record the brainwaves of the subjects for the research while listening to the music and tasks given by the researcher.
1.2. Problem statement
Most previous researches have been carried out investigating the different types of music and in the field of sleep quality respectively. These researches were carried out before bedtime and the tasks involved listening to 45 minute length of music. Hence, once the most preferred music style has been identified, the answer to the problem will be much clearer to see if there exists a relationship between students sleep pattern and music preference.
3.1. Selection of subjects
In this study, 8 respondents of undergraduates were chosen between 22 to 24 years of age with a mix of gender and races. 4 male and 4 female respondents of which 2 of them have musical training background and the other 2 have no musical training background respectively for each gender were chosen to participate voluntarily in this research. These respondents were picked from the Faculty of Cognitive Sciences & Human Development of University Malaysia Sarawak.
1.3. Research questions
1) What is the difference between brainwave pattern of subjects from musical and non-musical background based on gender? 2) What is the ultimate music preference that is suitable for most undergraduate students to listen to? 3) What is the prominent sleeping pattern for the majority of undergraduates
3.2. Material or instruments used
3.2.1. Short test on music preference (STOMP)
1.4. Objective of study 1.4.1. Main 0bjective
The goal of this study is to compare the brainwave pattern of subjects from musical and nonmusical background based on gender 1.4.2. Specific objective
I. To discover the ultimate music preference that is suitable for most undergraduate students. II. To find out the prominent sleeping pattern for most undergraduate students. 2. Overview of present research
Past researches on differences in music preferences focuses mainly on genres but genres are limited in several ways. Hence, a more reliable assessment of music preferences was created based on the five factor of MUSIC Model (Rentfrow et al., 2011). Clearly, student sleep habits and patterns and
140
This instrument is the first comprehensive measure of music preferences that consist of a 23item measure based on a Likert-scale ranging from one to seven; 1 being strongly dislike, 4 neither like nor dislike, and 7 strongly like which consist of questionnaire to determine the respondent’s preferred music style. After completing the questionnaire, the participants had to rate the following four sound clips including several short excerpts of pieces of music using the same type of response scale. The four sound files are composed as suggested by Rentfrow (2003) and therefore reflect the four dimensions of the STOMP: – Reflective & Complex: “Ride” (Nick Drake), “Fantasy and Fugue in C minor, BWV906” (composed by Johann Sebastian Bach, performed by Glenn Gould), “Stella by Starlight” (Herbie Hancock), “40 Days and 40 Nights” (Muddy Waters), “Time Out” (Dave Brubeck Quartet). – Intense & Rebellious: “Bullet with Butterfly Wings” (Smashing Pumpkins) “Voodoo Child” (Jimi Hendrix), “Fight Song” (Marilyn Manson), “Angel of Death” (Slayer), “Money” (Pink Floyd), “Verse Chorus Verse” (Nirvana).
Isable Joshua, Norsiah Fauzan / Journal of Scientific Research and Development, 2 (13) 2015, Pages: 139-146
– Upbeat & Conventional: “Tell me that I’m Dreaming” (Backstreet Boys), “Come, Now is the Time to Worship” (WOW Worship), “Ready to Run” (Dixie Chicks), “I’m a Slave (4 U)” (Britney Spears). – Energetic & Rhythmic: “It Takes Two” (Rob Base and DJ EZ Rock), “In-Flux” (DJ Shadow), “The Next Episode” (Dr. Dre featuring Nate Dogg and Snoop Dogg), “PickUp the Pieces” (Average White Band), “Roll it Up” (Crystal Method), “Everything is Everything” (Lauryn Hill). 3.2.2. How Music dimensions differ in terms of general attributes?
1) Reflective & Complex: Slower in tempo than other dimensions, use mostly acoustic instruments and very little singing. 2) Intense & Rebellious: Faster in tempo, use mostly electrical instruments and have moderate amount of singing. 3) Upbeat & Conventional: Moderate in tempo, use both acoustic and electrical instruments and have moderate amount of singing. 4) Energetic & Rhythmic: Moderate in tempo, use electrical instruments and have moderate amount of singing. 3.2.3. Electroencephalography acquisitions
(EEG)
data
This research was performed at the Counseling Laboratory, Ground floor, Faculty of Cognitive Sciences and Human Development, University Malaysia Sarawak (UNIMAS). The electroencephalography (EEG) consists of 19 electrode channels with conductive gel connected to the electrode scalp that is attached to the EEG machine, which transmits the brain signals to a computer. The electrode channels are placed on the respondents scalp using the ‘10/20 International System’ guideline. The impedance checker ensures proper connections exist between the electrodes and the scalp with the impedance of all electrodes maintained below 5 kΩ before the procedure begins. The Fig. below illustrates the EEG data acquisition procedure. 3.2.4. Sleep habit questionnaire
Sleep Habit Questionnaire is an 86-item that measures a person’s pattern of sleep. This questionnaire measures a person’s sleeping pattern and classifies it into one of the three main categories that are Morning Type, Neither Type or Evening Type. This questionnaire also consist of one week long sleep log that records the time a person went to bed, fell asleep and woke up. Through this instrument, data collected on demographic and behavioral information including sleep schedule regularity, daytime sleepiness and usual sleeping habits of a person could help identify a person’s sleeping pattern.
The scores from the questionnaire were added together and the sum was converted into a five point Morningness-Eveningness scale: Types of: Sleeping Pattern Score 1) Definitely Morning Type 70-86 2) Moderately Morning Type 59 – 69 3) Neither Type 42 – 58 4) Moderately Evening Type 31 – 41 5) Definitely Evening Type 16 – 30 3.3. Research design procedure
The design procedure was divided into four sections that include Section A: Demographic Information, Section B: Short Test on Music Preferences (STOMP), Section C: qualitative electroencephalography (qEEG) and Section D: Sleep Habit Questionnaire. Firstly, the Short Test on Music Preferences (STOMP) was used as a pre-test questionnaire on the respondents. Next, the EEG is setup on the respondents. The EEG instrument was used to measure the brainwave pattern or activity of the respondents and its electrical signals during the music listening task administered. The Sleep Habit questionnaire was then used as a post-test questionnaire. The data collected from the research procedure was analysed. This research was performed closely to ensure the accuracy and consistency of the EEG data acquisition process. Below are the stages carried out for each respondent? i. Respondent is required to sign the consent form. ii. Respondent sat comfortably and relaxed on a chair with headrest. iii. His/her skin on the forehead and the ear lobes was cleaned with a dirt remover gel to enhance the connectivity. iv. The electrodes with conductive gel were connected on the electrode scalp which is worn by the respondent. The impedance of each electrode is checked. v. The first task – eyes open, respondent were asked to relax and to remain focus on a black dot displayed in front of them. This is to ensure that the brain is in the focus state. Next task – eyes close, respondent were asked to close their eyes and remain relaxed. Hence, the brain would be prepared for the next task and to avoid from distractions such as unwanted artifacts (eye blinking or muscle movements). Constant Alpha wave indicates that the individual is in a relaxed state. vi. Task 3 - Beat ON/OFF, respondent were required to listen to all 11 pairs of short music clips, identify and classify which music clip has the beat in each pair. Task 4 – Group the Music, respondent are supposed to categorize 12 different music clips into groups of 4 based on the music style. vii. The raw EEG signals and brainwave were recorded and stored in the computer for analysis. 141
Isable Joshua, Norsiah Fauzan / Journal of Scientific Research and Development, 2 (13) 2015, Pages: 139-146
3.4. Research analysis The flow diagram of the EEG data analysis is shown in Fig. 3.0 (below). The raw EEG data was classified into four frequency bands : Delta (0.5-4Hz) Theta (4-7Hz) Alpha (8-13Hz) Beta (13-30Hz) The average values from all 8 respondents were calculated and the graphs were plotted based on each frequency bands for each task given. 4. Results and findings
The raw EEG data of 8 subjects were analyzed thoroughly and the results have been classified into 2 groups, respondents that have musical training background and those without musical training background. Coincidently, the results are equally distributed based on gender for both groups.
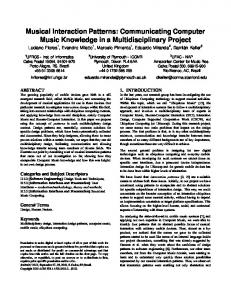
Fig. 1: Average Brainwaves recording values of all frequency bands for Eyes Closed Task
4.1. Eyes closed task
In this task, the Alpha brainwave has the average value of 23.77(uV^2) amplitude which is the highest brainwave recorded as compared to the other brainwaves obtained from all 8 respondents as shown in Fig. 1 (below). High Alpha brainwave activity shows that the respondents are in the state of relaxed mind in which the required procedure of this task has been explained in the above (3.4 Research Design Procedure) section. Fig. 2: Brain topography of all respondents in the Eyes Closed Task
Fig. 3: Average brainwave activities of all respondents across all channel electrodes
Based on Fig. 2 and Fig. 3, it can be seen that the highest Alpha brain activity for all respondents is located at the occipital region, O1 and O2. 4.2. Task 3 – BEAT ON/OFF
142
As shown in Fig. 4 (below), the Delta brainwave has the average value of 33.95(uV^2) amplitude which is the highest brainwave recorded as compared to the other brainwaves obtained from all 8 respondents. The high Delta brainwave activity in this task depicts that all respondents were in the state of decision making that requires them to
Isable Joshua, Norsiah Fauzan / Journal of Scientific Research and Development, 2 (13) 2015, Pages: 139-146
identify and later classify the pairs of music clips based on the beat.
Fig. 5: Brain topography of all respondents in Task 3
Fig. 4: Average brainwaves recording values of all frequency bands for Task 3
Task 3 - Comparison among Gender
Male, Delta , 19.24
Male
Female
Female, Delta , 14.71
Female, Theta , 5.14 Female, Alpha , 3.23 Female, Beta1 , 2.24 Female, Beta2 , 3.66 Male, Theta , 5.27 Male, Alpha , 3.42 Male, Beta2 , 2.20 Male, Beta1 , 2.02
Fig. 6: Comparison of average brainwave values based on gender in Task 3
In Fig. 6 (above), males tend to have higher brain activity than females in 3 out of 4 frequency bands that are Delta, Theta and Alpha wave. However, Beta wave is present more in all females compared to males during this task which can be seen in the brain topography in Fig. 5. After much analysis, it can deduce that there exists a connection between females sleeping pattern and their brain state during the task. Based on the Sleep Habit questionnaire, females tend to be sleep deprived and this causes their mind to have scatty unfocused thoughts and the feelings of anxiousness.
27.81(uV^2) amplitude in this task as well. Much concentration is needed for respondents to think, decided and group the music clips based on the music styles. As shown at the brain topography in Fig. 6, there is high Delta wave present at the frontal cortex on most of the respondents. The result of this task is similar to that of task 3 with Delta brainwave being the highest brainwave activity again. On the other hand, the T4 region is affected in most respondents during this task. This suggests that the emotional memory is evoked based on the type of music that they have listened to.
4.3. Task 4 – Group the Music
Similarly, Delta frequency band has the highest brainwave recorded with the average value of Delta, � Types of Brainwaves, 27.81
TASK 4 - GROUP THE MUSIC
Amplitude (uV^2)
Theta, � Types of Brainwaves, 10.13
Beta 1, � Types of Alpha, � Types of Brainwaves, 3.75 Brainwaves, 7.31
Delta
Theta
Alpha
Beta 1
Beta 2, � Types of Brainwaves, 6.84
Beta 2
Fig. 7: Average Brainwaves recording values of all frequency bands for Task 4. 143
Isable Joshua, Norsiah Fauzan / Journal of Scientific Research and Development, 2 (13) 2015, Pages: 139-146
What is the ultimate music preference that is suitable for most undergraduate students? Based on Fig. 10, males’ music preference were more to Energetic and Rhythmic with the value of 0.82 higher compared to the other music dimensions? Whereas, the music dimension of upbeat and Conventional is the most preferred among females with the value of 0.78. However, with the total average value accumulated from both male and female respondents, the music dimension of Upbeat and Conventional seems to be ultimate music preference among undergraduates. On the other hand, the music dimension of Intense and Rebellious seems to be the least preferred. Fig. 8: Brain topography of all respondents in Task 4.
Fig. 10: 4 Dimensions of Music Preference based on Gender
What is the prominent sleeping pattern for the majority of undergraduates? As shown in Fig. 11, there is equal amount of male and female respondents that are of Evening Type sleeping pattern. Overall, half from the total respondents tend to have the sleeping pattern of Evening Type which tends to be the prominent sleeping pattern and the other half of which 3 respondents are from Morning Type. Out of the 8 respondents, only one female has been identified to be in the sleeping pattern category of Neither Type that has both the characteristics of a Morning and Evening Type sleep pattern.
Fig 9: Comparison of average brainwave values based on gender in Task 4.
Based on Fig. 9 above, Alpha and Beta brainwave average values are higher in females compared to males in this task. The high Beta brainwave activity in females is due to the same reason stated in task 3. Whereas, as for the high Alpha brainwave activity seen in females could be due to the type of music that they have listened. Certain music could evoke calmness and cause their minds to be in a relaxed yet aware state.
Sleep Patterns
Total Participant, Evening Type, 4
Total Participant, Morning Type, 3 Male, Morning Type, 2 Total Participant, Neither Type, 1
Female, Evening Type, 2 Male, Evening Type, 2
Female, Neither Type, 1
Female, Morning Type, 1
Male, Neither Type, 0
Male
Female
Total Participant
Fig. 11: 3 Types of Sleeping Pattern classified based on Gender 144
Isable Joshua, Norsiah Fauzan / Journal of Scientific Research and Development, 2 (13) 2015, Pages: 139-146
Buboltz, W.C., Brown, F., & Soper, B. (2001). Sleep Habits & Patterns of College Students: A Preliminary Study. Journal of American College Health, 50(3), 131-135.
5. Discussions The results from the 3 tasks in this research prove that there is a comparison in the brainwave pattern of music preference and the sleeping pattern between male and females. Based on the basic properties of the brainwave frequencies, the results were quite predictable. For the Eyes Closed Task, the expected prominent brainwave is Alpha wave which shows that the respondent’s mind is in a relaxed state. As for Task 3 and 4, the anticipated brainwave is the Delta wave that depicts the respondents is involved in decisionmaking process especially when their frontal cortex exhibits the highest brain activity than the other brain regions. Although most female respondents tend to have mental fatigue, sleep deprivation and have the features of daytime sleepiness due to high Beta brainwave activity and based on the Sleep Habit questionnaire distributed as well but their attention and concentration span is equal to that of males. According to (Mendoza, n.d), excessive Beta brainwave is features of insomnia. Most undergraduates tend to have the sleeping pattern of Evening Type that requires them to stay up late at night to complete their assignments and projects. However, most of them do compensate for the sleeping hours needed during the weekends and holiday breaks after reviewing their daily sleep log (shown in Appendix C). On the contrary, those that are classified under Evening Type sleeping pattern tend to be more emotional than the other sleeping patterns despite to have musical background or not based on type of music style administered during the qEEG assessment. This type of sleeping pattern tend to have preference for music such as country, gospel, oldies, pop, religious and soundtracks that are under the category of Upbeat and Conventional.
Cattell, R. B., & Anderson, J. C. (1953). The measurement of personality and behavior disorders by the I. P. A. T. Music Preference Test. Journal of Applied Psychology, 37, 446–454. doi:10.1037/h0056224
Chiang, Y. C., Arendt, S. W., & Zheng, T. (2014). Effects of sleep on academic performance of undergraduate students working in the hospitality industry.9th Annual Graduate Conference Proceedings, University of Houston. George, D., Stickle, K., Rachid, F., & Wopnford, A. (2007). The association between types of music enjoyed and cognitive, behavioral, personality factors of those who listen. Psychomusicology, 19, 32–56.
Harmat L., Takacs, J., & Bodizs, R. (2008). Music improves sleep quality in students. Journal of Advanced Nursing, 62(3), 327–335. doi: 10.1111/j.1365-2648.2008.04602.x.
Hofman, W. F., & Steenhof, L. (1997). Sleep characteristics of Dutch adolescents are related to school performance. Sleep-Wake Res The Netherlands, 8, 51-55. Jesperson, K. V., & Vuust, P. (2012). The Effect of Relaxation Music Listening on Sleep Quality in Traumatized Refugees : A Pilot Study. Journal of Music Therapy, 49(2), 205-229. doi: 10.1093/jmt/49.2.205.
Kelly, W. E., Kelly, K. E., & Clanton, R. C. (2001). The Relationship between Sleep Length and Grade Point Average among College Students, College Student Journal, 35(1), 84 - 86. Langmeyer, A., Guglor-Rudan, A., & Tarnai, C. (2012). What do Music Preferences reveal about Personality? Journal of Individual Differences, 33(2), 119-130. doi: 10.1027/16140001/a000082.
6. Conclusion
Music helps as a stress reliever to most people. This can be seen that people seek music that builds their motivation and attitude as well as music that reinforce their emotions which are based on the interactionism theories by (Swann, Rentfrow, & Guinn, 2002). Overall, this research can conclude that most participants were discovered to be of Evening Type sleeping pattern and with the music preference of Upbeat & Conventional factor. More research need to be done with more participants from various courses and institute of higher education so that the results result could be generalized towards other population from other institution of higher learning.
Link, S.C., & Ancoli, I. S. (1995). Sleep and the
McCarty, R., Barrios-Choplin, B., Atkinson, M., & Tomasino, D. (1998). The Effects of Different Types of Music on Mood, Tension, and Mental Clarity. Journal of Alternative Therapies, 4(1), 7584. Meijer, A. M., Habekothe, H. T., & Van Den Wittenboer G. L. H. (2000). Time in bed, quality of sleep and school functioning of children. Journal of Sleep Res, 9: 145-153.
References
145
Mendoza, M. (n.d.). Understanding the Benefits of Brainwaves and Binaural Beats. The Ultimate Quick Start Guide-Zenlama. Retrieved from : http://www.zenlama.com/understanding-the-
Isable Joshua, Norsiah Fauzan / Journal of Scientific Research and Development, 2 (13) 2015, Pages: 139-146
benefits-of-brainwaves-and-binaural-beats-theultimate-quick-start-guide/.
:internalmedicine.med.sc.edu/forms/Sleep%20q uestionnaire2.pdf
Rentfrow, P. J., & Gosling, S. D. (2003). The do re mi’s of everyday life: The structure and personality correlates of music preferences. Journal of Personality and Social Psychology, 84(6), 12361256. doi: 10.1037/0022-3514.84.6.1236.
Song, J. W., & Chung, K. C. (2010). Observational Studies: Cohort and Case-Control Studies.Journal of the American Society of Plastic Surgeons, 126 (6): 2234-2242. doi: 10.1097/PRS.0b013e3181f44abc.
Rentfrow, P. J., Goldberg, L. R., & Levitin, D. J. (2011). The structure of Musical Preferences: A fivefactor model. Journal of Personality & Social Psychology, 100(6): 1139-1157. doi: 10.1037/a0022406. Sleep Habit Retrieved
Questionnaire.
Internal
teenager. Sleep Res, 24a: 184.
Wu, D., Li, C.Y., & Yao, D.Z. (2009). Scale-Free Music of the Brain. PLoS ONE, 4(6)e5915. doi:10.1371/journal.pone.0005915.
Medicine. from
146