May 23, 2014 - KEYWORDS: TiO2, branched nanobelts, phocatalysis, charge ..... signature of TiO2(B) obtained at 244 cm. â1 .... A series of digital photographs.
Research Article www.acsami.org
Branch Density-Controlled Synthesis of Hierarchical TiO2 Nanobelt and Tunable Three-Step Electron Transfer for Enhanced Photocatalytic Property Debabrata Sarkar† and Kalyan Kumar Chattopadhyay*,†,‡ †
School of Material Science & Nanotechnology, and ‡Thin Film & Nanoscience Laboratory, Department of Physics, Jadavpur University, Kolkata 700 032, India S Supporting Information *
ABSTRACT: The successful adjustment of phase composition and morphology of hierarchical TiO2 nanobelts, which feature homoepitaxial nanobranches, has been developed via the hydrothermal method and chemical bath deposition technique. Effects of hydrothermal reaction time, titanium butoxide treatment in chemical bath deposition, and calcination temperature are systematically investigated. For the first time, three-step ultrafast electron transfers between the band edges of the engaged phases are realized through the enhanced photocatalytic activity results. Growth mechanism related to branch density control on nanobelt surface under such soft chemical process is discussed in detail on the basis of classical nucleation theory. The current work might provide new insights into the fabrication of one-dimensional homoepitaxial branched TiO2 nanostructures as high performance photocatalysts and facilitate their application in environmental cleanup. KEYWORDS: TiO2, branched nanobelts, phocatalysis, charge transfer, Raman spectra, nucleation theory
■
INTRODUCTION
generate electron−hole pairs, (ii) charge separation and migration to the surface of semiconductor, and (iii) surface reactions for water reduction or oxidation. Subject to these major processes, photocatalytic activity is found to be majorly dependent on size, shape, surface area, morphology, dimensionality, crystallinity, and the phases of the catalysts.7,8 One-dimensional (1D) TiO2 nanostructures such as nanorods, nanobelts, or nanowires are extensively studied due to their potential application as photocatalysts, solar cells, gas sensors, and lithium-ion batteries.9−12 The photocatalytic activity of 1D TiO2 nanobelts or nanowires is relatively low due to the presence of fewer active surface sites and high recombination of photogenerated electron−hole pairs of the single phase nanostructure.13−15 To enhance the active surface site and reduce the charge recombination, new nanostructures combined with branches for large specific surface area are
In advanced materials chemistry, constructing complex nanostructures with controllable morphology and crystallinity is highly important for optimizing their physical and chemical properties.1,2 In recent years, enormous efforts have been devoted toward the synthesis of inorganic materials with unusual and complex nanoarchitectures due to their exotic properties and wide applications in electronic, optoelectronic, magnetic, and electrochemical nanodevices and as well as in issues such as biomedical, environmental, and energy storage frontiers. Among the above, photocatalysis plays an indispensible role for green civilization.3,4 To remove toxic ions and organic pollutants from water for a clean and eco-friendly environment, photocatalysis is considered as an environmentally benign method. Among various oxide-based catalysts, titanium dioxide (TiO2) is proven to be the most suitable and promising candidate for its high physical and chemical stability, nontoxicity, effectivity, high oxidizing power, and cost efficiency.5,6 The overall photocatalytic reaction involves three major steps: (i) absorption of light by semiconductor to © 2014 American Chemical Society
Received: January 10, 2014 Accepted: May 23, 2014 Published: May 23, 2014 10044
dx.doi.org/10.1021/am502379q | ACS Appl. Mater. Interfaces 2014, 6, 10044−10059
ACS Applied Materials & Interfaces
Research Article
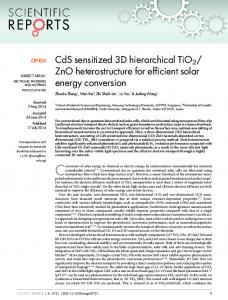
Figure 1. XRD patterns of (a) single phase bare and branched TiO2 nanobelts annealed at 400 °C, and (b) mixed phase bare and branched TiO2 nanobelts annealed at 550 °C.
■
desirable. Over the past decades, much effort was devoted to the development of different techniques for designing and fabrication of hierarchical nanostructures with well-controlled morphology and controlable crystallinity such as sol−gel method, hydrothermal/solvothermal method, chemical vapor deposition, physical vapor deposition, electrochemical deposition, etc.16−19 The formation of hierarchical structure is generally considered to be a self-assembly process. Mixedphase one-dimensional TiO2 nanobelts with nanobranches would lead to superior photocatalytic abilities as the electron− hole separation at the interface arises from the band alignment, and multiple reflections and scattering of UV light. Most of the mentioned methods have poor control over the morphology and density of the branches, which affect their properties. To take advantage of such hierarchical nanobranches for superior photocatalysis application, one must control them precisely at the stage of growth. To date, it is even more challenging to control the size, morphology, and crystal phase of hierarchical TiO2 nanostructures in a predictable manner. Among other growth deposition techniques, the “chemical bath deposition” approach is quite appropriate for the synthesis of second-order branched structures on primary nanostructures due to available excellent control over the structure, morphology, and dimensions of the obtained branches.20−28 Also, in chemical bath deposition, the solubility of solutes can easily change, and a small degree of supersaturation of the solution causes the heterogeneous nucleation. To handle the aforementioned problems, we introduce a facial and effective approach, incorporating solvothermal with a chemical bath deposition process to synthesize branched TiO2 nanostructure that is expected to greatly improve the degradation rate of methyl orange solution. The morphology, density of the branches, and phases of the branched nanobelts can be facilely controlled. The influences of precursor concentration on the growth of branches and the growth mechanism of these hierarchical branch nanobelts are also discussed in detail. To the best of our knowledge, the current work is the first report regarding TiO2(B)/anatase/rutile mixed phase branch nanobelts synthesis. For different branch densities, suitable growth mechanisms of nanocrystal nucleation and growth are also proposed. Finally, the photocatalytic activities of synthesized nanobelts are assessed for methyl orange as a model pollutant, and the degradation kinetics are evaluated in detail.
EXPERIMENTAL DETAILS
Materials Preparation. Preparation of Titanate Nanobelts. TiO2 nanobelts were prepared by the hydrothermal method. In this method, the sizes of the nanobelts can be controlled by varying the reaction temperatures and reaction time. In a typical reaction, 0.4 g of anatase TiO2 (Sigma-Aldrich) was first dispersed in 10 mL of 10 M NaOH aqueous solution. After the solution was stirred for 15 min, 10 mL of ethanol was added to the mixture solution. After being stirred for 30 min, the mixtures were heated at 200 °C for 6−72 h in a 100 mL Teflon-lined stainless-steel autoclave and then cooled to room temperature naturally. Next, the prepared cake-like sodium titanate nanobelts were immersed in a mixture of 100 mL of DI and 8 mL of HCl (35% by weight) for 10 h for transformation of sodium titanate nanobelts to hydrogen titanate nanobelts. The white hydrogen titanate nanobelt was filtered and washed thoroughly with deionized water until pH ≈ 7 was reached. Preparation of Branched TiO2 Nanobelts. The titanate nanobelts assembled by branches were prepared by chemical bath deposition. All syntheses were carried out in a 100 mL round-bottom flask equipped with a condenser, which was heated in an oil bath to a temperature of 60 °C. 0.05 g of prepared titanate nanobelts was placed into 50 mL of titanium butoxide (Ti(OC4H9)4) solution, which was prepared by mixing 50 mL of DI water, 0.4 mL of concentrated HCl (38% by weight), and Ti(OC4H9)4. Dilute acidic titanium butoxide was used to grow TiO2 nucleus at 60 °C under stirring for 6 h. The TiO2 nucleus was controlled by varying the Ti(OC4H9)4 amount as 0.05, 0.1, 0.2, and 0.4 mL. Finally, the hierarchical nanobelts consisting of long trunks and very short branches were washed and dried in air. After that, further annealing in air at 400 and 550 °C for 2 h is required for TiO2 nanobelt with branched structures with different phases. Materials Characterization. The crystal structures of products were examined by X-ray difraction (XRD, Rigaku-Ultima-III). The morphologies of the nanostructures were characterized by scanning electron microscopy (FESEM, Hitachi S4800) and high-resolution transmission electron microscopy (TEM, JEOL 2010) with an accelerating voltage of 200 kV. The chemical composition and chemical status were analyzed with an energy dispersive X-ray (EDS, Thermo scientific, Ultra dry, attached with FESEM) and X-ray photoelectron spectroscopy (XPS, HSA-3500, SPECS, Germany). UV−vis of the samples was recorded on a UV−vis spectrophotometer (UV-2550, Shimadzu) with an integrating sphere attachment. The Raman spectra were carried out with the WITec alpha 300RS system. The time-resolved fluorescence spectra were measured at room temperature by using nanosecond diode excitation source at 350 nm (IBH nanoLED-03) and TBX-04 as a detector. Photodegradation Reaction. Photocatalytic activity of the synthesized branched TiO2 nanobelts was carried out in a photoreactor, which was designed with an internal 40 W UV tube (Phillips) with a maximum emission at 254.6 nm. The photodegradation of methyl orange dye (MO, C14H14N3 NaO3S), a common target known to be carcinogenic and mutagenic, was used to study the photocatalytic 10045
dx.doi.org/10.1021/am502379q | ACS Appl. Mater. Interfaces 2014, 6, 10044−10059
ACS Applied Materials & Interfaces
Research Article
properties. For each measurement, 20 mg of the sample was dispersed within 40 mL of dye solution with a concentration of 10−5 M in a 100 mL quartz beaker. Before the photocatalytic activity test, the suspension was continuously stirred in the dark without irradiation for 30 min to establish the adsorption/desorption equilibrium of the dye on the nanobelt. At a given time interval, 3 mL of suspension was taken out and analyzed after removal of catalyst particles by filtration. The quantity of MO in solution was determined by the absorbance intensity at 268 nm (main absorption peak of MO) using a UV−vis spectrometer.
corresponding Bragg angle of the XRD peak in radians. By increasing calcination temperature from 400 to 700 °C, the crystallite size of TiO2(B) and anatase monotonically increased from 8.2 to 36.7 nm. The details of the experimental parameters, crystallite size, and crystal structure phase are listed in Table 1. Table 1. Details of the Experimental Parameters, Crystallite Size, and Crystal Phase
■
experimental parameters
RESULTS AND DISCUSSION X-ray Diffraction (XRD). The crystal structures and phase of the synthesized materials are characterized by X-ray diffraction (XRD), as shown in Figure 1. The XRD patterns of prepared sodium titanate (Na2TinO2n+1) and hydrogen titanate nanobelts (H2TinO2n+1) are shown in Supporting Information Figure S1, which shows the first crystalline sodium titanate nanobelts obtained by the hydrothermal method (PCPDFWIN no. 72-0148 and PCPDFWIN no. 80-0467), and after ion exchange crystalline branched hydrogen titanate is obtained (PCPDFWIN no. 41-0192 and PCPDFWIN no. 440131). The crystal structure influences the photocatalytic properties, and it has been shown that single phase-based TiO2 catalyst will have lower activity than mixed phase catalyst.29 It was observed that a pure nanocrystalline titania consisting of TiO2(B) and a mixture of TiO2(B)/anatase/rutile were obtained with controlled variation in calcination temperature. The XRD pattern of hierarchical TiO2(B) nanobelt after calcination of hierarchical hydrogen titanate nanobelt at 400 °C for 2 h is depicted in Figure 1a. The formation of TiO2(B) nanobelts assembled with homoepitaxial TiO2 nanobranches belongs to the C2/m space group (PCPDFWIN no. 46-1237). When the calcination temperature reaches 550 °C, the XRD of the corresponding sample shows a mixed phase of anatase, rutile, and TiO2(B). It can be observed from Figure 1b that anatase (tetragonal) is the main phase having three major diffraction peaks at 2θ values of 25.3°, 37.79°, and 48.04° (PCPDFWIN no. 78-2486) with two shoulders of rutile at 27.4° and 36° (PCPDFWIN no. 86-0147) and four weak shoulders of TiO2(B) at 14.19°, 28.61°, 43.51°, and 44.50°. Mean crystallite sizes of TiO2(B) and anatase phase were calculated from the line-broadening of XRD diffraction peaks at 24.9° and 25.3°, respectively. However, when the temperature was increased further to 700 °C, the crystallinity of the anatase phase increases significantly. Supporting Information Figure S2 shows that the weak peak of TiO2(B) at 14.19°, 28.61° disappeared. That means the TiO2(B) was slowly transformed into anatase phase. Therefore, the phase composition in the samples was controlled carefully by annealing time, and thereby the ratio of anatase, rutile, and TiO2(B) was changed dramatically. With increasing calcination temperature, the peak intensity increases significantly. The average crystallite sizes of TiO2(B) and TiO2(B)/anatase/rutile hierarchical nanobelts were calculated using Scherrer’s equation for the main diffraction peak via D=
Kλ β cos θ
sample
Ti(OC4H9)4 treatment (mL)
calcination temp (°C)
crystal phase
TiO2 nanobelts hierarchical TiO2 nanobelts (400HBx)
8.21 0.05 0.1 0.2
10.9 9.35 400
TiO2(B)
9.57 12.52
0.05 0.1
30.16 29.27
0.2
550
0.4
TiO2(B)/anatase
36.79
/rutile
23.44 42.41
TiO2 nanobelts hierarchical TiO2 nanobelts (700HBx)
9.68
0.4 TiO2 nanobelts hierarchical TiO2 nanobelts (550HBx)
crystal size (in nm)
0.05 0.1 0.2 0.4
35.57 41.80 700
anatase/rutile
43.59 38.74
Morphology and Structure. The morphology and structure of the smooth and hierarchical nanobelts are first characterized by field emission scanning electron microscopy (FESEM) and transmission electron microscopy (TEM). The morphologies of the hydrogen titanate nanobelts synthesized by hydrothermal method at 200 °C with different reaction times are displayed in Supporting Information Figure S3. Supporting Information Figure S3a, c, and d shows the sample synthesized after 5, 12, and 72 h of hydrothermal reaction, respectively, exhibiting bundles of nanobelt with short length and large diameters. Supporting Information Figure S3b shows a typical FESEM image of the nanobelts after 8 h of hydrothermal reaction; these nanobelts exhibited comparatively smooth surface, long length, and small uniform diameters over their entire lengths. Up to now many researchers30−34 found TiO2 nanobelt, which was formed after the calcinations of hydrogen titanate nanobelts, but in this work first we focus to tune the length, diameter, morphology, and phases of the synthesized nanobelts. Both are important for photocatalysis applications. To demonstrate the advantages of homoepitaxial nanobranches with different phases in photocatalytic applications, we compared the catalyst morphology as shown in Figure 2. Figure 2a and b displays titanate nanobelts of length ranging up to several tens (30−50) of micrometers. As shown in the high magnification FESEM images (Figure 2c and d), the nanobelts have a smooth surface with a diameter in the range of 25−60 nm. Figure 2e−p illustrates FESEM images of
(1)
where D is the average crystallite size obtained in angstroms (Å) and K is the shape factor taken to be 0.9, λ is the wavelength of X-ray radiation (Cu Kα = 1.5406 Å), β is the full width at half-maximum height in radians, and θ is the 10046
dx.doi.org/10.1021/am502379q | ACS Appl. Mater. Interfaces 2014, 6, 10044−10059
ACS Applied Materials & Interfaces
Research Article
Figure 2. FESEM images of as-prepared samples show the evolution of TiO2 hierarchical structures with different experimental conditions. (a−d) Bare TiO2 nanobelt, (e−h) hierarchical hydrogen titanate nanobelts, (i−l) hierarchical TiO2(B) nanobelts annealed at 400 °C, and (m−p) hierarchical mixed phase TiO2 nanobelts annealed at 550 °C.
Figure 3. High magnification FESEM images of hierarchical branched (I) hydrogen titanate nanobelts, (II) TiO2(B), and (III) TiO2 (mixed phase; TiO2(B)/anatase/rutile) grown in chemical bath deposition in HCl solutions containing different amounts of titanium butoxide: (a) 0.05 mL, (b) 0.1 mL, (c) 0.2 mL, and (d) 0.4 mL.
hierarchical TiO 2 nanobelts where the branches were synthesized by a simple chemical bath deposition method. The hierarchical hydrogen titanate nanobelts consist of many
short nanorod branches (Figure 2e−h). Figure 2i−l shows branched nanobelts heated at 400 °C with different titanium butoxide treatment, and Figure 2m−p shows branched 10047
dx.doi.org/10.1021/am502379q | ACS Appl. Mater. Interfaces 2014, 6, 10044−10059
ACS Applied Materials & Interfaces
Research Article
Figure 4. Typical TEM and HRTEM images of TiO2 nanostructures: (a−c) bare TiO2 nanobelts; (d−f) TiO2(B) branched nanobelts; and (g−k) mixed phase nanobelt with branch structures.
nanobelts heated at 550 °C with different titanium butoxide treatment, which clearly indicates with increasing calcination temperature the nanobelt morphologies have no obvious change. Yet the morphology of the branches, such as diameter, length, and density, was well controlled by varying the synthesis conditions. As the chemical reaction proceeded in chemical bath deposition, however, new features started to evolve on the smooth surface of the nanobelts. The resulting morphology was dependent on the amount of titanium butoxide in Ti(OC4H9)4 solution. We can see that the hierarchical nanostructures were formed on the surface of the nanobelts. Figure 2i−p shows the density of the nanobranches increases to 0.1 mL of Ti(OC4H9)4 treatment that leads to form nanobranches on the nanobelt surface for further increase in surface area. When the amount of Ti(OC4H9)4 was 0.2 mL, the nanobelts were partially coated with nanobranches. Further increasing the Ti(OC4H9)4 amount to 0.4 mL led to much less coverage of nanobranches. The HCl acid effect on the nanobelts examined in the same experimental condition without Ti(OC4H9)4 is shown in Supporting Information Figure S4a. Also, we examined nanobelts with Ti(OC4H9)4 but without the acid treatment, which is shown in Supporting Information Figure S4b, and we get nanobelts with particle agglomeration. Supporting Information Figure S4 illustrates that the nanobelts have smooth surfaces, which are similar to nanobelts without the acid treatment. So we conclude that without Ti(OC4H9)4 or HCl in chemical bath deposition, the morphology of the nanobelts does not change any more. When the calcination temperature increases to 700 °C, the hierarchical branches nanobelt morphology was completely destroyed, and only small nanorods with sizes of 100 nm to 5 μm are observed (Figure S5, Supporting Information). Examination of individual
hierarchical nanobelts with different branch densities and different phases is shown in Figure 3. High magnification FESEM images of the as-prepared hierarchical hydrogen titanate nanobelt are shown in Figure 3I. The high magnification FESEM images (Figure 3II and III) are provided to understand the morphology change of the as-prepared hierarchical TiO2 nanobelt assembled with homoepitaxial nanobranches at different amounts of Ti(OC4H9)4 treatment. After chemical bath deposition, the nanobelts are covered with nanobranches having length ∼20 nm and diameater ∼7−10 nm. When the calcination temperature reaches 550 °C, the diameter of the branches increases due to grain growth of the nanograins. The detailed growth mechanism is described in our previous work.35 As the amount of Ti(OC4H9)4 in the solution increased, the density of the nanobranch array also increased (parts a,b of Figure 3I−III, respectively). Meanwhile, with a further increase in the Ti(OC4H9)4 amount to 0.2 and 0.4 mL, the TiO2 nanobranch array density gradually decreased (parts c,d of Figures 6, 7, and 8, respectively). To optimize both nanobranch density and surface area for photocatalytic activity, the acidic medium chemical bath deposition was selected for all of the experiments in this Article. The chemical composition of these nanobelts was determined from the energy-dispersed spectrum. The observation of two peaks for Ti and O indicates that the nanobelts are pure TiO2, and the atomic ratio of Ti to O was found close to 1:2 (Supporting Information Figure S6a). Supporting Information Figure S6b corresponds to the EDX elemental mapping images of Ti and O. The details of microstructures of the samples were further investigated by high-resolution transmission electron microscopy (HRTEM), and the corresponding images are presented in Figure 4. Figure 4a−c shows three TEM images of TiO2 10048
dx.doi.org/10.1021/am502379q | ACS Appl. Mater. Interfaces 2014, 6, 10044−10059
ACS Applied Materials & Interfaces
Research Article
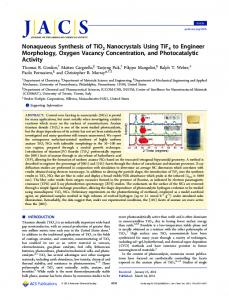
Figure 5. Raman spectra of the bare and branch (a) TiO2(B) nanobelts, and (b−d) mixed phase TiO2 nanobelts.
nanobelts, which indicate nanobelts are well-dispersed and flexible with smooth surface. As shown, the diameter is about 40 nm, and the length is of the order of micrometers. This value is different from crystallite size, which is calculated from XRD. Our grown nanobelt samples were not single crystalline in nature, but polycrystalline. The Debye−Scherrer equation actually provides crystallite size or length of coherence of the crystal planes perpendicular to the direction of the X-ray beam and not the exact particle size. As the belts were polycrystalline, hence composing crystallites had random orientation. The HRTEM image clearly shows that the nanobelts have a layered structure (Figure 4c) with interplanar distances of d101 = 0.351 nm. The clear lattice fringes of the nanobelts reveal that the growth front of the TiO2 nanobelt is the (101) planes. The prepared titanate nanobelts could be further converted into branched nanobelts with additional chemical bath deposition shown in Figure 4d−k. These hierarchical nanobelts are composed of smaller branches with width of about 8 nm and length of about 15 nm (Supporting Information Figure S7). It can be clearly observed that nanobranches grow on the surface of the TiO2 nanobelts. Figure 4d−f displays TEM and HRTEM images of hierarchical nanobelts calcined at 400 °C for 2 h. The average diameter of the branched nanobelts is approximately 40 nm (Figure 4e). The d-spacing of d110 = 0.357 nm corresponds well with that of the (110) plane of TiO2(B). We get the mixed phase nanostructure by changing the calcination temperature from 400 to 550 °C. Figure 4g−k shows a TEM image of branched TiO2(B)/anatase/rutile nanobelts and its corresponding HRTEM image, respectively. A careful observation of Figure 4i illustrates that there is a coexistence of two sets of lattice, and a continuity of lattice fringes between the interfaces of these two phases is shown by pink rectangles. The lattice fringes, taken from the region labeled by green squares marked
as in Figure 4i, are depicted in Figure 4j and k, which reveal that the nanostructures are highly crystalline. Two sets of lattice fringes with interplanar spacing of d001 = 0.623 nm and d101 = 0.351 nm clearly indicated in the magnified HRTEM image are attributed to (001) plane of TiO2(B) and (101) plane of the anatase nanocrystal, respectively, that form a heterojunction interface. Supporting Information Figure S7 shows the branches were formed on the primary nanobelts perpendicular to the propagating axis of primary TiO2 nanobelts. Such a hierarchical branch structure provides a large external surface area, which has a high photocatalytic activity. Therefore, suitable hydrothermal and controlled chemical bath deposition are important for optimimal density and quality of TiO2 branch nanobelts. Raman Spectra. Raman spectroscopy is an ideal characterization method to discriminate between the different crystalline morphologies of TiO2 due to their distinct vibrational modes. Figure 5a shows the Raman spectra of bare and branched TiO2 nanobelt calcined at 400 °C. The Raman spectra of the five samples (400HBx) are depicted between 50 and 1200 cm−1, and they are characteristic of the TiO2(B) variety with nine scattering diffusion active modes located at 125, 195, 247, 297, 370, 411, 471, 640, and 861 cm−1. The band positions for the TiO2(B) phase are in excellent agreement with published data.36,37 This result is well accordant with that of XRD (Figure 1). Figure 5a also shows that the intensity of the Raman peak for sample 400HB0.4 is minimum (magnified spectra are shown in Supporting Information Figure S8), which substantiates that the Raman modes are not dependent upon crystallinity of the samples. Phase changes due to calcination at 550 °C were fully investigated by Raman spectroscopy. According to the symmetry group analysis, anatase and rutile structures have three acoustic modes and 15 optical modes. Among the optical 10049
dx.doi.org/10.1021/am502379q | ACS Appl. Mater. Interfaces 2014, 6, 10044−10059
ACS Applied Materials & Interfaces
Research Article
layer titanate nanobelts superposed to each other to form detectable sodium titanate nanobelts, which are in HCl solution allowing ion exchange from Na+ ions of sodium titanate by H+ to form hydrogen titanate (H2TinO2n+1).
modes, for anatase the irreducible representations are 1A1g + 1A2u + 2B1g + 1B2u + 3Eg + 2Eu. The vibration of B2u is inactive in both the infrared and the Raman spectra. For rutile the irreducible representations are 1A1g + 1A2g + 1A2u + 1B1g + 2B1u + 1B2g + Eg + 3Eu. Here, A2g + 2B1u are neither Raman active nor infrared active. Representations with the subscript “u” are IR-active, while representations with the subscript “g” are Raman active and E is degenerate. For samples 550HBx, the characteristic bands due to TiO2(B) phase almost disappear, and five new strong bands at 143, 196, 397, 516, and 639 cm−1 are observed (Figure 5b). All of these bands are assigned to the anatase phase.38 The magnified Raman spectra are illustrated in Supporting Information Figure S9. Except for the anatase band discussed above, only one nonoverlapping weak Raman signature of TiO2(B) obtained at 244 cm−1 indeed proves the existence of TiO2(B) phase. The XRD pattern shows that the samples are of mixed phase of anatase, rutile, and TiO2(B). The peak position for rutile Raman active B1g mode centered at 143 cm−1 may overlap with anatase Eg mode (144 cm−1). It is important to deconvolute the superimposed broad peaks at 397 and 639 cm−1, because this allows a better identification of the individual bands. The as-recorded spectra were fitted and deconvoluted by using Gaussian function and Gaussian deconvolution methods, which are shown in Figure 5c. It can be observed from Figure 5c and d that there are two bands near 397, 411 cm−1 and 612, 639 cm−1. The peak at 411 cm−1 assigned to TiO2(B) and at 612 cm−1 indicates rutile A1g mode of TiO2.36,38 The observed Raman modes for all samples are summarized in Table 2, and they are in good agreement with reported literature data.39
hydrothermal
3TiO2 + 2NaOH ⎯⎯⎯⎯⎯⎯⎯⎯⎯⎯⎯⎯→ Na 2Ti nO2n + 1
(2)
ion exchange
Na 2Ti nO2n + 1 + 2HCl ⎯⎯⎯⎯⎯⎯⎯⎯⎯⎯⎯⎯→ H 2Ti nO2n + 1 + 2NaCl (3)
These sodium titanate nanobelts are made up of TiO6 octahedra that share edges to form two-dimensional sheets. These sheets are held together and electrostatically stabilized with Na+ and OH− between the layers. After the ion exchange, the TiO6 octahedra layers remain unchanged, but the Na+ ions are replaced with H+ ions as shown in the crystal structure in Scheme 1. (b) Hierarchical TiO2 nanobelt: In this step, through hydrolyzation of Ti(OBu)4 under acidic condition, titanate nuclei were formed and attached to the nanobelt surface. It is noted from Supporting Information Figure S4 that the seed layer is mandatory for hierarchical structure because no secondary growth was observed when this step was omitted. With prolonging the reaction time, branches were formed due to each nucleus growth in the direction perpendicular to the nanobelt surface. Here, TiO2 branches were formed on the titanate nanobelt surface by heterogeneous nucleation mechanism due to a lower free energy as compared to homogeneous nucleation. In the last step, the hydrogen titanate nanobelt assembled with nanobranches transforms into hierarchical TiO2 nanobelts by thermal annealing. annealing 400 ° C
H 2Ti nO2n + 1 ⎯⎯⎯⎯⎯⎯⎯⎯⎯⎯⎯⎯⎯⎯⎯⎯→ TiO2 (B)
Table 2. Vibration Frequencies and Mode Assignments of Observed Raman Bands for Samples 400HBx and 550HBx sample
400
HBx
550
HBx
phase
TiO2(B)
anatase
rutile TiO2(B)
Raman modes (cm−1)
mode assignment
125 195 247 297 370 411 471 640 861 143 196 397 516 639 612 244 411
Bg Bg Bg Ag Ag Ag Ag Bg Ag Eg Eg B1g A1g + B1g Eg A1g Bg Ag
(4)
annealing 550 ° C
H 2Ti nO2n + 1 ⎯⎯⎯⎯⎯⎯⎯⎯⎯⎯⎯⎯⎯⎯⎯⎯→ TiO2 (B)/anatase/rutile
(5)
To explain the effect of the Ti(OC4H9)4, a possible mechanism based on the type of nucleation and growth can be assumed for the formation of different nanobranch densities on the TiO2 belts. In chemical bath deposition, Ti−O−Ti oxo species are formed by hydrolysis of titanium butoxide, which is shown in Figure 6. The growth of the Ti−O−Ti network results in amorphous titania nuclei. According to the classical nucleation theory, the equation for the free energy change (ΔG) due to nucleation of spherical nucleus with radius r from the solution with supersaturation S is described by ΔG =
4 3 Πr ΔGv + 4Πr 2γsl 3
(6)
where ΔGv is the change of Gibb’s free energy per unit volume solute transforming from solution to crystallite, and γsl is the surface free energy per unit area of the solid−liquid interface. The expression of ΔGv is given below: ΔGv = −
Growth Mechanism. On the basis of the above analysis, we propose a simple three-step growth process. The preparation of TiO2 nanobelt assembled with homoepitaxial nanobranches is shown in Scheme 1. (a) Hydrogen titanate nanobelt (N2TinO2n+1): First, bulk anatase TiO2 powder reacts with the NaOH aqueous solution and forms a layer-like lamellar product. At 200 °C in hydrothermal condition, this reaction is very fast and produces a large amount of titanate particles, and these particles grow very quickly along a certain plane, forming single layer titanate nanobelts (Na2TinO2n+1). Now these single
kT C kT ln =− ln(1 + S) Ω C0 Ω
(7)
where Ω is atomic volume, C is the concentration of solute in the solution, and C0 is the concentration of solute at equilibrium. In the change of the Gibbs free energy, there exists a critical size (r = rc = −(2γsl)/(ΔGv)) given by maximum ΔG. The nucleus with smaller radius (