XII JORNADAS DE PARALELISMO—VALENCIA, SEPTIEMBRE 2001
1
Branch Prediction Reversal by Correlating with Data Values Juan L. Aragón1, José González1, José M. García1 and Antonio González2
Abstract—Branch prediction is one of the main hurdles in the roadmap towards higher clock frequencies and deeper pipelines. This work presents a new approach to enhancing current branch predictors: Selective Branch Prediction Reversal. The rationale behind this proposal is the fact that many branch mispredictions can be avoided if branch prediction is selectively reversed. We present a Branch Prediction Reversal Unit (BPRU) that selectively reverses branch predictions by correlating with the predicted values of the branch inputs, in addition to recent control flow. As a case study, we have included the BPRU in an already proposed branch predictor, the Branch Predictor through Value Prediction (BPVP). The effect is a reduction by half in its original misprediction rate. We have also measured the improvement when the BPRU is used in a hybrid scheme composed of a BPVP and a gshare predictors. Results using immediate updates show average reductions in misprediction rate ranging from 7% to 14%. Performance evaluation of the proposed BPRU in a 20stage superscalar processor shows an IPC improvement of up to 9%. Keywords—Branch Prediction Reversal, Value Prediction, Dynamically-scheduled Superscalar Processors.
I. INTRODUCTION
O
NE of the common ways to increase processor performance relies on reducing the clock cycle. On a given technology, fewer gates per pipeline stage result in higher frequencies. However, this causes an increase in the pipeline depth. For instance, the Intel P6 processor has a pipeline of 10 stages and a clock frequency of 733 MHz at 0.18 microns, whereas the new Intel Pentium 4 is announced to work at a clock rate of more than 1.4 GHz with the same technology. To achieve this frequency, the pipeline is lengthened to 20 stages [6]. Deeper pipelines present a serious challenge to the performance of dynamically-scheduled superscalar processors: the branch misprediction penalty increases since branches take longer to be resolved and thus, the entering to the pipeline of instructions from the correct path is delayed. In the meantime, the pipeline is filled with many useless instructions from the incorrect path. As an example, for perfect branch prediction, we have measured that the slowdown experienced by a processor with a 20-stage pipeline (similar to the Pentium 4) with 1
Dpto. Ingeniería y Tecnología de Computadores, Universidad de Murcia, 30071 Murcia (Spain) e-mail: {jlaragon,joseg,jmgarcia}@ditec.um.es
2
Departament d’Arquitectura de Computadors, Universitat Politècnica de Catalunya, 08034 Barcelona (Spain) e-mail:
[email protected]
respect to a 10-stage pipelined processor for the go application is almost negligible (2%). On the other hand, for a gshare branch predictor of 32 KB, the slowdown due to the increased pipeline depth augments to 22%. Even if the branch misprediction rate is quite small, improvements on branch prediction accuracy significantly influence performance, due to the superlinear relationship between misprediction rate and processor performance [7]. This paper presents a new approach to enhancing current branch predictors: Selective Branch Prediction Reversal. The rationale behind this approach is the fact that many branch mispredictions can be avoided if the branch prediction is selectively reversed. Inverting some branch predictions was proposed by other authors [14]. However, their approach showed limited performance benefits since the inversion mechanism relied on correlating the inversion with the outcome of recent branches. We propose a Branch Prediction Reversal Unit (BPRU) that reverses branch predictions based on the predicted value of the branch input, and the path followed to reach the branch (including the PC of the input producers). Thus, BPRU correlates the inversions with data values and recent control flow. The BPRU can be combined with any other proposed predictor. As a case study for the application of the BPRU, in this work, we use as baseline predictor the Branch Predictor through Value Prediction (BPVP) [8], which is a branch predictor that already correlates predictions with data values. The BPVP was shown to have extremely high prediction accuracy when used in combination with a correlating branch predictor such as the gshare [15], outperforming other contemporary branch predictors. We show that the proposed BPRU can significantly improve the accuracy of the original BPVP. On average, the BPRU reduces the misprediction rate of the BPVP by half. The rest of this paper is organized as follows. Section II presents a taxonomy of branch mispredictions. The proposed BPRU is described in Section III and Section IV analyzes its performance. Section V presents the related work, and finally, Section VI summarizes the main conclusions of this work. II. TAXONOMY OF BRANCH MISPREDICTIONS This section motivates the inclusion of a Branch Prediction Reversal Unit (BPRU) in a traditional branch predictor. We focus our analysis on the BPVP [8], which predicts branch outcomes by predicting the values of their inputs and performing an early computation of their results according to the predicted values.
2
ARAGÓN Y COL: BRANCH PREDICTION REVERSAL BY CORRELATING WITH DATA VALUES
input hit confident
non-confident input predictions we reversed, the overall accuracy would be degraded.
branch hit input miss
Branch input prediction
branch hit
input hit non-conf. input miss
branch miss
III. BRANCH PREDICTION REVERSAL MECHANISM
branch hit
C
branch hit
B
branch miss A
Figure 1. Diagram of the different branch outcomes depending on the input prediction. TABLE I BRANCH PREDICTION BREAKDOWN FOR AN 8 KB BPVP
Confident pred. input Benchmark input hit input miss br. hit br. hit br. miss gcc 42.8% 4.4% 3.4% compress 46.4% 0.8% 4.6% go 27.3% 3.9% 5.4% ijpeg 63.3% 1.6% 2.5% li 45.9% 1.6% 2.0% m88ksim 76.2% 0.9% 2.6% perl 46.8% 3.5% 3.2% vortex 70.6% 1.9% 1.5% AVERAGE 52.4% 2.3% 3.2% 57.9%
Non-conf. pred. input input miss input hit br. hit br. hit br. miss 11.2% 23.8% 14.4% 10.9% 22.4% 14.9% 16.6% 27.4% 19.3% 10.3% 13.1% 9.1% 5.8% 33.9% 10.9% 3.7% 11.0% 5.5% 12.9% 23.5% 10.1% 13.4% 7.2% 5.4% 10.6% 20.3% 11.2% 42.1%
Figure 1 establishes a relationship between the behavior of the value predictor and branch predictions. Value predictions can be split into confident and nonconfident, depending on the confidence counter of the value predictor entry being used1. Each of them can result in a branch input hit or a branch input miss. A value prediction hit causes a branch prediction hit. However, a value prediction miss does not necessarily cause a branch miss. For instance, if a branch checks whether the input value is different from zero, any predicted input value but zero will cause a branch hit. Table I quantifies the frequency of the different cases described in Figure 1 for the whole SpecInt95 benchmark suite. The BPVP uses an 8 KB stride predictor as value predictor. Section 4 further details the experimentation process. First of all, the value predictor provides 57.9% of confident predictions and 42.1% of non-confident ones. Most of the confident input predictions are correct (52.4% over 57.9%), and just a minor percentage cause branch misses (3.2% over 57.9%). Furthermore, for the non-confident input predictions, 31.5% over 42.1%, lead to value mispredictions. We also see that the majority of the total branch mispredictions come from these non-confident input mispredictions (11.2% over 14.4%). All benchmarks follow this trend, which suggests a correlation between branch mispredictions and value predictions: most branch misses come from nonconfident predicted inputs and only a few branch mispredictions come from confident ones. However, in order to reverse branch predictions, not only the confidence counters of the value predictor should be taken into account. If all branch predictions based on 1
Value predictors use a confidence field, usually implemented as a nbit saturating counter, in order to assign confidence to their predictions [12].
In this section, we analyze alternative parameters that may be taken into account for a branch reversal mechanism and then, the proposed implementation of the BPRU is described. A. Quantitative Analysis of the Branch Reversal Mechanism We have first performed an off-line analysis in order to gain some insight into the processor parameters that provide a better correlation with branch mispredictions. The following parameters have been independently examined: a) b) c) d)
The predicted value of the branch input. The PC of the branch input producer. The predicted branch input and the branch PC. The predicted branch input and the PC of the branch input producer. e) The predicted branch input, the PC of the branch input producer and the path followed to reach the branch. We have run all the SpecInt95 suite using a modified version of the sim-safe simulator [2]. Then, the occurrences of cases A, B and C (see Figure 1) are measured for the five scenarios, assuming unbounded storage resources. For those parameter values for which Equation (1) is fulfilled, the branch prediction is reversed. occurrences in A > (occurrences in B + occurrences in C) (1)
Then, a new misprediction rate is obtained, which shows the potential of reversing the branch prediction considering this a priori information. As an example of how this evaluation has been carried out, Table II shows the branch misprediction distribution for a particular branch from the go application, and the approach that reverses predictions based on the predicted branch input and the branch PC. TABLE II CLASSIFICATION FOR A BRANCH WITH PC = 4831941696 AND A PREDICTED BRANCH INPUT =
–2, IN THE GO BENCHMARK
Confident pred. input Non-conf. pred. input Benchmark input hit input miss input miss input hit br. hit br. hit br. miss br. hit br. hit br. miss go 0 1 59 0 905 4531
This particular static branch is predicted 5496 times with a predicted input of –2. Non-confident value predictions cause 4531 misses and 905 hits. Evaluating Equation (1), we realize that reversing the branch prediction for this scenario increases the overall hit rate: from 906 to 4532 branch hits after reversing. Figure 2 shows the new misprediction rate for gcc, go, ijpeg and li applications for the five evaluated scenarios. The underlying branch predictor is the BPVP using a stride value predictor with an unrealistic size of 1 MB in
XII JORNADAS DE PARALELISMO—VALENCIA, SEPTIEMBRE 2001
3
Branch Miss-rate (%)
25
result of compare instr.
BPVP only value only PCin val+PCbr val+PCin val+PCin+path
20 15 10
input register
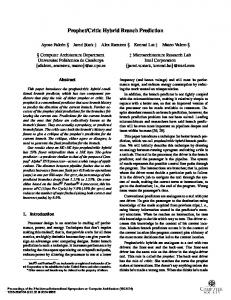
Input Information Table (IIT)
input PC Value Predictor
input PC
BPVP Branch Evaluation Unit (BEU)
(VP)
non-conf. preliminary prediction signal
pred. input
5
branch
0
gcc
go
ijpeg
li
Path Hist. Reg.
Figure 2. Potential misprediction rate using branch inversion.
order to isolate the potential of our proposal from the performance of the value predictor. It can be observed that the approach (e) is the best one. It reduces the BPVP misprediction rate by half for all benchmarks. These results show the potential of branch prediction reversal to enhance the performance of branch predictors when data values and control flow information are taken into account. There are some examples that may offer some insights into the source of correlation between a branch prediction miss and a mispredicted value. For nested loops with values that follow repeated stride patterns (e.g. 2,4,6,8,2,4,6,8,…), every new start of the internal loop produce a re-start of the stride sequence and a value misprediction for the first iteration. If this value is used by a branch predictor it may result in a misprediction, but the predicted value will always be the same. For instance, in the above sequence the value predictor will produce 10 whereas the actual value is 2. If the branch condition result for 10 and 2 are different, every time that the prediction is 10 the prediction may be inverted and the result will be correct. Another example is the traversal of linked lists to search for an element. Although the operating system memory handler tries to allocate contiguous memory locations, many consecutive elements are located in consecutive locations but others are not. Since the addresses of physically consecutive elements follow a stride pattern, a stride value predictor usually hits, except when there is a non-contiguous node, producing a branch input miss if this address is used as the branch input. If this value misprediction results in a branch misprediction, the following times that the same address is predicted, the branch prediction will be inverted, resulting in a branch hit. B. Branch Prediction Reversal Unit (BPRU) This section presents the implementation of the
input information
input information
Branch Predictor branch preliminary prediction branch prediction
hash func.
tag reversal count.
counter msb
Reversal Table (RT)
Figure 3. Block diagram of the BPRU.
BPRU
hash func.
tag reversal count.
counter msb
Reversal Table (RT)
prediction
BPRU
Figure 4. Block diagram of the BPRU integrated along with the BPVP.
Branch Prediction Reversal Unit (BPRU). As a case study, we show how it works in conjunction with the BPVP predictor, although this unit could be included in any branch predictor. Figure 3 depicts the block diagram of the BPRU. It consists of a Reversal Table (RT) and the logic necessary for making the reversal of the preliminary branch outcome. Each entry of the RT stores a reversal counter, which is an up/down saturating counter, and a tag. The RT is accessed when the branch is predicted, by hashing some processor state information. The most significant bit of the counter of the corresponding RT entry indicates whether the branch outcome is reversed. Once the correct branch outcome is computed, the RT entry is updated, incrementing the counter if the preliminary branch outcome was incorrect, and decreasing the counter otherwise. Figure 4 depicts the block diagram of the BPRU when it is integrated along with the BPVP predictor. Details about how the BPVP works can be found in [8]. We refer to this new scheme as BPVP+BPRU. According to the analysis of the previous section, the most effective approach to reversing branch predictions is to correlate with the predicted value, the PC of the branch input producer and the path followed to reach the branch. The first and the second parameters along with a nonconfidence signal are forwarded from the BPVP to the BPRU. In addition, the BPRU maintains a Path History Register (PHR), which stores the path followed to reach the branch. For each fetched control-flow instruction (conditional or unconditional), the PHR is shifted 2 bits to the left and the 2 least significant bits of the PC are shifted in. The RT is indexed by hashing the PC of the branch input producer, the predicted value and the PHR. Nevertheless, for other branch predictors, different information could be used, such as the values of some particular registers, the branch PC, history of recent outcomes, etc. Conflicts in the RT are one of the major problems that may limit the BPRU performance [1]. We observed that the use of tags alleviates destructive aliasing, obtaining higher performance than a non-tagged RT of the same size, despite of the space occupied by the tags. Besides, the replacement policy of the RT has to be carefully selected. Our replacement policy gives priority to entries with lower values in their reversal counter. The BPVP predictor exploits different predictability phenomena than a correlating predictor, and the combined effect in a hybrid scheme obtains very low
IV. EXPERIMENTAL RESULTS This section analyzes the performance of the proposed BPRU engine when it is integrated along with the BPVP. We also present results for a hybrid mechanism composed of two correlating predictors: bimodal (2bit) [19] and gshare [15]. Thus, the evaluated hybrid predictors are: BPVP+BPRU+gshare, BPVP+gshare, and 2bit+gshare2. A. Simulation Methodology We have considered the five programs from the SpecInt95 benchmark suite that exhibit the highest misprediction rates. Table III shows for each benchmark the input set, the number of dynamic instructions and the number of conditional branches. All benchmarks were compiled with maximum optimizations (-O4 -migrate) by the Compaq Alpha compiler, and they were run until completion using the SimpleScalar/Alpha v3.0 tool set [2].
Misprediction rate (%)
misprediction rates [8]. In the next section we will evaluate the benefits of the BPRU when applied to the BPVP alone and in a hybrid scheme composed of the BPVP and a correlating branch predictor (e.g. gshare).
Misprediction rate (%)
ARAGÓN Y COL: BRANCH PREDICTION REVERSAL BY CORRELATING WITH DATA VALUES
25
compress
20
gcc
BPVP+BPRU BPVP
20 16
15
12
10 5
8 1
2
4
8
16
32
64
go
30
1
10
20
8
15
6 2
4
8
16
32
4
2
4
16
32
64
8
16
32
64
32
64
AVERAGE
20
12
8
ijpeg
1
64
li
16
2
12
25
1
Misprediction rate (%)
4
16
8
12
4 8 0 1
2
4
8
16
32
64
1
2
4
8
16
size (KB)
size (KB)
Figure 5. Branch misprediction rates for BPVP+BPRU and BPVP predictors for five Spec95 applications as well as the arithmetic mean.
compress gcc go ijpeg li
# dyn. Instr. # dyn.cond. (in Mill.) branch (Mill) 40000 e 2231 169.6 12.6 genrecog.i 145.4 19.3 99 145.6 15.4 specmun -qual 45 166.0 9.4 7 queens 242.7 32.0 Input Set
B. Results for Immediate Updates The first set of experiments update prediction tables immediately, in order to evaluate the potential of the selective reversal mechanism when it is isolated from other aspects of the microarchitecture (using the simsafe simulator). We first measure the misprediction rate of the BPVP+BPRU predictor for different sizes. For each configuration, half of the total size is devoted to the BPVP and the other half to the BPRU. The RT is implemented as an 8-way associative table using 13 bits for tags and 3 bits for the reversal counters. All the experiments compare predictors of the same total size, including the space occupied by tags and counters. Figure 5 shows the results. It can be observed that BPVP+BPRU significantly outperforms BPVP for all benchmarks and all evaluated sizes. On average, the BPRU reduces the misprediction rate of the BPVP by half for 32 KB capacity. Besides, as the total predictor size grows, the difference between the misprediction rates of both predictors becomes higher, which shows that the BPRU exploits other type of correlations not included in the BPVP.
2
The first and the second predictors use the selector proposed in [8], whereas the 2bit+gshare uses the selector proposed in [15]. For each case, we chose the selector that produced the best results.
compress
10
BPVP+BPRU+gshare BPVP+gshare 2bit+gshare Interference free
gcc
10 8
8
6
6
4
4
2 8
Misprediction rate (%)
Benchmark
16
32
64
128
go
20
9
8
16
32
64
128
64
128
ijpeg
8 16
7
12
6
8
5 8
Misprediction rate (%)
BENCHMARK CHARACTERISTICS
Misprediction rate (%)
TABLE III
16
32
64
128
li
3.0
8
16
2.5
8
2.0
6
1.5
32
AVERAGE
10
4
1.0 8
16
32
size (KB)
64
128
8
16
32
64
128
size (KB)
Figure 6. Branch misprediction rates for BPVP+BPRU+ gshare, BPVP+gshare, 2bit+gshare and BPVP+BPRU+ gshare with an interference-free RT.
The misprediction rate of the BPVP is not impressive, since this predictor was designed to be used in conjunction with a correlating branch predictor. Figure 6 shows the misprediction rates for the hybrid BPVP+BPRU+gshare, BPVP+gshare and 2bit+gshare predictors. More details about the configurations used can be found in [1]. First, the BPVP+BPRU+gshare outperforms the BPVP+gshare for all benchmarks and for all size configurations excepting compress, for which both have about the same performance. A BPVP+BPRU+gshare
XII JORNADAS DE PARALELISMO—VALENCIA, SEPTIEMBRE 2001
with a size of 36 KB obtains, on average, a similar misprediction rate than a BPVP+gshare of 128 KB. Second, the combination of BPVP+BPRU+gshare significantly outperforms the 2bit+gshare for all size configurations. On average, a BPVP+BPRU+gshare with a total size of 9 KB has about the same misprediction rate (7.7%) as a 2bit+gshare of 128 KB (7.5%). Summarizing, on average the BPVP+BPRU+gshare reduces the misprediction rate by a factor that ranges from 7% to 14% with respect to the BPVP+gshare, and from 24% to 35% with respect to a 2bit+gshare. Finally, we note that the potential of the BPRU is limited by destructive aliasing when accessing the RT. This can be observed by looking at the misprediction rate of the BPVP+BPRU+gshare using an interferencefree RT. The unbounded RT provides huge improvements for all benchmarks. For instance, in the go application, the miss rate of an 8 KB BPVP+gshare drops from 18% to 9% when a BPRU with an interference-free RT is included. This shows the potential of the proposed branch reversal mechanism as well as an opportunity for improvement by using better indexing schemes to access the RT. C. Results for Realistic Updates This section presents an evaluation of the proposed BPRU in a dynamically-scheduled superscalar processor. Details of the simulated superscalar pipeline are described in Table IV. In addition, the original simoutorder simulator pipeline has been lengthened to 20 stages, following the pipeline scheme of the Pentium 4 processor [6]. TABLE IV SIMULATED SUPERSCALAR PIPELINE PARAMETERS U p to 8 in s tru c tio n s /c y c le , 2 ta k e n b ra n c h e s , 8 c y c le s m is p r e d ic tio n p e n a lty . Is s u e s u p to 8 in s tru c tio n s /c y c le , 1 2 8 -e n trie s E x e c u tio n e n g in e re o r d e r b u ffe r , 6 4 -e n trie s lo a d /s to r e q u e u e . 8 in te g e r a lu , 2 in te g e r m u lt, 2 m e m p o r ts , F u n c tio n a l U n its 8 F P a lu , 1 F P m u lt. 1 2 8 K B , 2 -w a y s e t a s s o c ia tiv e , 3 2 b y te s /lin e , L 1 I n s tr -c a c h e 1 c y c le h it la te n c y . F e tc h e n g in e
L 1 D a ta - c a c h e L 2 u n ifie d c a c h e M e m o ry
2bit+gs 32KB 2bit+gs 64KB 2bit+gs 128KB
1 2 8 K B , 2 -w a y s e t a s s o c ia tiv e , 3 2 b y te s /lin e , 1 c y c le h it la te n c y . 5 1 2 K B , 4 -w a y s e t a s s o c ia tiv e , 3 2 b y te s /lin e , 6 c y c le s h it la te n c y , 1 8 c y c le s m is s la te n c y . 8 b y te s /lin e , v irtu a l m e m o ry 4 K B p a g e s , 3 0 c y c le s T L B m is s .
BPVP+gs 32KB BPVP+gs 64KB BPVP+gs 128KB
3.5
Interf. free 32KB Interf. free 64KB Interf. free 128KB
BPVP+BPRU+gs 32KB BPVP+BPRU+gs 64KB BPVP+BPRU+gs 128KB
IPC
3.0 2.5 2.0 1.5 1.0
compress
gcc
go
ijpeg
li
5
Figure 7 shows the IPC obtained for each benchmark when using the BPVP+BPRU+gshare, BPVP+gshare and 2bit+gshare predictors for three different sizes. The latency considered for the 2bit+gshare is one cycle, that is, the branch prediction is made during the fetch stage. The latency considered for the BPVP+BPRU is 3 cycles, since the BPVP has to perform several table accesses to provide the prediction3 [8]. We can observe that the addition of the BPRU results in a significant speedup for all cases. The average IPC obtained with the BPVP+BPRU+gshare predictor is significantly higher than the IPC of the 2bit+gshare (average speedups of 13%, 14% and 14% for 32 KB, 64 KB and 128 KB respectively). Also, a BPVP+BPRU+gshare of about 32 KB achieves the same performance as a BPVP+gshare of 128 KB. Table V shows the speedup obtained by BPVP+BPRU+ gshare with respect to BPVP+gshare and 2bit+gshare for a total predictor size of 64 KB. TABLE V SPEEDUP FOR A TOTAL SIZE OF 64 KB Baseline
BPRU
realistic BPVP+ gshare Interf.free RT 2bit+ gshare
realistic Interf.free RT
compress
gcc
go
ijpeg
li
AVG.
1.07 1.22 1.19 1.29
1.04 1.11 1.13 1.28
1.09 1.18 1.25 1.38
1.03 1.08 1.05 1.10
1.07 1.11 1.09 1.12
1.06 1.14 1.14 1.23
The average speedup of the BPVP+BPRU+gshare over BPVP+gshare is 6%. Go is the benchmark which obtains the higher speedup (9%). Comparing BPVP+BPRU+ gshare with 2bit+gshare, the average speedup is about 14%. The benchmark that obtains the best speedup is again go (25%). Finally, the speedup of the BPRU with an interfererence-free RT is very high, specially for compress, gcc and go. For a size of 64 KB, the average speedups over BPVP+gshare are 22%, 11% and 18% respectively. V. RELATED WORK The vast majority of branch predictors rely on the fact that the outcome of a branch may correlate with its own history [19][20], the behavior of previous branches [15][19], or the path followed by the program [16]. Some other works have focused on improving the performance of those predictors by avoiding aliasing [4][18] or by combining different branch predictors [5][15]. On the other hand, several studies have shown that some instructions generate data values that follow predictable patterns [13][17]. Therefore, value prediction has been mainly applied to data value speculation [3][12]. The aim of these proposals is to overcome the serialization imposed by data dependences. In [17], the potential of improving branch prediction accuracy by using data value prediction was suggested but no particular mechanism is proposed. In [8], it is
AVERAGE
Figure 7. IPC for BPVP+BPRU+gshare, BPVP+gshare and 2bit+gshare for different predictor sizes.
3
To reach this latency, accesses to the different tables can be pipelined by adding latches in between.
6
ARAGÓN Y COL: BRANCH PREDICTION REVERSAL BY CORRELATING WITH DATA VALUES
proposed the BPVP predictor which correlates branch predictions with data values, obtaining a very high accuracy when it is used along with a correlating branch predictor. In [10], it is proposed a branch predictor which correlates with data values to index a prediction table. The scheme also includes a Rare Event Predictor, for the exceptional cases. In [11], a branch confidence estimator is proposed, and although it is suggested that can be used for branch reversal, neither a particular implementation nor a miss rate evaluation is presented. In [9] different branch confidence estimators are proposed and, in [14], they are evaluated when used for Selective Branch Inversion. All the confidence estimators proposed are just based on correlating on recent branch outcomes and the branch PC, without correlating on other processor parameters such as data values. The results showed average misprediction reductions by a factor of 5%-7% over a 2bit+gshare (named mcfarling in that work), which is lower than the reduction we present in this work (7%14% achieved by the BPRU+BPVP+gshare over BPVP+gshare, which, in turn, is a better predictor than the 2bit+gshare). VI. CONCLUSIONS In this paper we have proposed a Selective Branch Prediction Reversal mechanism as an effective approach to improving branch prediction accuracy. It relies on the fact that many branch mispredictions can be avoided if branch predictions are selectively reversed based on some processor parameters. We have evaluated several parameters and showed that the result of a branch prediction can be correlated with the predicted data value of the branch input, path history and the PC of the branch input producer. We have proposed a Branch Prediction Reversal Unit (BPRU) that selectively reverses particular branches likely to be mispredicted, based on the above parameters. As an example of its functionality, we have integrated the BPRU with the BPVP predictor, which on average results in a reduction in misprediction rate by half. In addition, we have compared the hybrid BPVP+BPRU+ gshare against both the BPVP+gshare and the 2bit+gshare predictors. Results using immediate updates show average reductions of misprediction rates by a factor that ranges from 24% to 35% over 2bit+gshare, and from 7% to 14% over BPVP+gshare. We have also evaluated the proposed BPVP+BPRU+ gshare predictor for a superscalar processor with a 20stage pipeline using realistic table updates and prediction latencies. Results show average speedups of 6% (up to 9% for some applications) over BPVP+gshare and 14% (up to 25%) over 2bit+gshare. Results have also shown that the potential performance of the BPRU is limited by destructive aliasing. This suggests an opportunity for improvement by exploring other indexing schemes to access the Reversal Table. ACKNOWLEDGEMENTS This work has been supported by the project TIC20001151-C07-03 of the Plan Nacional of I+D+I of the Spanish Ministry of Science and Technology and by the Spanish CICYT under grant TIC98-0511.
REFERENCES [1] J.L. Aragón, J. González, J.M. García and A. González. “Selective Branch Prediction Reversal by Correlating on Data Values and Control Flow”. Tech.Report #UM-DITEC-2000-08, University of Murcia, 2000. http://ditec.um.es/reportsFiles/ditec/publics/UMDITEC-2000-8.pdf [2] D. Burger and T.M. Austin. “The SimpleScalar Tool Set, Version 2.0”. Technical Report #1342, University of Wisconsing-Madison, Computer Sciences Department, 1997. [3] B. Calder, G. Reinman and D.M. Tullsen. “Selective Value Prediction”. Proc. of the Int. Symp. on Comp. Arch., 1999. [4] P.Y. Chang, M. Evers and Y.N. Patt. “Improving Branch Prediction Accuracy by Reducing Pattern History Table Interference”. Proc. of the Int. Conf. on P.A.C.T., 1996. [5] M. Evers, P.Y. Chang and Y.N. Patt. “Using Hybrid Branch Predictors to Improve Branch Prediction Accuracy in the Presence of Context Switches”. Proc. of the I.S.C.A., 1996. [6] P.N. Glaskowsky. “Pentium 4 (Partially) Previewed”. Microprocessor Report (Microdesign Resources), August 2000. [7] J. González and A. González. “The Potential of Data Value Speculation to Boost ILP”. Proc. of the Int. Conf. on Supercomputing, pp. 21-28, 1998. [8] J. González and A. González. “Control-Flow Speculation through Value Prediction for Superscalar Processors”. Proc. of the Int. Conf. on Parallel Arch. and Compil. Tech., 1999. [9] D. Grunwald, A. Klauser, S. Manne and A. Pleszkun. “Confidence Estimation for Speculation Control”. Proc. of the Int. Symp. on Computer Architecture, 1998. [10] T.H. Heil, Z. Smith and J.E. Smith. “Improving Branch Predictors by Correlating on Data Values”. Proc. of the Int. Symp. on Microarchitecture, 1999. [11] E. Jacobsen, E. Rotenberg and J.E. Smith. “Assigning Confidence to Conditional Branch Predictions”. Proc. of the Int. Symp. on Microarchitecture, 1996. [12] M.H. Lipasti and J.P. Shen. “Exceeding the Dataflow Limit via Value Prediction”. Proc. of the Int. Symp. on Microarchitecture, pp. 226-237, 1996. [13] M.H. Lipasti, C.B. Wilkerson and J.P. Shen. “Value Locality and Load Value Prediction”. Proc. of the Int. Conf. on Architect. Support for Prog. Lang. and Oper. Systems, 1996. [14] S. Manne, A. Klauser and D. Grunwald. “Branch Prediction using Selective Branch Inversion”. Proc. of the Int. Conf. on Parallel Architectures and Compilation Tech., 1999. [15] S. McFarling. “Combining Branch Predictors”. Tech. Report #TN-36. Digital Western Research laboratory, 1993. [16] R. Nair. “Dynamic Path-Based Branch Correlation”. Proc. of the Int. Symp. on Microarchitecture, pp. 15-23, 1995. [17] Y. Sazeides and J.E. Smith. “Modeling Program Predictability”. Proc. of the Int. Symp. on Computer Architecture, pp. 73-84, 1998. [18] E. Sprangle, R.S. Chappell, M. Alsup and Y.N. Patt. “The Agree Predictor: A Mechanism for Reducing Negative Branch History Interference”. Proc. of the I.S.C.A., 1997. [19] J.E. Smith. “A Study of Branch Prediction Strategies”. Proc. of the Int. Symp. on Computer Architecture, 1981. [20] T.Y. Yeh and Y.N. Patt. “A Comparison of Dynamic Branch Predictors that Use Two Levels of Branch History”. Proc. of the Int. Symp. on Comp. Architecture, pp. 257-266, 1993.