Brief Communications
XY Chromosome Sex Systems in the Neogastropods Fasciolaria lignaria and Pisania striata (Mollusca: Prosobranchia) R. Vitturi, M. S. Colomba, V. Caputo, and A. Pandolfo The mitotic and meiotic chromosomes of the neogastropods Fasciolaria lignaria (L. 1758) (Fasciolaridae) and Pisania striata (Gmelin 1791) (Buccinidae) have been analyzed. Both species display 70 chromosomes in spermatogonial mitoses and 35 bivalents in the corresponding spermatocytes. In both F. lignaria and P. striata pair 35 was found to be heteromorphic in the males and homomorphic in the females, thus suggesting that an XY{male}/ XX{female} mechanism of chromosomal sex determination is operating. Data obtained from combined C-banding and chromomycin A3 (CMA3), mithramycin (MM), and DAPI staining suggest that the differentiated Y chromosome of F. lignaria does not possess heterogeneous DNA. The possible origins of XY chromosomes in these neogastropods are discussed in the light of the current views of sex chromosome evolution. Sexual differentiation is one of the most striking developmental processes of living organisms, and in most animal phyla it is typically controlled by morphologically differentiated sex chromosomes ( XY and ZW in male and female heterogamety, respectively). The evolution of sex chromosomes results from restriction in the process of recombination between the original homologous chromosomes (see Singh et al. 1980). In theory, there are three mechanisms capable of restricting recombination between homologous chromosomes: (1) genotypically determined chiasma localization (Singh et al. 1980); (2)
538
structural rearrangements and particularly, pericentric inversions (Ohno 1967); and (3) differential heterochromatinization (John 1986; Jones 1989; Olmo et al. 1987; Sola et al. 1990). Differentiated sex chromosomes are absent in gonochoristic molluscs (White 1973), however, according to recent reports some mollusc genomes have developed chromosome sex systems. For example, chromosome sex system of the XY type was reported in the coenogastropod (mesogastropod) Rissoa ventricosa (Prosobranchia, Rissoidae) ( Thiriot-Quievreux and Ayraud 1982), and a male sex-determining mechanism of the XO type was reported in the archeogastropod Theodoxus meridionalis (Prosobranchia, Neritidae) ( Vitturi and Catalano 1988), in other neritid species ( Nakamura 1983), and in two geographically separated populations of the coenogastropod (mesogastropod) Littorina (Melaraphe) neritoides ( Vitturi et al. 1988, 1995). Moreover, multiple-chromosome sex systems of the X1X2Y{male}/ X1X1X2X2{female} type were found in the heteropod Pterotrachea hyppocampus ( Vitturi et al. 1993). The order Neogastropoda, a large monophiletic group of gastropods living in marine habitats from the high intertidal to the deep sea zones ( Taylor and Morris 1988) is rather well-defined conchologically, morphologically, and anatomically (Andrews 1991; Kantor 1996; Medinskaya 1993; Sysoev and Kantor 1987; Taylor and Morris 1988). Whereas these organisms have not been exhaustively studied from a karyological point of view, the haploid chromosome numbers (n) of about 30 species are known ( Vitturi et al. 1987 and authors quoted therein), as are the diploid numbers (2n) of some Muricoidea, including Buccinulum corneum and Cyclope neritea (2n 5 72) ( Vitturi and Catalano 1990; Vitturi et al. 1987), Nassarius corniculum (Amyclina corniculum) (2n 5 70) ( Vitturi et al. 1987), and the dog whelk (Nucella
lapillus) with 2n morphs ranging from 26 to 36 ( Bantock and Cockaine 1975; Staiger 1954). However, only N. lapillus has been karyotyped ( Dixon et al. 1993) and analyzed using a number of chromosome banding techniques (Pascoe and Dixon 1994; Pascoe et al. 1996). This article describes XY chromosome sex systems in the Muricoidea Fasciolaria lignaria and Pisania striata and compares them with the XY chromosome sex systems of other species. The possible origin of XY chromosomes in these neogastropods is discussed in light of current views of sex chromosome evolution.
Materials and Methods Adult specimens of F. lignaria ( Fasciolaridae) (23 males and 12 females) and P. striata ( Buccinidae) (30 males and 8 females) identified according to the guidelines of Sabelli and Spada (1981, 1986) were collected in the Gulf of Palermo (Sicily, Italy) from November 1993 to April 1996. Once in the laboratory, specimens were treated for 12 h with 0.01% colchicine in 1.5 L seawater at 188C–208C. Then the gonads were removed from each animal under the dissecting microscope at magnification of 203 and treated for 30 min in 0.075 M KCl. Testes and ovaries were then fixed in a freshly prepared mixture of absolute ethyl alcohol and acetic acid in the proportion 3:1 with two changes at 10 min intervals. Chromosome preparations were made according to the air-drying ( Vitturi 1992) and squash techniques ( Vitturi et al. 1991). The air-dried slides were stained with a Giemsa solution (6%, pH 6.8) for a conventional analysis of meiotic chromosomes and a karyotype characterization. The nucleolar organizer regions ( NORs) were stained according to the technique of Howell and Black (1980). The characterization of the constitutive heterochromatin was made following Sumner (1972). Spermatogonial metaphases of F. lignaria
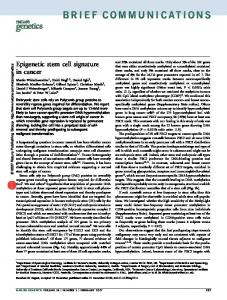
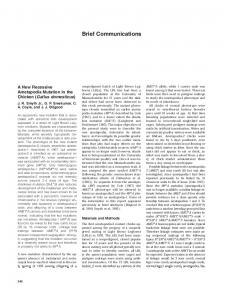
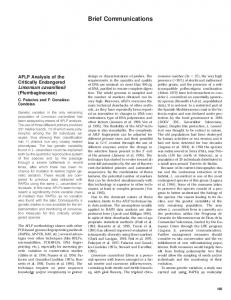
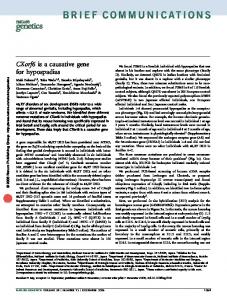
Figure 1. Male Giemsa-stained karyotype of (a) F. lignaria, (b) female sex pair ( XX), (c) male metaphase spread where XY are in a marginal position.
were also stained with fluorochromes, chromomycin A3 (CMA3), mithramycin (MM), and 49,6-diamidino-2-phenylindole ( DAPI) according to Schmid et al. (1983). Chromosomes were classified according to the nomenclature of Levan et al. (1964).
Results Fasciolaria lignaria. Counts of 34 Giemsastained spermatogonial metaphases gave a diploid number of 70. In another five spreads there was a lower number of chromosomes. These five anomalous spreads may be explained as the result of loss during preparation. Five metaphase spreads were compared. On the basis of average dimension and arm ratios of the chromosomes arranged according to size and centromere position, we observed that 34 pairs (pairs 1–34) were homomorphic (autosomes) and decreased progressively from 6.82 6 0.48 (1st pair) to 1.6 6 0.26 mm (34th pair). Of these, 22 were biarmed (SM 1 M) and 12 were monoarmed (ST ), and pair 8
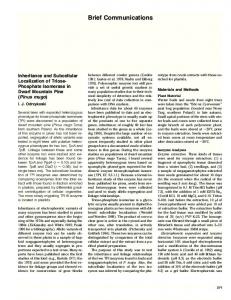
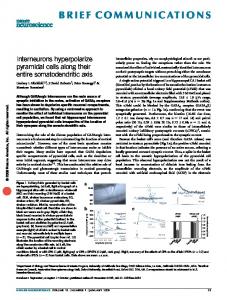
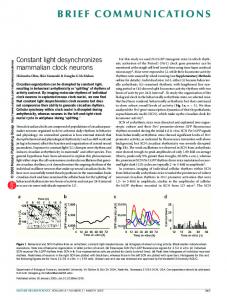
showed one homologue with an evident secondary constriction. Pair 35 was heteromorphic, including a large metacentric chromosome whose average dimension was 11.54 6 0.52 mm and a medium-large submetacentric chromosome whose average dimension was 5.32 6 0.30 mm. These chromosomes were designated X and Y, respectively ( Figure 1a). The large unpaired metacentric of pair 35 in the males was paired with an identical metacentric chromosome in the females ( Figure 1b). Frequently the sex pair ( XY) was located on the border of the spread ( Figure 1c). Mitotic chromosomes of four pairs were shown by silver staining to be involved in nucleolus organization. All consisted of small-sized subtelocentric elements designated a, b, c, and d. In two pairs (cd), the NORs were terminally located on the short arms, whereas in the remaining two (ab), the NORs were subterminal. Four different phenotypes were observed: the first was composed of four chromosomes (aabc) ( Figure 2A), and the other three
Figure 2. Silver-stained spermatogonial metaphase chromosomes of F. lignaria: phenotypes composed of (A) four and (B–D) two chromosomes.
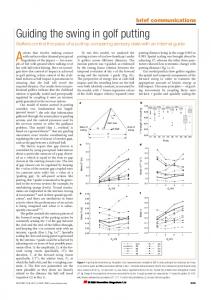
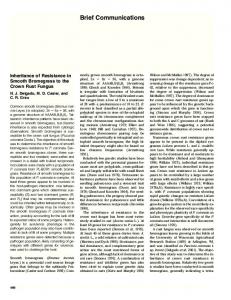
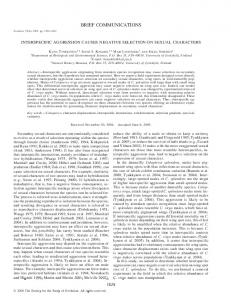
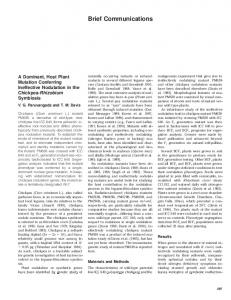
consisted of two chromosomes (dc, ac, cc, respectively) ( Figure 2B–D). Minute and faintly stained C-bands, probably located at the centromeric position, could be seen in certain bivalents at pachytene stage ( Figure 3a), whereas after C banding no visible C-positive bands could be observed at spermatogonial metaphase in the sex pair ( XY) ( Figure 3b). Giemsa-stained diakinetic bivalents were rod, cross, and ring shaped ( Figure 3c). Some elements had condensed to form two deeply stained and closely connected near spherical bodies. Counts of 42 spreads gave the haploid number of 35 bivalents. Counterstaining of spermatogonial metaphases with DA/CMA3 ( Figure 4a), DA/MM ( Figure 4b), and DA/DAPI ( Figure 4c) failed to give positive or negative fluorescence; all chromosomes had a uniform dull fluorescence. Pisania striata. Spermatogonial metaphases (23 spreads analyzed) displayed 70 chromosomes. In this species too, five spreads were compared. The karyogram was constructed by arranging homologous chromosomes in order of decreasing size and centromere position ( Figure 5a). The karyogram consisted of one heteromorphic pair designated as the XY (pair 35) and 34 homomorphic pairs (pairs 1– 34) which progressively decreased from 5.68 6 0.51 (1st pair) to 1.23 6 0.26 (34th
Brief Communications 539
Figure 3. C-banded pachytene bivalents of (a) F. lignaria (arrows indicate some C-positive regions), (b) C-banded spermatogonial XY chromosomes, and (c) Giemsa-stained diakinetic bivalents.
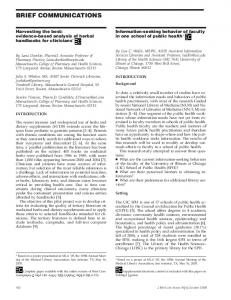
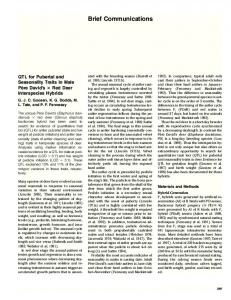
pair), including 27 biarmed (SM 1 M) and 7 monoarmed (ST ) pairs. The large unpaired metacentric chromosomes of pair 35 in the males measured 6.64 6 0.44 mm and appeared in a double dose in the females ( Figure 5b). This was designated X, while a microchromosome of about 0.54 6 0.14 mm (occurring only in the males) was labeled Y. Silver staining in P. striata seemingly showed a single NOR phenotype composed of three small-sized chromosomes belonging to two different pairs (abb). Silver signals were consistently located on the terminal region of the short arms of these chromosomes ( Figure 5c). The presence of diffuse silver proteins could be observed in pachytene chromosomes ( Figure 6a). At this stage the sex bivalent exhibited a characteristic morphology, since the extremities of the Y were connected to the terminal regions of the X ( Figure 6b,c, see arrows), while a large interstitial region of this chromosome was unpaired, thus presenting an unusual and distinctive tangled morphology ( Figure 6d, see thick arrow).
Since the sex chromosomes were associated only at their distal regions ( Figure 6e,f ), the sex chromosomes could also be identified at diakinesis. At this stage too, after silver staining, minute amounts of silver-stained proteins could be observed in all bivalents. Their counts gave the haploid number of 35 (20 spreads analyzed). In P. striata, as in F. lignaria, C-banding revealed constitutive heterochromatin as faint, small, C-positive bands at pachytene stage ( Figure 6g, see arrows).
Discussion Irrespective of sex, F. lignaria and P. striata show a diploid number of 70, which is in line with the finding of 35 bivalents in the correspondent spermatocytes. The karyotype of each species consists of 34 homomorphic pairs (pairs 1–34) and one heteromorphic pair (pair 35) in the males, and 35 homomorphic pairs in the females. From these results two main conclusions can be drawn: (1) F. lignaria and P. striata have achieved a cytological mechanism for sex determination by develop-
Figure 4. Fluorochrome stained spermatogonial metaphase of F. lignaria with (a) CMA3, (b) MM, and (c) DAPI.
540 The Journal of Heredity 1998:89(6)
ing morphologically differentiated sex chromosomes; and (2) since heteromorphism of pair 35 is restricted to the male sex, an XY{male}/XX{female} mechanism of chromosomal sex determination where the male is heterogametic and the female homogametic is operating in both species. In F. lignaria the large metacentric chromosome of pair 35 occurred either paired with an identical metacentric chromosome in the females or with a mediumlarge submetacentric chromosome in the males; the large metacentric was designated X, while the medium-large submetacentric was designated Y. Similar considerations lead to conclude that in P. striata, the X is a large metacentric, while the Y is a microchromosome. To our knowledge, these are the first examples of differentiated sex chromosomes in neogastropods. Two additional observations deserve to be noted. The first is that in F. lignaria, the sex pair often occupies the border of the spread at spermatogonial metaphase. This has been reported as a sex-specific feature in other animals (Mansueto and Vitturi 1989; Vitturi and Catalano 1988). The second is that the sex bivalent of P. striata is distinctly recognizable during meiosis. It is widely agreed that when the sex chromosomes ( XY or ZW) are indistinguishable or only slightly heteromorphic, they represent a primitive state of sex chromosome evolution [see the articles by Olmo et al. (1987), Sola et al. (1990), and Volpi et al. (1992)]. This condition was not observed for the sex pair of F. lignaria and P. striata. In fact, although XY differentiation was expressed to a different degree in the two species, these chromosomes were always distinctly heteromorphic for size and shape. If, as in vertebrates (Singh et al. 1980), we assume that sex chromosome differentiation proceeds from homomorphism to heteromorphism, then a progressive re-
Figure 5. Male Giemsa-stained karyotype of (a) P. striata, (b) female sex pair ( XX), and (c) silver-stained spermatogonial metaphase chromosomes representing a phenotype composed of three chromosomes (a,b,b).
duction in the size of the Y chromosome in these Muricoidea must be postulated. In these organisms, evolution of sex chromosomes would have proceeded from a condition of undifferentiated homomorphic chromosomes, such as that reported in Buccinulum corneum ( Vitturi and Catalano 1990), to the condition that is found in F. lignaria where the Y is intermediate in size between macro- and microchromosomes. The end point of this process would be the condition found in P. striata in which the Y is comparable in size with a microchromosome. Comparative cytogenetic studies on further species of Muricoidea, other than on other neogastropods, are required to determine whether the XY heteromorphism of F. lignaria and P. striata is present in other species or whether other interesting stages of sex chromosome differentiation are conserved in neogastropods. The genomes of both F. lignaria and P. striata contain low heterochromatin amounts, as the minute C-bands in pachytene bivalents of these species show. In addition, the analysis of C-banded sper-
Figure 6. Silver-stained pachytene bivalents of P. striata with (a) diffuse silver signals, (b) visible sex pair (arrows indicate terminal pairing among X and Y chromosomes), (c) enlargement of the sex bivalent represented in ( b), (d) sex pair where the unpaired region of the X shows a tangled morphology (see arrow), (e) silver-stained diakinetic bivalents with diffuse small silver signals (arrow indicates the XY sex bivalent), (f) Giemsa-stained sex bivalent, (g) C-banded pachytene bivalents (arrows indicate some Cpositive regions).
Brief Communications 541
matogonial metaphases indicates that the Y of F. lignaria lacks evident heterochromatic regions. This implies that in this species, the Y is almost totally euchromatic, a feature which does not fit the evolutionary model of heterochromatinization of the Y chromosomes proposed for vertebrates (Olmo et al. 1987; Singh et al. 1980). In response to the question of whether the C-banding method employed in this study may be inadequate for the heterochromatic characterization of the species investigated here, it may be pointed out that the same technique has been successfully employed in other mollusc species ( Vitturi et al. 1991, 1993). Not only C banding, but also chromosome staining of spermatogonial metaphases of F. lignaria with fluorochromes of different specificities such as DAPI (AT specific), CMA3, and MM (GC specific) demonstrate the lack of a DNA heterogeneity in the genome of F. lignaria. In fact, all spermatogonial chromosomes fluoresced homogeneously. This result allows us to conclude that the DNA of F. lignaria possesses interspersed AT and GC base pairs. Moreover, the complete absence of an AT- or GC-rich DNA compartmentalization contrasts with results reported for other species where an rDNA rich in GC base pairs ( NORs) (Amemiya and Gold 1986; Phillips et al. 1988; Schmid et al. 1995) and heterochromatins rich either in AT or GC base pair ( Barros and Pattons 1985; Heng and Hsui 1983; John et al. 1985; Mayr et al. 1984; Schmid and Guttenback 1988) could be observed. The data from combined C-banding and fluorochrome staining suggest that accumulation of sex-specific repetitive DNA sequences may be excluded in differentiated Y chromosome of F. lignaria, unless repetitive DNA of this species escapes demonstration by these methods. Thus as an alternative to the hypothesis of heterochromatinization, it may be suggested that the XY heteromorphism of this species be attributed to a loss of euchromatin (presumably located in an interstitial position) from the undifferentiated Y (as shown in the diagram in Figure 7). Similarly, the differentiation of Y in P. striata would have come about through the loss of its interstitial region. This model seems to be supported by the examination of pachytene chromosomes of this species; here, in fact, the minute Y was found to conserve homology with the terminal regions of the X. The analyses of silver-stained chromo-
542 The Journal of Heredity 1998:89(6)
Figure 7. Scheme showing the hypothetical evolutionary trend from the undifferentiated sex-chromosome to the Y chromosome in F. lignaria.
some preparations lead to two further considerations. The first is that, in F. lignaria, there is an intrapopulational polymorphism in the number of NORs per cell. On the whole, this feature has regularly been reported for those species where more than one chromosome pair is involved in nucleolar organization (Sella et al. 1995; Vitturi et al., 1996, and authors quoted therein). Second, diffuse silver staining at both pachytene and diakinesis is found in P. striata. This, however, might be attributed to the occurrence of silver proteins previously identified in mammals as nucleolin/C23 and B23 ( Hernandez-Verdun et al. 1993), which may not be directly related to the presence of rDNA. This feature, however, deserves to be further investigated by means of in situ hybridization techniques ( FISH) using ribosomal probes. From the Institute of Zoology, University of Palermo, Via Archirafi 18, 90123 Palermo, Italy ( Vitturi, Colomba, and Pandolfo), and the Institute of Biology and Genetics, University of Ancona, Ancona, Italy (Caputo). We would like to thank N. J. Hyde for helping with our English. This study is supported by an M.U.R.S.T. grant. Address correspondence to R. Vitturi at the address above or e-mail:
[email protected]. q 1998 The American Genetic Association
References Amemiya CT and Gold JR, 1986. Chromomycin A3 stains nucleolar organizer regions of fish chromosomes. Copeia 1986:226–231. Andrews EB, 1991. The fine structure and function of the salivary glands of Nucella lapillus (Gastropoda: Muricidae). J Mollus Stud 57:111–126. Bantock CR and Cockaine WC, 1975. Chromosomal polymorphism in Nucella lapillus. Heredity 34:231–245. Barros MA and Patton JL, 1985. Genome evolution in pocket gophers (genus Thomomys). III. Fluorochromerevealed heterochromatin heterogeneity. Chromosoma 92:337–343. Dixon DR, Pascoe PL, Gibbs PE, and Pasantes J, 1993. The nature of Robertsonian chromosomal polymorphism in Nucella lapillus: a re-examination. In: Genetics
and evolution of aquatic organisms ( Beaumont A, ed). London: Chapman & Hall; 389–399. Heng HHQ and Hsui L, 1993. Modes of DAPI banding and simultaneous in situ hybridization. Chromosoma 102:325–332. Hernandez-Verdun D, Roussel P, and Gautier T, 1993. Nucleolar proteins during mitosis. In: Chromosomes today (Sumner AT and Chandley AC, eds). London: Chapman & Hall; 79–90. Howell WM and Black DA, 1980. Controlled silver staining of nucleolus organizer regions with a protective colloidal developer: a 1-step method. Experientia 36:1014– 1015. John B, 1986. The biology of heterochromatin. In: Heterochromatin molecular and structural aspects ( Verma RS, ed). Cambridge: Cambridge University Press; 1– 147. John B, King M, Schweizer D, and Mendelak M, 1985. Equilocality of heterochromatin distribution and heterochromatin heterogeneity in acridid grasshoppers. Chromosoma 91:185–200. Jones KW, 1989. Inactivation phenomena in the evolution and functions of sex chromosomes. In: Evolutionary mechanisms in sex determination (Wachtel SS, eds). Boca Raton, Florida: CRC Press; 69–90. Kantor YI, 1996. Phylogeny and relationships of Neogastropoda. In: Origin and evolutionary radiation of the Mollusca ( Taylor J, ed). New York: Oxford University Press; 221–230. Levan A, Fredga K, and Sandberg AA, 1964. Nomenclature for centromeric position of chromosomes. Hereditas 52:201–220. Mansueto C and Vitturi R, 1989. NORs location and Cbanding pattern in spermatogenesis of Pamphagus ortolani (Orthoptera, Acrididae). Caryologia 42:303–311. Mayr B, Schweizer D, and Geber G, 1984. NOR activity, heterochromatin differentiation and the Robertsonian polymorphism in Sus scrofa L. J Hered 75:79–80. Medinskaya AI, 1993. Anatomy of the stomach of some Neogastropoda of the offshore zones of the Japan Sea. Ruthenica, Rus Malacol J 3:17–24. Nakamura HK, 1983. Karyological studies of Neritidae (Streptoneura, Archaeogastropoda) I. Chromosomes of five species from Hong Kong, with special reference to the sex chromosomes. Proceedings of the Second International Workshop on the Malacofauna of Hong Kong 1983:257–273. Ohno S, 1967. Sex chromosomes and sex-linked genes. Berlin: Springer Verlag. Olmo E, Odierna G, and Capriglione T, 1987. Evolution of sex chromosomes in lacertid lizards. Chromosoma 96:33–38. Pascoe PL and Dixon DR, 1994. Structural chromosomal polymorphism in the dog-whelk Nucella lapillus (Mollusca, Neogastropoda). Mar Biol 118:247–253.
Pascoe PL, Patton SJ, Critcher R, and Dixon DR, 1996. Robertsonian polymorphism in the marine gastropod, Nucella lapillus: advances in karyology using rDNA loci and NORs. Chromosoma 104:455–460.
Vitturi R, Colombera D, Catalano E, and Amico FP, 1991. Spermatocyte chromosome analysis of Helicella virgata (Pulmonata: Helicidae): silver-stained and C-banded chromosomes. J Hered 82:339–343.
are a useful tool for studying the genetic relationships among chicken breeds.
Phillips RB, Pleyte KA, and Hartleys E, 1988. Stock-specific differences in the number of chromosome positions of the nucleolar organizer regions in arctic char (Salvelinus alpinus). Cytogenet Cell Genet 48:9–12.
Vitturi R, Libertini A, Mazzola A, Colomba MS, Sara` G, 1996. Characterization of mitotic chromosomes of four species of the genus Diplodus Rafinesque, 1810 (Pisces, Sparidae): karyotypes and chromosomal nucleolar organizer region ( NOR) phenotypes. J Fish Biol 49:1128– 1137.
Japan was essentially isolated from the outside world from 1635 to 1854. In that period many unique breeds were developed for special plumage, crowing, and cockfighting. There are more than 30 distinctive breeds. Seventeen of them have been designated as national treasures of Japan. Since most Japanese chicken breeds have low egg production and meat yield, many of these breeds are in danger of disappearing. They are valuable as genetic resources and are being conserved within the Ministry of Agriculture, Forestry and Fisheries (MAFF). The National Institute of Agrobiological Resources of MAFF has been collecting semen of various Japanese breeds and preserves samples in a frozen state. To date 14 breeds (3 varieties) are conserved. Genetic relationships among Japanese native breeds of chickens have been studied based on blood protein polymorphisms ( Hashiguchi et al. 1981; Okada et al. 1980; Tanabe and Mizutani 1980). However, these reports indicated a limited number of polymorphic loci and alleles per loci, so consensus about the genetic relationships among breeds of Japanese native chickens has not been established. In addition, the results of earlier reports do not agree with the morphological characteristics of breeds. Microsatellite repeat sequences, for example, (CA)n repeats, are well dispersed in the genome, highly polymorphic, and have been shown to be powerful tools in genome mapping of chickens (Cheng et al. 1995). The application of the microsatellites to characterize chicken breeds is relatively recent. Recently we reported an efficient method for cloning microsatellites in chickens ( Takahashi et al. 1996). The purpose of this study is to define the genetic relationships among Japanese native breeds of chickens on the basis of microsatellite DNA polymorphisms.
Sabelli B and Spada G, 1981. Guida illustrata all’identificazione delle conchiglie del Mediterraneo. Boll Malac (Suppl) XVII(3–4) G.I. 18 Sabelli B and Spada G, 1986. Guida illustrata all’identificazione delle conchiglie del Mediterraneo. Boll Malac. (Suppl) XXII(1–4) G.I. 22. Schmid M and Guttenbach M, 1988. Evolutionary diversity of reverse (R) fluorescent chromosome bands in vertebrates. Chromosoma 97:101–114. Schmid M, Feichtinger W, Weimer R, Mais C, Bolan˜os F, and Leon P, 1995. Chromosome banding in Amphibia. XXI. Inversion polymorphism and multiple nucleolus organizer regions in Agalychnis callidryas (Anura, Hylidae). Cytogenet Cell Genet 69:18–26. Schmid M, Haaf T, Geile B, and Sims S, 1983. Chromosome banding in Amphibia. VII. an unusual XY/XX sex chromosome system in Gastrotheca riobambae (Anura, Hylidae). Chromosoma 88:69–82. Sella G, Vitturi R, Ramella L, Colomba MS. 1995. Chromosomal nucleolar organizer region ( NOR) phenotypes in nine species of the genus Ophryotrocha (Polychaeta, Dorvilleidae). Mar Biol 124:425–433. Singh L, Purdom IF, and Jones KW, 1980. Sex chromosomes associated satellite DNA: evolution and conservation. Chromosoma 79:137–157. Sola L, Monaco PJ, and Rasch EM, 1990. Cytogenetics of bisexual/unisexual species of Poecilia. 1. C-bands, Ag-NOR polymorphism, and sex chromosomes in three populations of Poecilia latipinna. Cytogenet Cell Genet 53:148–154. Staiger H, 1954. Der chromosomendimorphismus beim Prosobranchier Purpura lapillus in Beziehung zur o¨kologie der Art. Chromosoma 6:419–478. Sumner AT, 1972. A simple technique for demonstrating centromeric heterochromatin. Exp Cell Res 101:235– 243. Sysoev AV and Kantor YI, 1987. Deep-sea gastropods of the genus Aforia ( Turridae) of the Pacific: species composition, systematics, and functional morphology of the digestive system. Veliger 30:105–126. Taylor JD and Morris NJ, 1988. Relationships of Neogastropoda. Malacol Rev 4(suppl):167–179. Thiriot-Quievreux C and Ayraud N, 1982. Les karyotypes de quelques espe`ces de bivalves et de gaste`ropodes marins. Mar Biol 70:165–172. Vitturi R, 1992. Conventionally stained chromosomes, constitutive heterochromatin and nucleolus organizer regions in Milax nigricans (Gastropoda, Pulmonata). Chromatin 1:147–155. Vitturi R and Catalano E, 1988. A male XO sex-determining mechanism in Theodoxus meridionalis ( Neritidae) (Prosobranchia, Archaeogastropoda). Cytologia 53:131–138. Vitturi R and Catalano E, 1990. Spermatocyte chromosome banding studies in Buccinulum corneum (Prosobranchia: Neogastropoda): variation in silver-NOR banding pattern. Mar Biol 104:259–263. Vitturi R, Catalano E, Colombera D, Avila AL, and Fuca` A, 1993. Multiple sex-chromosome system of Pterotrachea hippocampus (Mollusca: Mesogastropoda). Mar Biol 115:581–585. Vitturi R, Catalano E, Macaluso M, and Maiorca A, 1987. Spermatocyte chromosomes in six species of Neogastropoda (Mollusca, Prosobranchia). Biol Zent bl 106: 81–88. Vitturi R, Catalano E, Macaluso M, and Zava B, 1988. The karyology of Littorina neritoides ( Linnaeus, 1758) (Mollusca, Prosobranchia). Malacologia 29:319–324.
Vitturi R, Libertini A, Panozzo M, and Mezzapelle G. 1995. Karyotype analysis and genome size in three Mediterranean species of periwinkles (Prosobranchia: Mesogastropoda). Malacologia 37:123–132. Volpi EV, Pelliccia F, Lanza V, Di Castro M, and Rocchi A, 1992. Morphological differentiation of a sex chromosome and ribosomal genes in Asellus aquaticus (Crust. Isop.). Heredity 69:478–482. White MJD, 1973. Animal cytology and evolution, 3rd ed. Cambridge: Cambridge University Press. Received February 10, 1997 Accepted February 24, 1998 Corresponding Editor: Oliver A. Ryder
Genetic Relationships Among Japanese Native Breeds of Chicken Based on Microsatellite DNA Polymorphisms H. Takahashi, K. Nirasawa, Y. Nagamine, M. Tsudzuki, and Y. Yamamoto Genetic relationships among Japanese native breeds of chickens were studied on the basis of microsatellite DNA polymorphisms. DNA samples from 10 Japanese native breeds (Iwate-Jidori, Aizu-Jidori, Sadohige-Jidori, Siba-Tori, Onaga-Dori, Echigonankin, Hinai, Kinpa, Koeyoshi, and Tomaru) and one imported breed (White Leghorn) were analyzed using eight microsatellite markers that were isolated from a microsatellite DNA-enriched library of chickens (Takahashi et al. 1996). The PCR primers to detect (CA)n repeat length polymorphisms were synthesized based on the sequences of clones, and these markers were typed by PCR amplification and electrophoresis using a DNA sequencer. Since all eight microsatellite markers were polymorphic, genetic distance between the breeds could be calculated based on the frequencies of alleles of the microsatellites and phylogenetic relationships between the breeds could be estimated. Most Japanese native chickens were grouped into three groups that correspond to the origin breeds, Jidori, Shokoku, and Shamo. The results suggest that microsatellite DNA markers
Materials and Methods Samples We studied unrelated chickens belonging to 10 breeds (11 populations) of Japanese native chickens: Iwate-Jidori (19 individuals), Aizu-Jidori (20), Sadohige-Jidori (22), Siba-Tori (16), Onaga-Dori [sampled in Kochi Prefecture (22) and Fukushima Prefecture (15)], Echigonankin (12), Hinai (15), Kinpa (22), Koeyoshi (24), Tomaru (15), and one imported breed—White Leghorn
Brief Communications 543
Table 1. Polymerase chain reaction (PCR) primers for microsatellite markers
a b
Clone
GenBanka
Repeat
Forward primer
Reverse primer
Alleles
Rangeb
1 2 3 4 5 6 7 8
U60782 U60783 U60786 U60787 U60791 U60792 U60793 AF012928
(CA)12 (CA)9 (CA)11 (CA)8 (CA)9 (CA)12 (CA)8 (CA)11
59-TTTCACACGCAGCCTTTCTCCCG-39 59-GTGCAGCTCAGTTGGACACACGC-39 59-CAACTTCACTGCCTTCCCATTTG-39 59-GATGCCCTCAGCCACCAGCCCT-39 59-TTAGCAAGGATAGGGGTGGAACA-39 59-GTCCTTTCTCTGTCCTTCCCACT-39 59-AGAGGTGGGCAGGTGGGCATGAG-39 59-GTTGTGGTGGGCTCGTTTGTCTG-39
59-GTCATTCCTGCCTCCCCTTGAC-39 59-CAGCGGGTAACGGCGGCGGGACA-39 59-AACAGAGGAGAAATGGGAATAGTG-39 59-CACCCAGCAAACAGGAGCCCAC-39 59-AACAGAGAACACACTACGCAGCCT-39 59-GTCTTGCTTCTAGGAGTCAGGCT-39 59-CAGCATCCTTAATAGCAGTTTTCC-39 59-GTGGGGAAACCGAAAGCACCG-39
6 10 5 2 6 7 4 5
120–130 72–100 114–126 144–146 93–103 144–158 174–180 110–120
GenBank accession number. Allele size ranges and means are in DNA base pairs.
[a strong egg shell line (24) and a weak egg shell line (24)]. The two lines of White Leghorn were developed by two-way selection for egg shell strength with nondestructive deformation ( Nirasawa et al. 1995).
Detection of Chicken Microsatellite DNA Polymorphisms From a (CA)n-enriched library ( Takahashi et al. 1996), eight clones were randomly selected and the nucleotide sequences were determined. The sequences have
been registered in GenBank with accession numbers U60782, U60783, U60786, U60787, U60791, U60792, U60793, and AF012928. The primer sequences for PCR are shown in Table 1. The PCR primer pairs of the clones to detect (CA)n repeat
Table 2. Gene frequencies at the microsatellite DNA loci in each population
Marker U60782
U60783
U60786
U60787 U60791
U60792
U60793
AF012928
Size ( bp)
IwateJidori
AizuJidori
Sadohige- SibaJidori Tori
120 122 124 126 128 130 72 74 76 80 82 84 86 88 98 100 114 120 122 124 126 144 145 93 95 97 99 101 103 144 146 148 150 152 154 158 174 176 178 180 110 114 116 118 120
0.0000 0.0000 0.1316 0.0526 0.8158 0.0000 0.0000 0.0000 0.0000 0.0000 0.0000 1.0000 0.0000 0.0000 0.0000 0.0000 0.2105 0.7895 0.0000 0.0000 0.0000 0.6053 0.3947 0.2368 0.6842 0.0000 0.0789 0.0000 0.0000 0.0000 0.1842 0.0000 0.2368 0.3684 0.0000 0.2105 0.1053 0.0000 0.8947 0.0000 0.2895 0.0000 0.0000 0.0789 0.6316
1.0000 0.0000 0.0000 0.0000 0.0000 0.0000 0.0000 0.0000 0.5500 0.0000 0.4500 0.0000 0.0000 0.0000 0.0000 0.0000 0.3000 0.1500 0.0000 0.0000 0.5500 0.3250 0.6750 0.0000 0.5500 0.2250 0.2250 0.0000 0.0000 0.0000 0.0000 0.0000 1.0000 0.0000 0.0000 0.0000 0.0000 0.0000 1.0000 0.0000 0.1250 0.0000 0.4250 0.0000 0.4500
0.0455 0.0909 0.2727 0.5909 0.0000 0.0000 0.0000 0.0909 0.0000 0.1136 0.0227 0.0000 0.5227 0.0000 0.2500 0.0000 0.1818 0.2500 0.4773 0.0909 0.0000 0.8409 0.1591 0.0000 0.8636 0.0000 0.1364 0.0000 0.0000 0.9091 0.0000 0.0000 0.0000 0.0000 0.0000 0.0909 0.0455 0.6136 0.0000 0.3409 0.1136 0.5909 0.2045 0.0455 0.0455
544 The Journal of Heredity 1998:89(6)
0.0000 0.0000 0.0000 0.4063 0.4375 0.1563 0.0000 0.0000 0.3438 0.0000 0.0000 0.0313 0.0000 0.4063 0.0000 0.2188 0.0000 0.3438 0.0625 0.5938 0.0000 0.6563 0.3438 0.0000 0.9688 0.0313 0.0000 0.0000 0.0000 0.1250 0.0313 0.0000 0.5625 0.0000 0.0000 0.2813 0.9063 0.0000 0.0938 0.0000 0.5938 0.0000 0.0938 0.2813 0.0313
Onaga-Dori
White Leghorn
Kochi
EchigoFukushima nankin
Hinai
Kinpa
Koeyoshi
Tomaru
Strong Egg Weak Egg
0.0909 0.0000 0.0000 0.0682 0.8409 0.0000 0.0000 0.0000 0.0000 0.0000 0.0000 0.4773 0.3182 0.1818 0.0000 0.0227 0.0455 0.9091 0.0227 0.0000 0.0227 0.3182 0.6818 0.0000 0.8409 0.0909 0.0682 0.0000 0.0000 0.1136 0.0000 0.0227 0.2273 0.6136 0.0000 0.0227 0.2727 0.0000 0.7273 0.0000 0.0682 0.0000 0.4318 0.0455 0.4545
0.1333 0.0000 0.0000 0.3000 0.5667 0.0000 0.0000 0.0000 0.0333 0.0000 0.1000 0.7333 0.1333 0.0000 0.0000 0.0000 0.0667 0.8667 0.0000 0.0000 0.0667 0.3000 0.7000 0.0000 0.8333 0.1333 0.0333 0.0000 0.0000 0.0000 0.0000 0.0000 0.2000 0.8000 0.0000 0.0000 0.5333 0.0000 0.4667 0.0000 0.1000 0.0000 0.2333 0.0000 0.6667
0.0333 0.0000 0.0000 0.9667 0.0000 0.0000 0.0000 0.0000 0.0333 0.0000 0.6667 0.0000 0.2333 0.0667 0.0000 0.0000 0.0000 0.7333 0.1333 0.0667 0.0667 0.0333 0.9667 0.0000 0.7333 0.2333 0.0000 0.0333 0.0000 0.2333 0.0000 0.0000 0.1667 0.5667 0.0000 0.0333 1.0000 0.0000 0.0000 0.0000 0.1667 0.0000 0.7667 0.0333 0.0333
0.0000 0.0000 0.0455 0.0000 0.9545 0.0000 0.0000 0.4545 0.0000 0.0000 0.0000 0.3636 0.1818 0.0000 0.0000 0.0000 0.0909 0.5909 0.3182 0.0000 0.0000 0.0000 1.0000 0.0000 1.0000 0.0000 0.0000 0.0000 0.0000 0.0000 0.0000 0.0000 0.0000 0.2955 0.0000 0.7045 0.0000 0.0000 1.0000 0.0000 0.1591 0.0000 0.4091 0.4318 0.0000
0.5208 0.0000 0.0000 0.0000 0.4792 0.0000 0.0000 0.0000 0.0208 0.0000 0.0000 0.5625 0.1875 0.2292 0.0000 0.0000 1.0000 0.0000 0.0000 0.0000 0.0000 0.0000 1.0000 0.0000 0.9792 0.0208 0.0000 0.0000 0.0000 0.4375 0.0000 0.0000 0.5625 0.0000 0.0000 0.0000 0.5000 0.0000 0.5000 0.0000 0.0000 0.0000 0.5833 0.4167 0.0000
0.4000 0.0000 0.0000 0.0000 0.0000 0.6000 0.0000 0.0000 0.0000 0.0000 0.1333 0.0000 0.0000 0.8667 0.0000 0.0000 1.0000 0.0000 0.0000 0.0000 0.0000 0.0000 1.0000 0.0000 0.7333 0.0667 0.0000 0.2000 0.0000 0.0000 0.0000 0.0000 0.0000 0.3667 0.1000 0.5333 0.0000 0.0000 1.0000 0.0000 0.9000 0.0000 0.0000 0.1000 0.0000
0.2500 0.0000 0.3333 0.0000 0.0000 0.4167 0.0000 0.0000 0.0000 0.0000 0.3958 0.0000 0.0000 0.6042 0.0000 0.0000 0.0000 0.8333 0.1667 0.0000 0.0000 0.9583 0.0417 0.0000 0.0000 1.0000 0.0000 0.0000 0.0000 0.0000 0.0000 0.0000 0.0000 0.0000 0.0000 1.0000 0.0000 0.0000 1.0000 0.0000 0.0000 0.0000 0.6667 0.0000 0.3333
0.5000 0.0000 0.2917 0.0000 0.2083 0.0000 0.0833 0.0000 0.1667 0.0000 0.0000 0.7500 0.0000 0.0000 0.0000 0.0000 0.0000 0.4583 0.5417 0.0000 0.0000 0.0000 1.0000 0.0000 0.7500 0.0000 0.0000 0.0000 0.2500 0.2500 0.5000 0.0000 0.0833 0.0000 0.0000 0.1667 0.0000 0.0000 1.0000 0.0000 0.0000 0.0000 0.8750 0.0833 0.0417
0.1042 0.0000 0.1458 0.0000 0.0000 0.7500 0.0000 0.0000 0.0000 0.0000 0.4583 0.0000 0.0000 0.5417 0.0000 0.0000 0.0000 0.5833 0.0000 0.4167 0.0000 0.9583 0.0417 0.0000 0.0000 1.0000 0.0000 0.0000 0.0000 0.0000 0.0000 0.0000 0.2500 0.0000 0.0000 0.7500 0.0000 0.0000 1.0000 0.0000 0.0000 1.0000 0.0000 0.0000 0.0000
length polymorphisms were synthesized and 59 ends of CA strand primers (forward primers) were fluorescently labeled. Chicken genomic DNA used as a template for the PCR reaction was isolated from blood using a DNA isolation kit (SepaGene, Sanko Jyunyaku, Japan). PCR was performed: 9 min (948C) and 35 cycles of 30 s (948C), 30 s (628C), and 1 min (728C). A reaction value of 20 ml contained 50 ng genomic DNA, 1.5 mM MgCl2, 50 mM KCl, 10 mM Tris-HCl (pH 8.3), 0.001% gelatin, 100 mM dNTP, 0.025 U of AmpliTaq Gold (Perkin Elmer) and 25 pmols of each primer. PCR products were separated on 6% Long Rangery gel (AT Biochem) containing 8 M urea. Analyses of fragments were performed using an automated DNA sequencer (A.L.F.II, Pharmacia, Sweden) and a computer program ( Fragment Manager, Pharmacia, Sweden). Statistics Alleles were designated according to PCR product size and allelic frequencies were estimated by directly counting. Genetic differences among populations were studied by calculating the DA distance ( Nei 1983). Takezaki and Nei (1996) studied the efficiencies of several genetic distance measures, for example, DA ( Nei et al. 1983), DC (Cavalli-Sforza and Edwards 1967), DSW (Shriver et al. 1995), and (dm)2 (Goldstein et al. 1995), when they are applied to microsatellite DNA loci. Their computer simulation showed that DA and DC distance are most efficient in obtaining the correct tree topology. Since the DA distance is the modified DC distance, we chose the DA distance in this study. From the distances, a majority-rule consensus tree based on 1000 bootstrap replicates was constructed by the neighbor-joining ( NJ) method (Saitou and Nei 1987) incorporated into the ‘‘njbafd’’ and ‘‘treeview’’ programs (provided by Dr. N. Takezaki, National Institute of Genetics, Mishima, Japan).
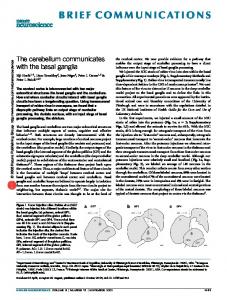
Results and Discussion All eight microsatellites examined were polymorphic. A total of 45 alleles were detected and the average number of alleles per locus was 5.6 ( Table 1). Gene frequencies at the microsatellite DNA loci in each population are shown in Table 2. Excepting Aizu-Jidori and Tomaru, Japanese chicken breeds and White Leghorn were clearly separated from each other ( Figure 1). Within Japanese native breeds, three groups could be differentiated: (1) Sado-
Figure 1. NJ dendrograms of Japanese native chickens and White Leghorn based on DA ( Nei 1983). Numbers on the nodes are percentage bootstrap values from 1,000 replications of resampled loci.
hige-Jidori, Hinai and Siba-Tori; (2) IwateJidori and Onaga-Dori; and (3) Echigonankin and Kinpa. Koeyoshi was close to the second and third groups. There are no indigenous chickens in Japan in the true sense of the word. Chicken breeds in Japan were introduced into Japan at various times. Most of today’s Japanese chicken breeds were established from three original breeds, Jidori, Shokoku, and Shamo ( Koana 1951). Jidori means indigenous chicken and retains primitive chicken characteristics. Jidori is thought to have been introduced into Japan from China about 2,000 years ago. Shokoku, which have long hackle and saddle feathers, is thought to have been introduced into Japan from China between the 8th and 12th centuries. Some varieties of Shokoku were exported from Japan to other countries in the 19th century and their offspring are known as Phoenix and Yokohama ( Hawksworth 1994; Stromberg 1996). Shamo is thought to be derived from a Malay-type chicken introduced into Japan from Thailand in the 16th or 17th century for cockfighting. In addition, other types of breeds such as Oh-Tomaru, Chabo, and Silky were introduced into Japan from China. During Japan’s period of isolation (1635–1854), breeds were crossed to improve plumage, crowing, or cockfighting ability, resulting in more than 30 breeds of chicken being recognized. Since most Japanese chicken breeds are crossbreeds of imported breeds and closely related to each other, it is difficult to identify
the origin of each Japanese chicken breed. There are some reports concerning genetic relationships among Japanese chicken breeds based on blood protein polymorphisms ( Hashiguchi et al. 1981; Okada et al. 1980; Tanabe and Mizutani 1980). Although some breeds were common to all of these studies, the results were inconsistent. Our study demonstrates for the first time that the main breeds of Japanese chickens can be distinguished using microsatellite DNA polymorphisms. Compared to morphological characteristics of breeds ( Koana 1951), the three groups of Japanese chickens based on microsatellite markers correspond to the original breed: the first group (Sadohige-Jidori, Hinai, and Siba-Tori) corresponds to Jidori, the second group ( Iwate-Jidori and Onaga-Dori) corresponds to Shokoku, and the third group ( Kinpa and Echigonankin) corresponds to Shamo. Siba-Tori is a variety of Jidori that originated in Niigata Prefecture. Sadohige-Jidori is thought to be an isolated breed of Siba-Tori on Sado island. Beard (hige in Japanese) is a special characteristic of Sadohige-Jidori. Hinai is a meat type breed established in Akita Prefecture, which is near Niigata Prefecture. This breed was thought to be established by crossing Jidori with Shamo. Our results do not contradict the presumed histories of the three breeds. Onaga-Dori (long tail fowl) is the most famous Japanese breed because males have very long tail feathers. The main tail
Brief Communications 545
feathers of males do not molt and can grow by 90 cm each year. The tail feathers sometimes grow longer than 8 m, and the record is 12 m. This breed is thought to have originated by mutation from Shokoku and was established in Kochi Prefecture in the 18th century ( Koana 1951). Iwate-Jidori was found in Iwate Prefecture in 1975, and was believed to be a variety of Jidori and was honored as a poultry treasure of Japan in 1984. However, in this study, the genetic distance between Iwate-Jidori and Onaga-Dori was found to be relatively close. This suggests that Iwate-Jidori may be a variety of Shokoku or a crossbreed between Shokoku and other breeds. Kinpa and Echigonankin are small varieties of Shamo. Kinpa can be found in Akita Prefecture and Echigonankin can be found in Niigata Prefecture. Our results agree with the morphological characteristics of the breeds. Koeyoshi, found in Akita and Aomori Prefectures, is famous for the prolonged crowing ability of males. Although the history of Koeyoshi is unclear, this breed appears to be a crossbreed between Shamo, Shokoku, and Tomaru. Our results suggest that Koeyoshi may be a crossbreed between Shamo and Shokoku. Aizu-Jidori, found in Fukushima Prefecture, is thought to be a variety of Jidori. However, Aizu-Jidori did not belong to the group of Jidori in this study. The relationships between Aizu-Jidori and the other Japanese breeds could not be elucidated, however, Aizu-Jidori may be a crossbreed of Jidori, Shokoku, and Shamo. Tomaru is found in Niigata Prefecture and is famous for the prolonged crowing ability of males. The cocks can crow for up to 18 s. Tomaru is a large breed; the adult male body weight is about 3.5 kg. This breed is thought to be derived from a breed of OhTomaru ( large Tomaru) imported from China in the 16th or 17th century. In this study, the genetic distances between Tomaru and the other Japanese breeds were relatively far. Our results do not contradict the presumed history of Tomaru. In conclusion, microsatellite markers are a useful tool for studying the genetic relationships among closely related breeds of chickens. Since the markers in this study are highly polymorphic, they can be also applied for linkage mapping of chickens. From the Laboratory of Animal Genetic Diversity, Department of Genetic Resources I, National Institute of Agrobiological Resources, Kannondai 2-1-2, Tsukuba 305, Japan ( Takahashi, Nirasawa, and Nagamine), and the Laboratory of Animal Breeding and Genetics, Faculty of Applied Biological Science, Hiroshima University, Higashi-Hiroshima, Japan ( Tsudzuki and Yama-
546 The Journal of Heredity 1998:89(6)
moto). Appreciation is expressed to Dr. D. A. Vaughan ( National Institute of Agrobiological Resources, Tsukuba, Japan) for his help in preparing the manuscript in English. Address correspondence to Dr. Takahashi at the address above. q 1998 The American Genetic Association
References Cavalli-Sforza LL and Edwards AW, 1967. Phylogenetic analysis: models and estimation procedures. Am J Hum Genet 19:233–257. Cheng HH, Levin I, Vallejo R, Khatib H, Dodgson JB, Crittenden LB, and Hillel J, 1995. Development of a genetic map of the chicken with markers of high utility. Poult Sci 74:1855–1874. Goldstein DB, Ruiz Linares A, Cavalli-Sforza LL, and Feldman MW, 1995. Genetic absolute dating based on microsatellites and the origin of modern humans. Proc Natl Acad Sci USA 92:6723–6727. Hashiguchi T, Tsuneyoshi M, Nishida T, Higashiuwatoko H, and Hiraoka E, 1981. Phylogenetic relationships determined by the blood protein types of fowls (in Japanese). Jpn J Zootech Sci 52:713–729. Hawksworth D, 1994. British poultry standards. Oxford: Blackwell Science. Koana H, 1951. A history of Japanese chickens (in Japanese). Tokyo: Nihonkei-Kenkyusha. Nei M, 1983. Genetic polymorphism and the role of mutation in evolution. In: Evolution of genes and proteins ( Nei M and Koehn R, eds). Sunderland, Massachusetts: Sinauer; 165–190. Nirasawa K, Naito M, Oishi T, and Komiyama T, 1995. Two-way selection for egg shell strength with non-destructive deformation as selection criterion in chickens (in Japanese). Jpn Poult Sci 32:128–136. Okada I, Toyokawa K, and Takayasu I, 1980. Genetic relationships of some native chicken breeds in the northern Tohoku district of Japan (in Japanese). Jpn Poult Sci 17:337–343. Saitou N and Nei M, 1987. The neighbor-joining method: a new method for reconstructing phylogenetic trees. Mol Biol Evol 4:406–425. Shriver M, Jin L, Boerwinkle E, Deka R, and Ferrell RE, 1995. A novel measure of genetic distance for highly polymorphic tandem repeat loci. Mol Biol Evol 12:914– 920. Stromberg L, 1996. Poultry of the world. Ontario: Silvio Mattacchione & Co. Takahashi H, Nirasawa K, and Furukawa T, 1996. An efficient method to clone chicken microsatellite repeat sequences. Jpn Poult Sci 33:292–299. Takezaki N and Nei M, 1996. Genetic distances and reconstruction of phylogenetic trees from microsatellite DNA. Genetics 144:389–399. Tanabe Y and Mizutani M, 1980. Studies of the phylogenetic relationships of the Japanese native fowl breeds (in Japanese). Jpn Poult Sci 17:116–121. Received August 13, 1997 Accepted February 13, 1998 Corresponding Editor: Lyman Crittenden
A New Allelic Series for the Underwhite Gene on Mouse Chromosome 15 H. O. Sweet, M. H. Brilliant, S. A. Cook, K. R. Johnson, and M. T. Davisson A new allelic series at the underwhite gene is described. Three of the alleles in the series—uw, uwd, and Uwdbr—arose as spontaneous mutations on different genetic backgrounds at The Jackson Laboratory. We report here the visible phenotypes and dominance hierarchy of these alleles, all of which are defined by a reduction of pigmentation in both eye and coat color. Electron microscopic analysis of retinal epithelium suggests that the primary defect is in the melanosome. The degree of severity of melanosome anomalies in the retina correlates with the degree of hypopigmentation in the coat. The perturbed gene and its gene product are unknown. We show that the uw locus is genetically distinct from Myo10, a suggested candidate gene for this mutation. The first mutant allele to reveal the underwhite gene, uw, arose as a spontaneous mutation in the C57BL/6J inbred strain and was originally described by Dickie (1964). This allele produces the lightest coat color phenotype. The homozygote is characterized by lack of eye pigmentation at birth, dark reddish eyes as adults, and a light buff with white underfur coat color. The uw gene was mapped to proximal Chr 15 ( Davisson et al. 1990; Eicher and Green 1972). For many years thereafter it was the phenotypic marker of choice for locating genes on Chr 15. Two new spontaneous mutations causing coat color lightening have occurred at The Jackson Laboratory and have been shown by direct tests for allelism to be additional mutant alleles of the uw gene. MacPike and Mobraaten (1984) described a new semidominant mutation in the B10.PL(73NS)/Sn congenic strain that was provisionally called dominant brown (gene symbol Dbr). Cook and Davisson (1993) reported Dbr to be a semidominant allele of uw; the gene symbol for dominant brown became Uwdbr. Uwdbr is dominant to the wild-type allele for full color and to all recessive alleles at the underwhite gene. On the nonagouti (a/a) background, homozygotes, Uwdbr/Uwdbr, are light beige; heterozygotes, Uwdbr/1, appear dark brown (Cook and Davisson 1993). Eye pig-
mentation is absent at birth but darkens with age. Underwhite dense (uwd) arose as a spontaneous mutation in the TF/Le inbred strain in 1992. The TF/Le strain is maintained segregating for brachyury (T) and homozygous for tufted (tf), both genes on mouse Chr 17. One mating produced two dark brown, slate-colored progeny in a litter of 11. The ventrum of these two deviants appeared slightly lighter than the dorsum. Eyes are light at birth, but darken with age. Three more litters also yielded some pups with the new phenotype. The adult eye is deep, dark ruby, although it may appear black to an untrained observer. On a nonagouti (a/a) background, the coat color of homozygous uwd/uwd closely resembles homozygous ruby eye (Chr 19) and ruby eye 2 (Chr 7), although a greater dilution of pigment is observed in eye and ear pinnae color of uwd/uwd. On an agouti (A/A) background, the coat color of homozygous uwd/uwd resembles agouti brown (A/A Tyrp1b/Tyrp1b). These similarities suggest that the underwhite gene may have effects on the shape and color of pigment granules similar to those produced by the ruby eye or brown mutations. A third new mutation that affected the degree of dilution in the underwhite coat color was found in a recovery of frozen C57BL/6J-uw embryos in 1994. Crosses made to mice carrying known alleles of the uw gene suggested the mutation might be yet another uw allele or a mutation in a modifying gene. This mutation was given the provisional name underwhite-intense. Adult homozygous underwhite-intense mice have a slightly darker coat color and darker eye pigmentation than homozygous uw/uw mice. The line was lost due to poor reproduction before genetic analysis was completed; a second recovery of embryos failed to reveal the new phenotype. Electron microscopic analysis of the retinal epithelium in mutant mice with one or a combination of these alleles shows that mutations in the uw gene cause defects in the melanosomes. The degree of severity in the retinal epithelial pigment correlates
Table 2. Crosses to test for allelism and establish dominance Female 3 male parental genotypes Progeny genotype
Parental phenotypes Progeny phenotype
uw/uw 3 Uw dbr/Uw dbr uw/Uw dbr uw d/uw d 3 Uw dbr/Uw dbr uw d/Uw dbr uw d/uw d 3 uw/uw uw d/uw
Female parent lighter than male Progeny identical to male parent (n 5 6) Female parent darker than male Progeny identical to male parent (n 5 54) Female parent darker than male Progeny identical to female parent (n 5 25)
with the degree of hypopigmentation in the coat color. The phenotypes and interactions of the various mutant alleles suggest that the normal protein encoded by the underwhite gene is a major contributor to normal melanogenesis and that the allelic series of mutations at uw will be valuable in understanding melanosome formation.
Materials and Methods All mice were reared and all genetic breeding studies were carried out in the Mouse Mutant Resource at The Jackson Laboratory ( Davisson 1990). Mice were maintained in a modified barrier mouse room with a filtered air supply at 688F–728F, 40– 50% humidity, and housed in polycarbonate cages (50 in2); all boxes were covered with a flat Lexon filter. Water supplied to the animals was both acidified and chlorinated with a pH of about 2.5 and a residual chlorine content of 12–18 ppm to suppress the growth of Pseudomonas sp. The strains are now maintained on the NIH 31M 6% fat diet, Purina formulation. Various crosses were made between mice with different alleles to determine the dominance hierarchy of the different uw alleles (see Tables 1 and 2). To map the chromosomal location of the uwd mutation, a homozygous uwd/uwd male was mated to a female from an inbred strain of M. m. castaneus (CAST/Ei). The normal-colored F1 progeny produced were intercrossed and the F2 progeny scored as 1/? (normal) or uwd/uwd (mutant). Only homozygous F2 mutant mice contributed to the mapping data. Genomic DNA samples were prepared from spleens using conven-
Table 1. Genetic crosses showing that uw d segregates as a recessive gene with full penetrance Phenotypes of progeny
Parental genotypes Female
3
Male
1/uw 1/uw d uw d/uw d uw d/uw d 1/1 (CAST/Ei)
3 3 3 3 3
1/uw uw d/uw d uw d/uw d 1/1 (C57BL/6J) uw d/uw d
d
d
1
uwd
Total
59 42 0 22 42
21 42 17 0 0
80 84 17 22 42
tional methods and selected microsatellite markers were typed by polymerase chain reaction (PCR) modified from Dietrich et al. (1992) using primer pairs from Research Genetics ( Huntsville, Alabama). Amplified products were electrophoresed through 2.75% MetaPhor agarose ( FMC Bioproducts) and visualized with ethidium bromide. The interlocus recombination values and locus order were determined using Map Manager (Manly 1993). The partial cDNA sequence of Myo10 (GenBank accession no. U55210) was used to design PCR primers to amplify DNA for use as a mapping probe. Using the forward primer 59-CTCAACTCTGACGTGGTGGA-39 and reverse primer 59-ATCTTGATGGCTTCGTCCTG-39, an approximately 1 kb product was amplified from mouse genomic DNA. This product was gel purified and directly sequenced from both ends with these same primers, using the Applied Biosystems (ABI) model 373A automated DNA sequencer and the DyeDeoxy Terminator Cycle Sequencing method (ABI). The PCR product was then labeled and used as a hybridization probe for Southern blot analysis of DNA polymorphisms using methods previously described (Johnson et al. 1992). For electron microscopy, eyes were fixed for at least 18 h at 48C in 3% glutaraldehyde, 0.1 M phosphate buffer, pH 7.2. The fixed tissue was dissected to 1 mm 3 1 mm 3 3 mm pieces. Postfixation was in 1% osmium tetroxide, 0.1 M phosphate buffer for 1 h, followed by en bloc staining for 30 min in 1% uranyl acetate, 50% ethanol. The tissues were then dehydrated using serial alcohol and acetone washes and embedded in Spurr resin. A Sorvall MT-2B ultramicrotome was used to section the tissues to 80 nm (silver-gold). Sections were stained with uranyl acetate and lead citrate. Grids were viewed on a Philips 400 electron microscope at an accelerating voltage of 80 kV.
Results Genetic Analysis Mode of inheritance and allelism. Crosses to show segregation of the uwd allele as a
Brief Communications 547
Table 3. Crosses to test for allelism and establish dominance Phenotypic appearance of progeny
Parental genotypes
Female Uw /uw Uwdbr/uwd dbr
uwd/uw uwd/uw
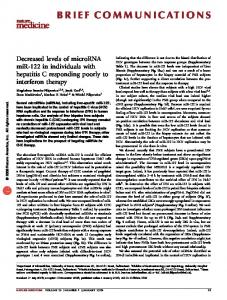
Figure 1. Coat colors associated with different uw alleles. From left to right the genotypes are 1/uw , uw / uw , Uwdbr/Uwdbr, Uwdbr/1, uw/uw, and two underwhite-intense. The underwhite-intense mutation may still be present in some recovered frozen embryos of this strain and can be detected by variation in the shade of the coat color of uw/uw mice. Note coat color of the two mice at the far right compared to that of the uw/uw mouse. All mice are homozygous for the nonagouti allele (a/a) at the agouti gene. d
d
d
recessive mutation are summarized in Table 1. The modes of inheritance of the uw and Uwdbr alleles were described previously ( Dickie 1964; MacPike and Mobraaten 1984). The phenotypes of the parents and progeny from the allele test crosses are described below. The coat color phenotypes of parental mice homozygous for each of the underwhite alleles and for the underwhite-intense mutation are shown in Figure 1. Crosses made between homozygous uwd and Uwdbr mice, which are phenotypically distinguishable from each other ( Figure 1), yielded light beige F1 progeny identical in appearance to the lighter Uwdbr/Uwdbr parent. Simultaneously, we repeated the previously reported cross (Cook and Davisson 1993) between homozygotes of underwhite and dominant brown so coat colors could be compared
Figure 2. Position of uwd on mouse Chr 15. Interlocus recombination frequencies with associated standard errors (in parenthesis) are shown to the left of the diagrammatic chromosome. All values were calculated from analysis of 50 uwd/uwd intercross mice, equivalent to 100 tested meioses. The numbers to the left of the horizontal bars are centiMorgan positions from the centromere as given in MGD (1997).
548 The Journal of Heredity 1998:89(6)
d
3
Male
like like Uwdbr/ uwd/ d uw uwd Total
3 3
Uwdbr/uwd uwd/uwd
114 37
32 37
like uwd/ uw
like uw/uw
132 11
35 4
3 3
uwd/uw uw/uw
146 74
167 15
directly. The coat color of the uw/uw parent appeared lighter than that of the Uwdbr/ Uwdbr parent; the cross yielded light beige F1 progeny of both sexes identical in coat color to the Uwdbr/Uwdbr parent. A parallel cross between underwhite and underwhite dense was made to observe uw/uwd double heterozygotes; the cross yielded darker F1 progeny of both sexes identical in coat color to the uwd/uwd parent. No homozygous wild type mouse was observed in any of the crosses done, which indicates the mutations are allelic rather than closely linked independent genes. These results are summarized in Table 2. Results of additional allele test crosses are presented in Table 3. Progeny were scored phenotypically, but none of the progeny were test bred for genotypic confirmation. Although no wild-type mice were recovered from similar crosses between the ‘‘underwhite-intense’’ mutation and the underwhite alleles, these crosses did not resolve whether the underwhiteintense mutation is an underwhite allele or a modifying gene, because underwhiteintense was always scored in mice homo-
Figure 3. Intron splice sites in portion of Myo10 sequence amplified from mouse genomic DNA. Consensus splice donor and acceptor sequences are underlined. Intron sequence is in lowercase. Primer sequences are doubleunderlined.
Figure 4. Electron micrographs of sections through the eyes of mice carrying various alleles at the uw locus. The genotype of each mouse is presented at the bottom left of each panel. The key to the symbols that label each panel is C 5 choroid; RPE 5 pigmented retinal epithelia; M 5 melanosome; RBC 5 red blood cell. The scale of each micrograph is the same, with a bar representing 2 microns shown in the bottom right of each panel.
zygous for one of the underwhite mutant alleles. Also underwhite-intense was not genetically mapped. The dominance hierarchy established among proved under-
white alleles is Uwdbr . 1 . uwd . uw. A fourth allele of uw, blanc-sale (uwbls), has been reported (Guenet and Babinet 1982). Since it was not available at The Jackson
Laboratory to include in our crosses, we could not place it in the dominance hierarchy with the other alleles. Genetic linkage analysis. The results of
Table 4. Melanin content, melanocyte numbers and morphology in the retinas of eyes of mice with different alleles of uw RPEa
Choroid
a b
Allelic genotype
Pigment
Melanocyte number
Melanosomesb
Pigment
Melanocyte number
Melanosomesb
1/1 1/uwd uw/uw underwhite intense uwd/uwd Uwdbr/Uwdbr Uwdbr/1
11111 11111 2 1 111 1 111
Normal Normal Normal Normal Normal Normal Normal
Normal, stage 4 Normal, stage 4 Abnormal, stage Abnormal, stage Abnormal, stage Abnormal, stage Abnormal, stage
11111 11111 2 1 11 2 111
Normal Normal Normal Normal Normal Normal Normal
Normal, stage 4 Normal, stage 4 Abnormal, stage Abnormal, stage Abnormal, stage Abnormal, stage Abnormal, stage
1–2 1–3 2–3 1–2 3–4
1–2 1–3 2–3 1 3–4
RPE 5 pigmented retinal epithelium. Melanosomes are categorized into several stages ( Hearing et al. 1973; Moyer 1963): stage 1 are the most immature, with little melanin; stage 2 and 3 are intermediate, stage 4 melanosomes are fully developed and pigmented.
Brief Communications 549
the linkage intercross mapping uwd are shown in Figure 2. Because both parents were F1 hybrids and only homozygous mutant mice were analyzed, each progeny genotype represents the product of two informative meioses. Our cross is the first to map the uw gene with respect to closely linked DNA markers. Our mapping order and genetic distances between MIT markers agrees with the MIT database (MIT 1997). Individual mouse genotypes for all Chr 15 loci typed in this cross have been deposited in MGD, accession number MGD-JNUM-41299 (MGD 1997). Analysis of Myo10 as a Candidate for uw An approximately 1 kb product was amplified by PCR from mouse genomic DNA using the previously described Myo10-specific primers. This product was larger than the 164 bp product expected from the Myo10 cDNA sequence. The DNA sequence at the ends of the amplified genomic fragment matched the cDNA sequence; however, the fragment also included additional internal nucleotides flanked by consensus 59 splice donor and 39 splice acceptor sites, indicating the presence of an intron ( Figure 3). Using this PCR product as a probe, we identified MspI RFLPs between the parental strains of the cross used to map uwd, TF/Le (fragments 4.8, 3.7, and 2.5 kb), and CAST/Ei (fragments 4.8, 3.7, and 3.4 kb). The diagnostic 2.5 kb TF/Le-specific and 3.4 kb CAST/Ei-specific fragments were then used to follow segregation of Myo10 in the uwd linkage cross. Three crossovers between Myo10 and uwd ruled out the hypothesis that the uw and Myo10 genes are the same. Myo10 mapped to the same location as D15Mit9 ( Figure 2), about 3 cM distal to uw. Electron Microscopic Analysis of the Retina Abnormalities in melanosomes were noted in all mice homozygous for recessive uwd or uw mutant alleles or carrying either one or two copies of the semidominant Uwdbr allele (see Figure 4 and Table 4). These abnormalities were manifest as irregularities in shape, reduction in size, and reduction in the fraction of mature melanosomes. The severity of the melanosome abnormalities correlated with the severity of coat and eye hypopigmentation. We did not note a reduction in pigmented cell numbers in either the choroid or pigmented retinal epithelium.
550 The Journal of Heredity 1998:89(6)
Discussion The gene product encoded by the uw locus is unknown at this time. From the phenotypes produced by uw mutations and the behavior and interaction of uw alleles, however, we can speculate about the uwencoded protein. The uw defect appears to be at the level of the melanosome. Melanosomes from mice with uw mutations are irregular in shape, reduced in size, and less mature than their wild-type counterparts ( Figure 4 and Table 4). The irregular shape of the melanosomes suggests that the protein encoded by the uw gene might play a structural role. The semidominant nature of the Uwdbr allele is also consistent with a structural role for the uw protein. Mutant alleles of a gene encoding a structural protein can be both dominant and recessive, especially when that protein functions in a multimeric complex (see review by Wilke 1994). An example of this is seen in C. elegans, where null mutations of the gene encoding myosin heavy chain protein are recessive, for example, unc54(0) alleles. In contrast, certain missense mutations producing altered forms of myosin heavy chain protein are dominant, for example, unc-54(d) alleles, as these altered proteins disrupt the assembly of stable thick filaments ( Bejsovec and Anderson 1990). Thus it is possible that the uw protein functions in a multimeric complex and may play a structural role in normal melanosome formation. The inheritance pattern does not rule out that the uw gene encodes an enzyme. For example, certain alleles of the enzyme-encoding loci Tyrp1 and Dct affecting coat color are dominant (Silvers 1979). Mutations of Tyrp1 also may be associated with irregularities in the shape of certain melanosomes (Rittenhouse 1968), although the Tyrp1-induced irregularities are less severe than those seen for uw. The key enzymes required to produce melanin have been identified, however, and their respective genes cloned and shown to correspond to other mouse genes affecting pigmentation (Jackson 1992). Unlike some other pigment dilution genes that affect platelets and lysosomes as well as melanocytes, uw/uw mice do not have a prolonged bleeding time (Swank et al. 1991). Hopefully, the identification of the uw-encoded protein will help us to understand how it mediates its effects. The uw gene maps to the proximal region of mouse Chr 15. The unconventional myosin gene Myo10 has been mapped to this same region and has been proposed
as a candidate for the underwhite mutation ( Hasson et al. 1996). Rationale for this possibility comes from another coat color mutation, dilute (Myo5d), which is known to be an alteration of another unconventional myosin gene, Myo5 (Mercer et al. 1991). Although both are coat color mutations, the dilute mutation affects melanosome movement and distribution, whereas the primary defect in underwhite mice appears to be in melanosome structure. Our linkage results conclusively eliminate Myo10 as a candidate gene for uw because three chromosomes (out of 100 tested) were recombinant between these two loci ( Figure 2). The human homolog of Myo10 maps to 5p15-p14 and all other human homologs of mouse genes mapped proximal to Myo10 on mouse Chr 15 have been mapped to 5p14-p12, suggesting the human homolog of uw is in the Chr 5p15p12 region. From The Jackson Laboratory, 600 Main St., Bar Harbor, ME 04609-1500 (Sweet, Cook, Johnson, and Davisson), and the Department of Pediatrics, University of Arizona Health Sciences Center, Tucson, Arizona ( Brilliant). We thank Dr. Andres Klein-Szanto, Tracy Gales, and Manfred Bayer for their help with the electron microscopy, Jane Farley of The Jackson Laboratory Cryopreservation Resource for observing and bringing to our attention the underwhite-intense deviant in a litter recovered from C57BL/6J-uw embryos, Stanton K. Short and Joyce Worcester for photography in Figure 1, Linda Neleski for manuscript preparation, and Luanne Peters and Elizabeth M. Simpson for critical review of the manuscript. This work was supported by NIH grants GM22167 and CA06927 (M.H.B.), GM46697 (S.A.C. and K.R.J.), RR01183 (M.T.D. and K.R.J.), and a grant ( DBI 95-02221) from the Living Stock Center Program of the National Science Foundation ( H.O.S., K.R.J., and M.T.D.). The Jackson Laboratory is fully accredited by the American Association of Laboratory Animal Care. Address correspondence to Dr. Muriel T. Davisson at the address above or e-mail:
[email protected]. q 1998 The American Genetic Association
References Bejsovec A and Anderson P, 1990. Functions of the myosin ATP and actin binding sites are required for C. elegans thick filament assembly. Cell 60:133–140. Cook SA and Davisson MT, 1993. Dominant brown. Mouse Genome 91:312. Davisson MT, 1990. The Jackson Laboratory Mouse Mutant Resource. Lab Anim 19:23–29. Davisson MT, Roderick TH, Akeson EC, Hawes NL, and Sweet HO, 1990. The hairy ears (Eh) mutation is closely associated with a chromosomal rearrangement in mouse chromosome 15. Genet Res 56:167–78. Dickie MM, 1964. Underwhite. Mouse News Lett 30:30. Dietrich W, Katz H, Lincoln SE, Shin HS, Friedman J, Dracopoli NC, and Lander ES, 1992. A genetic map of the mouse suitable for typing intraspecific crosses. Genetics 131:423–447. Eicher EM and Green MC, 1972. The T6 translocation in the mouse: its use in trisomy mapping, centromere localization, and cytological identification of linkage group 3. Genetics 71:621–632. Gue´net JL and Babinet CH, 1982. The blanc-sale (bls) mutation. Mouse News Lett 67:30.
Hasson T, Skowron JF, Gilbert DJ, Avraham KB, Perry WL, Bement WM, Anderson BL, Sherr EH, Chen Z-Y, Greene LA, Ward DC, Corey DP, Mooseker MS, Copeland NG, and Jenkins NA, 1996. Mapping of unconventional myosins in mouse and human. Genomics 36:431– 439. Hearing VJ, Phillips P, Lutzner MA, Vincent J, and Hearing P, 1973. The fine structure of melanogenesis in coat color mutants of the mouse. J Ultrastruct Res 43:88– 106. Jackson IJ, 1992. Molecular and developmental genetics of mouse coat color. Annu Rev Genet 28:189–217. Johnson KR, Cook SA, and Davisson MT, 1992. Chromosomal localization of the murine gene and two related sequences encoding high-mobility-group I and Y proteins. Genomics 12:503–509. MacPike A and Mobraaten L, 1984. Personal communication. Mouse News Lett 70:86. Manly KF, 1993. A Macintosh program for storage and analysis of experimental genetic mapping data. Mammal Genome 4:303–313. Mercer JA, Seperack PK, Strobel MC, Copeland NG, and Jenkins NA, 1991. Novel myosin heavy chain encoded by murine dilute coat colour locus [published erratum appears in Nature 1991;352:547]. Nature 349:709–713. MGD, Mouse Genome Database, Mouse Genome Informatics Project, The Jackson Laboratory, Bar Harbor, Maine, 1997. World Wide Web ( URL: http:// www.informatics.jax.org). MIT Database of SSLP Markers, Whitehead Institute, MIT Genome Center, 1997. World Wide Web ( URL: http: //www-genome.wi.mit.edu/genomepdata/mouse/ mouse/pindex). Moyer FH, 1963. Genetic effects on melanosome fine structure and ontogeny in normal and malignant cells. Ann N Y Acad Sci 100:584–606. Rittenhouse E, 1968. Genetic effects on fine structure and development of pigment granules in mouse hair bulb melanocytes. I. The b and d loci. Dev Biol 17:351– 365. Silvers WK, 1979. The Coat Colors of Mice. New York: Springer Verlag. Swank RT, Reddington M, Howlett O, and Novak EK, 1991. Platelet storage pool deficiency associated with inherited abnormalities of the inner ear in the mouse pigment mutants muted and mocha. Blood 78:2036– 2044. Wilke AOM, 1994. The molecular basis of genetic dominance. J Med Genet 31:89–98. Received September 5, 1997 Accepted February 13, 1998 Corresponding Editor: Christine Kozak
Multiple Paternity in Atlantic Salmon: A Way to Maintain Genetic Variability in Relicted Populations P. Moran and E. Garcia-Vazquez This work describes results of genetic analysis of progeny of Atlantic salmon from a single redd. Five single-locus minisatellite DNA probes were used for parentage analysis. Results suggest that multiple males were involved in fertilizing the eggs. The role of multiple paternity on
conservation of genetic variability in relicted populations of Atlantic salmon is discussed. In the second half of this century, many southern European populations of Salmo salar have been so dramatically reduced that they can be considered virtually extinct (Garcia de Leaniz and Martinez 1988). Reasons for this reduction are mainly related to anthropogenic factors (overfishing, pollution, reduction of spawning areas). In particular, the populations of northwestern Spanish rivers have suffered severe bottlenecks and currently are supported by a few dozen or even couples of adults, remaining marginal populations (Garcia de Leaniz and Martinez 1988). An example is the population of the River Mandeo: adults typically return after 2 years in the sea with migration limited to 15 km upstream by impassable waterfalls, the annual mean number of sport catches was 7.8 in the period 1971– 1994, and the annual number of redds (nests) no larger than a dozen (Garcia de Leaniz C and Caballero P, personal communication). In spite of limited population sizes, these populations persist, avoiding extinction for decades. The level of inbreeding is expected to be very high, due to consecutive bottlenecks. Losses of genetic variability are known to reduce the ability of a stock to adapt to different environmental conditions ( Leary et al. 1985). An interesting question is, Why are populations of Atlantic salmon with such a high probability of inbreeding able to adapt to more and more changes in habitat and survive in very poor conditions? One possibility is that they are not as inbred as expected. Inbreeding may be reduced if reproduction involves a higher number of breeders than adults. Mature juvenile males, called precocious parr, have been demonstrated to fertilize a high proportion of the eggs of each female ( Hutchings and Myers 1988; Moran et al. 1996). The presence of mature male parr within redds has been shown in wild conditions ( Erkinaro et al. 1994; Sægrov and Urdal 1993). There are no publications on the genetic composition of the population of Atlantic salmon of the River Mandeo. This species as a whole presents low genetic variability in isozyme loci, with five loci accounting for more than the 90% of the total variability (Sta˚hl 1987). In the last few years, highly polymorphic nuclear markers such as minisatellites have been developed ( Bentzen et al. 1991; Taggart and Ferguson
1990) and are currently applied in population genetics, providing a new method useful for the description of populations (Galvin et al. 1995; Perez et al. 1997). The objective of this work was to assess the level of genetic variability of the Atlantic salmon population in the River Mandeo and to estimate the degree of exogamic mating of females in this population, based on paternity analyses of embryos sampled from one wild redd. Both genetic variability and paternity analyses were carried out with minisatellite loci.
Materials and Methods Sample Collection Samples of white muscle were taken from adults caught in the River Mandeo in 1993 (12 adults) and 1994 (9 adults) during the fishing season ( before reproduction). Note that although very reduced in size, these samples represent about one-third of the entire adult population of the River Mandeo. Fifty naturally spawned eyed embryos were sampled from one redd in 1994; this redd was chosen because of its accessibility to field workers (in shallow water at the edge of the river). All samples were alcohol-preserved until analyses. DNA Analyses Total genomic DNA was isolated from white muscle following the protocol described by Taggart et al. (1992). Four micrograms of DNA per individual were digested overnight with HaeIII (Pharmacia) following the manufacturer’s recommendations. Digested samples were size fractionated by electrophoresis through 0.7% agarose gels in 13 TAE buffer (Sambrook et al. 1989) for 24 h. After electrophoresis, gels were depurinated, alkali denatured, and transferred to nylon membranes ( Hybond-N, Amersham) by Southern blotting. DNA was immobilized on the filters by cross-linking under UV illumination. Hybridization was carried out at 658C in 1.53 SSPE (0.27 M NaCl, 15 mM sodium phosphate pH 7.7, 1.5 mM EDTA), 0.5% dried milk, 1% SDS, and 6% polyethylene glycol. Probes were radioactively labeled by random priming ( Dalgleish 1987). The five single-locus probes employed in the present work (pSsa-A45/1, pSsa-A45/2, pStrA22/1, pStr-A9, pSsa-A60), derived from Atlantic salmon and brown trout genomic libraries, were kindly provided by Drs. J. Taggart, P. Prodho¨l, and A. Ferguson. After 12 h of hybridization, blots were washed in 23 SSC 0.1% SDS at 658C for 30 min followed by two washes in 0.43 SSC 0.1%
Brief Communications 551
Table 1. Allele frequencies at the five VNTR loci in the samples analyzed
Table 2. VNTR genotypes of the 50 embryos analyzed from one wild redd of the River Mandeo
Table 3. Presumptive VNTR genotype of the female, and male gametes explaining the offspring found in the redd
Sample Locus Str-A9
Ssa-A60
Ssa-A45/1
Ssa-A45/2
Str-A22/1
Allele B C D G A B C Z F A B C D B D O Q Q M K H E B A
Adult-93 0.042 0.292 0.250 0.417 0.625 0.292 0.042 0.000 0.042 0.542 0.167 0.167 0.125 0.042 0.208 0.500 0.250 0.042 0.292 0.000 0.083 0.500 0.042 0.042
0.056 0.611 0.278 0.056 0.611 0.389 0.000 0.000 0.000 0.125 0.250 0.375 0.250 0.000 0.111 0.611 0.278 0.000 0.167 0.000 0.167 0.556 0.056 0.056
Adult-93, adults caught in 1993; Adult-94, adults caught in 1994.
SDS at 658C for 30 min. Results were visualized after exposure to Kodak X-OMAT-S film at –808C with two intensifying screens for 2 days. Alleles of each locus were designated sequentially by the molecular weight of the different DNA fragments. This designation followed Prodho¨l et al. (1994a,b) and Taggart et al. (1995). Statistical analyses were performed using the GENEPOP computer package (Raymond and Rousset 1995). Conformance to Hardy–Weinberg equilibrium and heterogeneity of allele frequencies among samples were tested by Markov chain method; Fis estimates followed Weir and Cockerman (1984); heterozygosities were calculated using the BIOSYS computer package (Swofford and Selander 1989). Paternity Attribution The genotypes of all the embryos were studied locus by locus in order to obtain a ‘‘consensus common female,’’ because all the offspring should be descended from a single maternal parent. For each locus, one of the two alleles of each embryo should correspond to that hypothetical female. Once the alleles corresponding to the consensus female were eliminated from the embryos’ genotypes, the rest of the haplotypes were assumed to originate from male gametes. The minimum number of male parents necessary to produce the pool of potential male gametes was estimated, under the assumption that the
552 The Journal of Heredity 1998:89(6)
VNTR locus
Adult-94
VNTR locus
Embryo Str-A9
SsaSsa-A60 A45/2
SsaA45/1
StrA22/1
1 2 3 4 5 6 7 8 9 10 11 12 13 14 15 16 17 18 19 20 21 22 23 24 25 26 27 28 29 30 31 32 33 34 35 36 37 38 39 40 41 42 43 44 45 46 47 48 49 50
AC AB AZ AZ AB AZ AA AB AB AB AC AA AA AB AZ AB AC AZ AA AB AZ AZ AA AA AZ AB AZ AB AA AC AB AC AZ AA AB AA AA AC AZ AA AA AZ AZ AC AB AA AZ AC AB AZ
AB AC AC CD AD AC AB DD AC AC CD BD AB CD AD AD BD AC AC AD CD CD AB AC CD AC AC AA CD CD AC AB DD BD CD BD BD AB AC CD AC AA DD BD CD BD AA BD CD AD
EK EM EH EH EE MM BM EM HM EH EE EE MQ EH MM MM BE EH EQ EM HM EH BE EQ EM MM MM EK EQ MQ EH EQ EM MQ EH BE MQ BM EH BE MQ MM MM EK MM MQ MM BM EH MM
CC CC DD BC DD BC CD DD DD CC CD CD CD CC CC CC CD DD CD DD DD CC CC CD DD DD DD CC CC CD DD CD CD CD DD CC CC CC DD CC CC CD DD CD DD CC DD CD DD DD
OQ OQ OQ OQ OQ OQ OQ OQ OQ OQ OQ OQ OQ OQ OQ OQ OQ OQ OQ OQ OQ OQ OQ OQ OQ BO OQ OQ OQ OQ OQ OQ OQ OQ OQ OQ OQ OQ OQ OQ OQ OQ OQ OQ OQ OQ OQ OQ OQ OQ
studied minisatellite loci are independent ( Taggart et al. 1995).
Results All the individuals assayed expressed one or two bands for each of the minisatellite loci assayed, as expected from a single locus inheritance model ( Taggart et al. 1995). The maximum number of alleles obtained in the loci screened—Str-A9, SsaA60, Ssa-A45/1, Ssa-A45/2, and Str-A22/1— were 4, 5, 4, 4, and 7, respectively. Allele frequencies found in the adult population in 1993 and 1994 are given in Table 1. Mean heterozygosities (average of all five loci combined) were 0.60 and 0.64 in
Female Male gametes
SsaStr-A9 A60
Ssa- SsaA45/ A45/ 2 1
StrA22/ 1
Number
CD D D D D C/D C D C C/D C C C/D C/D C C C/D C/D C D D C D C C B
OO Q Q Q Q Q Q Q Q Q Q Q Q Q Q Q Q Q Q Q B Q Q Q Q Q
EM H M E H B Q M E/M K Q B E E M B Q Q K M M H M M H H/M
50 4 5 1 4 3 4 1 1 2 4 1 1 1 1 3 1 1 1 2 1 1 2 1 2 2
AA Z Z B B C A B B C A A A C Z A C C B Z B Z B B B Z
AD C A/D A/D C B B C C B C C B C A/D B B C A C C C A/D A/D C C
Number 5 number of offspring estimated to derive from the gamete.
Adult-93 and Adult-94 samples, respectively. There were no significant departures from Hardy–Weinberg equilibrium for any locus; we found no significant excess of homozygotes at any loci. Fis ranged from – 0.383 to 0.314. The two analyzed adult samples were not statistically different with respect to the allele frequencies of the five minisatellite loci: test combinations ( Fisher’s exact method) for the five loci combined gave a P value of .479. The genotypes of the embryos sampled in the redd are in Table 2. They showed a mean heterozygosity of 0.736. All embryos could be interpreted as the offspring of a single female ( Table 3), but a minimum of 25 different male gametes are needed to explain the genotype of all 50 embryos. These 25 different gametes could have been produced by a minimum of 6 males ( Table 4), whose relative contributions to the offspring are estimated to range from 4 to 28%.
Discussion With no more than 12–15 adult pairs per year, mean heterozygosity was around 0.6. This value is not very reduced with respect to mean heterozygosity calculated for the same five minisatellite loci in a
Table 4. Estimated genotype of each potential male parent and their relative contribution (in percent of embryos fertilized) to the offspring found in the redd.
SsaA45/ 1
StrA22/1
Contribution (%)
CD BC BC CBC AB
EM HQ BK HM EQ EK
28 28 20 14 6 4
VNTR locus
Male
Str-A9
SsaSsa-A60 A45/2
1 2 3 4 5 6
CD CD CD BD CD C-
BZ AB AC ZCZ AB
QQ QQ QQ BQ QQ QQ
much larger Cantabric population: the population of the River Esva, with the number of adult pairs ranging from 150 to 250 in different years, presented mean heterozygosity around 0.7 in different samples (Perez et al. 1997). On the other hand, the two adult samples were in Hardy–Weinberg equilibrium, with no significant increase of homozygotes and no evidence of genic differentiation having been shown between them. This picture does not seem to correspond to a relict population close to extinction. The analysis of embryos taken from one wild redd could provide an explanation for the maintenance of genetic variability in such a small population. We estimated that at least six males fertilized the spawning of one female. The relative contribution of these males is not consistent with a courtship including one single dominant male and several precocious parr with minor participation ( Hutchings and Myers 1988), given that no more than a 28% of the total progeny can be attributed to any single male parent. The total spawning of the female could have been fertilized by precocious parr, particularly in the absence or exhaustion of the dominant adult male: we have demonstrated that precocious male parr can fertilize 80% of the eggs in a redd when the adult male is overmature (Moran et al. 1996). Alternatively, it is also possible that the redd was fertilized entirely by adult males moving through in succession, as has been demonstrated for coho salmon ( Fleming and Gross 1994). Lacking observations of courtship behavior on the spawning grounds, it is impossible to say how fertilization occurred. Anyway, it is clear that multiple paternity helps to increase Ne, playing a key role in the evolutionary biology of small Atlantic salmon populations. Of the 19 alleles found in the 50 fry (across 5 loci), 2 did not occur in the 12
adults sampled in 1993 (potential brothers and sisters of their parentals). According to the methods, only one-third of the adults were sampled; therefore, there is a strong probability that the two anomalous alleles were simply missed in the adult sample. The excess of QQ male genotypes at Ssa-A45/2 (we found 49 from 50 Q male gametes in the redd, whereas the Q allele frequency was only 0.25 in the adults sampled in 1993) could also be attributed to the sampling of the adult population. In conclusion, multiple paternity is a way to increase the effective population size in Atlantic salmon and consequently to maintain genetic variability in populations with a reduced number of adults. From the Departamento de Biologia Funcional, Universidad de Oviedo. C/ Julian Claveria, s/n. 33006-Oviedo, Spain. We are grateful to Dr. Robin Waples for his very helpful comments to the manuscript. Dr. Carlos Garcia de Leaniz and Mr. Pablo Caballero kindly supplied samples. This work was supported by DGICYT UE94-0020 and PB94-1327. Address correspondence to E. Garcia-Vazquez at the address above or e-mail:
[email protected].
Prodho¨l PA, Taggart JB, and Ferguson A, 1994a. Cloning of highly variable minisatellite DNA single locus probes for brown trout (Salmo trutta) from a phagemid library. In: Genetics and evolution of aquatic organisms ( Beaumont AR, ed). London: Chapman & Hall; 263–270. Prodho¨l PA, Taggart JB, and Ferguson A, 1994b. Single locus inheritance and joint segregation analysis of minisatellite ( VNTR) DNA loci in brown trout (Salmo trutta L.). Heredity 73:556–566. Raymond M and Rousset F, 1995. GENEPOP (version 1.2): a population genetics software for exact tests and ecumenicism. J Hered 86:248–249. Sambrook J, Fritch EF, and Maniatis T, 1989. Molecular cloning: a laboratory manual. Cold Spring Harbor, New York: Cold Spring Harbor Laboratory Press. Sægrov H and Urdal K, 1993. Mature male parr buried among eggs in an Atlantic salmon redd. J Fish Biol 43: 490–491. Sta˚hl G, 1987. Genetic population structure of Atlantic salmon. In: Population genetics and fisheries management (Ryman N and Utter FM, eds). Seattle: University of Washington Press; 121–140. Swofford DL and Selander RB, 1989. BIOSYS-1: a computer program for the analysis of allelic variation in population genetics and biochemical systematics, release 1.7. Urbana, Illinois: University of Illinois Natural History Survey. Taggart JB and Ferguson A, 1990. Minisatellite fingerprints of salmonid fishes. Anim Genet 21:377–389.
q 1998 The American Genetic Association
Taggart JB, Hynes RA, Prodho¨l PA, and Ferguson A, 1992. A simplified protocol for routine total DNA isolation from salmonid fishes. J Fish Biol 40:963–965.
References
Taggart JB, Prodho¨l PA, and Ferguson A, 1995. Genetic markers for Atlantic salmon (Salmo salar L.): single locus inheritance and joint segregation analyses of minisatellite ( VNTR) DNA loci. Anim Genet 26:13–20.
Bentzen P, Harris AS, and Wright JM, 1991. Cloning of hypervariable minisatellite and simple sequence microsatellite repeats for DNA fingerprinting of important aquacultural species of salmonids and Tilapia. In: DNA fingerprinting approaches and applications ( Burke T, Dolf G, Jeffreys AJ, and Wolff R, eds). Basel, Switzerland: Birkhauser Verlag; 243–262. Dalgleish R, 1987. Southern blotting. In: Gene cloning and analysis: a laboratory guide ( Boulnois GJ, ed). Oxford: Blackwell Scientific; 45–60. Erkinaro J, Schchurov IL, Saari T, and Niemela E, 1994. Occurrence of Atlantic salmon parr in redds at spawning time. J Fish Biol 45:899–900. Fleming IA and Gross MR, 1994. Breeding competition in a Pacific salmon (coho: Oncorhynchus kisutch): measures of natural and sexual selection. Evolution 48:637– 657. Galvin P, McKinnell S, Taggart JB, Ferguson A, O’Farrell M, and Cross TF, 1995. Genetic stock identification of Atlantic salmon using single locus minisatellite DNA profiles. J Fish Biol 47(A):186–199. Garcia de Leaniz C and Martı´nez JJ, 1988. The Atlantic salmon in the rivers of Spain, with particular reference to Cantabria. In: Atlantic salmon: planning for the future (Mills D and Piggins D, eds). London: Croom Helm; 179–209. Hutchings JA and Myers RA, 1988. Mating success of alternative maturation phenotypes in male Atlantic salmon, Salmo salar. Oecologia 75:169–174. Leary RF, Allendorf FW, and Knudsen KL, 1995. Developmental instability as an indicator of reduced genetic variation in hatchery trout. Trans Am Fish Soc 114:230– 235. Moran P, Pendas AM, Beall E, and Garcia-Vazquez E, 1996. Genetic assessment of the reproductive success of Atlantic salmon precocious parr by means of VNTR loci. Heredity 77:655–660. Perez J, Moran P, Pendas AM, and Garcia-Vazquez E, 1997. Applications of single locus minisatellite DNA probes to the study of Atlantic salmon (Salmo salar L.) population genetics. J Hered 88:79–82.
Weir BS and Cockerman CC, 1984. Estimating F-statistics for the analysis of population structure. Evolution 38:1358–1370. Received February 10, 1997 Accepted February 18, 1998 Corresponding Editor: Bernie May
Inheritance Studies of Blue and Golden Varieties of Tench (Pisces: Tinca tinca L.) P. Kvasnic˘ka, M. Flajsˇhans, P. Ra´b, and O. Linhart The inheritance of blue and golden colors in tench (Tinca tinca L.) was studied by mating the respective mutations to the normal or wild-type green phenotype and/or together. Analyses of phenotype frequencies in F1, F2, and BC generations revealed that both color variants are mutations of two different, non-linked genes (b and g, respectively) recessive to wild pigmentation (B-G-), and both variants represent the homozygous combination only (bbG-, B-gg). The crossing of heterozygous carriers of both described genes provided wild, blue, and golden variants as well as alampic individuals completely
Brief Communications 553
lacking all types of skin pigments. Negative effect of mutations responsible for both color phenotypes on growth intensity was also documented. Tench (Tinca tinca L.) is a commercially reared cyprinid fish species now under intensive domestication. Moreover, it is very suitable for modeling breeding domestication programs in freshwater fish-farming systems ( Kvasnic ˇka and Linhart 1990). While developing such programs, several color mutations occurred in different strains. These mutations are useful for developing strains of ornamental fish, and they also extend the number of markers available in breeding experiments. Such color varieties are not rare in cyprinids. Apart from tench (Geldhauser 1988; Klupp 1985), color mutations have also been documented in common carp (Cyprinus carpio; Moav and Wohlfarth 1968), in Japanese ornamental (koi) carp (Cherfas et al. 1992; Gomelsky et al. 1996; Szweigman et al. 1992; Wohlfarth and Rothbard 1991) and goldfish (Carassius auratus; Tave 1986; Yamamoto 1973). For grass carp (Ctenopharyngodon idella) Rothbard and Wohlfarth (1993) and Tay et al. (1985) reported albinotic and red colors, respectively. In most of these fishes, albinism or red colors are inherited either by a recessive allele at an autosomal locus or by epistatic interaction between recessive alleles at two loci (Rothbard and Wohlfarth 1993; Tay et al. 1985; Yamamoto 1973).
Figure 2. The first golden tench female in 1988. Note the dark spots on cranial and dorsal part and on fins.
We describe here the inheritance of blue and golden colors in tench. This work was performed as part of the breeding program studies in the Department of Fish Genetics and Breeding, Research Institute of Fish Culture and Hydrobiology, University of South Bohemia (RIFCH USB), Vodnany, Czech Republic.
Materials and Methods A blue female ( Figure 1) was first obtained from a fish pond of RIFCH USB in 1980. A golden female ( Figure 2) was first obtained from the Fish Farm at Hluboka´ nad Vltavou, Czech Republic, in 1988. Three
golden males were obtained from this latter facility in 1989. All of these fish and/or their progeny from matings with wild, green tench strains developed at RIFCH UBS ( Kvasnic ˇka and Linhart 1990) were used for this study. Mature fish were artificially spawned as described by Linhart and Billard (1995) and Linhart and Kvasnic ˇka (1992). Fertilized eggs were incubated in 2 L fiberglass Zuger jars ( Linhart and Billard 1995), and hatched larvae from each jar were kept separately in plastic hatching trays until the beginning of exogenous feeding. The golden-colored larvae could be identified just after hatching because of their clearly visible golden pigmentation, while the blue- and green-colored larvae could not be distinguished. Offspring ( larvae) of each mating were stocked into separate experimental earthen ponds of 0.01 ha each with stocking densities of 5,000 individuals per pond. They were then harvested, their colors identified macroscopically, counted, and weighed after 130–140 days of growth. The expected and observed segregation frequencies were tested by chi-square test. T tests were used for weight differences.
Results and Discussion
Figure 1. Mature wild-colored tench female and the first mature blue tench female ( below) in 1980.
554 The Journal of Heredity 1998:89(6)
Pairwise matings yielded phenotypic ratios consistent with two, independently assorting loci, with the wild-type alleles completely dominant to the color mutant alleles ( Table 1 and 2). All F1 generation crosses between the wild type and mutant types yielded all wild-type progeny, while phenotypic ratios for the F2 and BC progeny of those original crosses were consis-
Table 1. Parents of blue, wild, and gold colors with probable genotype (p.g.) used for studies
Table 2. Mating results, probable genotypes (p.g.), expected ratios, and probability of fit for mating among wild-colored, golden, and blue individuals
GenMating erano. tion Year
Female of parents (p.g.)
Male of parents (p.g.)
Mating no.
Generation
Year
Wild
Golden
Blue
Alampic
Expected ratio
P
1 2 3 4 5 6 7 8 9 10
Blue ( bbG-) Wild ( BbG-) Blue ( bbG-) Gold ( B-gg) Wild ( B-Gg) Gold ( B-gg) Gold ( BBgg) Wild ( BbGg) Gold ( BBgg) Wild ( BbGg)
Wild ( BBG-) Wild ( BbG-) Wild ( BbG-) Wild ( B-GG) Wild ( B-Gg) Wild ( B-Gg) Blue ( bbGG) Wild ( BbGg) Wild ( BbGg) Blue ( bbGG)
1 2 3 4 5 6 7 8 9 10
F1 F2 B1 F1 F2 B1 F1 F2 B1 B2
1983 1987 1987 1988 1992 1992 1989 1993 1993 1993
3,100 953 1,072 2,852 388 1,606 4,855 2,425 1,836 1,235
— — — — 112 1,265 — 319 1,154 —
— 222 836 — — — — 283 — 1,080
— — — — — — — 86 — —
1:0:0:0 3:0:1:0 1:0:1:0 1:0:0:0 3:0:1:0 1:0:1:0 1:0:0:0 9:3:3:1 1:0:1:0 1:0:1:0
— ,.05 ,.05 — ..05 ,.05 — ,.05 ,.05 ,.05
F1 F2 B1 F1 F2 B1 F1 F2 B1 B2
1983 1987 1987 1988 1992 1992 1989 1993 1993 1993
Matings 1–6: blue, wild, and golden color studies; matings 7–10: blue, wild, golden, and alampic color studies.
tent with 3:1 and 1:1 expectations, respectively. Similarly, the initial mating of a gold female and a blue male yielded 100% wildtype progeny in the F1 generation, but wild, gold, blue, and alampic (transparent) phenotypes in the F2 generation ( Figure 3). The alampic phenotype presumably represented the double homozygote. Consequently, the results of these crosses suggest strongly that the blue and golden phenotypes are each single-gene mutations ( b and g, respectively) that are phenotypically expressed only in the homozygous condition ( bbG-, B-gg). The normal wild coloration is a composite character made of different kinds of skin pigments such as melanins, carotenoids, and purines, resulting in the typical olive-green wild color of tench. The blue coloration is caused by a mutation that reduces the production of red and yellow pigments. The golden coloration is a mutation that appears to reduce the production and/or distribution of melanin and guanine. The intensity of golden coloration varies from light yellow to dark orange and is undoubtedly affected by the distribution of red and yellow pigments. Golden coloration is probably affected by environmental effects while dark spots, which may occur on the cranial and dorsal parts and on fins are caused by melanin distribution ( Figure 2). The crossing of double heterozygotes for both described genes yielded individuals completely lacking all types of skin pigments; this latter condition is known commonly as alampia (Crozier 1974; Fox 1957). Discrepancies between expected Mendelian distribution and observed segregation frequencies consistently yielded a deficiency of mutant phenotypes. In most cases, these deficiencies can be explained by natural selection against the mutant phenotypes. The study described here
Progeny phenotypic frequencies
Matings 1–6: blue, wild, and golden color studies; matings 7–10: blue, wild, golden, and alampic color studies.
was carried out as a side, nonintentional part of a long-term breeding program under pilot conditions in earthen ponds and not in experimental aquaria. This was particularly true for detecting the blue phenotype, which had to be kept in the pond environment for the majority of the first growing season in order to enable color identification. The number of harvested fish (i.e., observed segregation pattern) was also probably affected by predation pressure during this period. However, the golden mutation could be identified just after hatching due to the clearly visible golden pigmentation of the larvae. Hence the observed segregation frequencies of
the golden phenotype corresponded more closely to Mendelian expectations. Mutations responsible for both color phenotypes also appear to have a negative pleiotropic effect on growth rate ( Table 3). All siblings in each of the respective cases were reared in the same ponds under identical conditions and their growth characteristics were significantly different in some cases (P , .01–.001). Similar color varieties and results for F1 phenotypes were observed by Geldhauser (1988). From the Research Institute of Fish Culture and Hydrobiology, University of South Bohemia, Department of Fish Genetics and Breeding, 389 25 Vodnany, Czech Republic ( Kvasnic ˇka, Flajsˇhans, and Linhart), and Insti-
Figure 3. Wild-colored, blue, golden, and alampic phenotypes in F2 try from mating 8 in Tables 1 and 2.
Brief Communications 555
Table 3. Mean size (g) 6 SE at harvest of wild, golden, blue, and alampic F 2, B1, and B2 progenies of the respective matings given in Tables 1 and 2
Mating no.
Generation Wild (g 6 SE)
2 3 6 8 9 10 Sample size (n)
F2 B1 B1 F2 B1 B2 33
16.25 6 5.42 6 7.59 6 1.28 6 1.60 6 1.84 6 33
5.45 1.63 2.07 0.48 0.51 0.67
Golden (g 6 SE)
6.16 6 2.26** 0.96 6 0.22*** 1.02 6 0.26*** 33
Blue (g 6 SE)
Alampic (g 6 SE)
14.06 6 3.62 5.27 6 1.29 0.95 6 0.31***
0.88 6 0.28***
1.84 6 0.74 33
33
Means of golden, blue, or alampic genotype in the same line with wild genotype were statistically different at **P , .01, ***P , .001.
tute of Animal Physiology and Genetics, Department of Genetics, Laboratory of Fish Genetics, Academy of Science of the Czech Republic, Libechov, Czech Republic (Ra´b). This work was supported by the Ministry of Agriculture of the Czech Republic (grant no. 4001). The authors thank Mr. Karel Burda, Vodn ˇany, Czech Republic, for the photographs. Address correspondence and reprint requests to Dr. O. Linhart at the address above. q 1998 The American Genetic Association
References Cherfas NB, Peretz Y, and Ben-Dom N, 1992. Inheritance of the orange type pigmentation in Japanese carp (koi) in the Israeli stock. Bamidgeh 44:32–34. Crozier GF, 1974. Pigments of fishes. In: Chemical zoology, vol. 8. New York: Academic Press; 509–521. Fox DL, 1957. The pigments of fishes. In: Physiology of fishes, vol. 2. New York: Academic Press; 367–385. Geldhauser F, 1988. Untersuchungen zur Farbvererbung der Schleie. In: Jahresbericht 1988, Bayerische Landesanstalt fu¨r Fischerei, Starnberg; 8–10. Gomelsky B, Cherfas NB, Ben-Dom N, and Hulata G, 1996. Color inheritance in ornamental (koi) carp (Cyprinus carpio L.) inferred from color variability in normal and gynogenetic progenies. Bamidgeh 48:219–230. Klupp R, 1985. Die Schleie—ein vielseitiger Fisch. Fischwaid 5:36–37. Kvasnic ˇka P and Linhart O, 1990. Results and programme of tench (Tinca tinca L.)breeding. Papers of RIFCH Vodnany 19:47–59. Linhart O and Billard R, 1995. Biology of gametes and artificial reproduction in common tench (Tinca tinca L.). A review. Pol Arch Hydrobiol 42:37–56. Linhart O and Kvasnicka P, 1992. Artificial insemination of tench (Tinca tinca L.). Aquacult Fish Manage 23:125– 130. Moav R and Wohlfarth G, 1968. Genetic improvement of yield in carp. FAO Fish Rep 14(4):12–29. Rothbard S and Wohlfarth GV, 1993. Inheritance of albinism in grass carp, Ctenopharyngodon idella. Aquaculture 115:13–17. Szweigman D, Rothbard S, and Wohlfarth GV, 1992. Further observations on the inheritance of color in koi. Nichirin 293(5):37–41. Tave D, 1986. Genetics for fish hatchery managers. Westport, Connecticut: AVI. Tay SH, Chua LH, and Teo SH, 1985. Selective breeding of Ctenopharyngodon idella for ‘‘red’’ color. Singapore J Primary Ind 13(2):64–69. Wohlfarth GV and Rothbard S, 1991. Preliminary investigations on color inheritance in Japanese ornamental carp (nishiki-goi). Bamidgeh 43:62–68. Yamamoto T, 1973. Inheritance of albinism in the goldfish, Carassius auratus. Jpn J Genet 48:53–64. Corresponding Editor: Donald C. Morizot
556 The Journal of Heredity 1998:89(6)
First Evaluation of Nuclear DNA Content in Setaria Genus by Flow Cytometry M. Le Thierry d’Ennequin, O. Panaud, S. Brown, S. Siljak-Yakovlev, and A. Sarr The Setaria complex encompasses crop, wild, and weed species with contrasting breeding systems and life cycles. Nuclear DNA content, base composition, and ploidy levels were determined in 14 Setaria species. Genome size (2C) of the diploid cultivated species (S. italica) and its wild ancestor (S. viridis) have been evaluated at 1 pg. Three ploidy levels have been described (2n 5 18, 36, 54). The interspecific range of the nuclear genomes was from 1.0 pg to 5.26 pg, and the haploid genome varied from 0.50 pg to 1.20 pg. The Setaria genus includes the domesticated plant foxtail millet (Setaria italica), which is an important crop in central China ( Li and Wu 1996), as well as weedy and wild forms representing diverse life cycles, breeding systems, and ploidy levels. Green foxtail millet (Setaria viridis), supposed to be the wild ancestor of S. italica (de Wet et al. 1979), is one of the most widely distributed weedy foxtail species. The domestication of foxtail millet and the organization of S. viridis complex have already been studied. Jusuf and Perne`s (1985), using allozymic data, inferred two domestication centers (China and Europe). More recently Li et al. (1995), using morphological traits, proposed three domestication origins (China, Europe, and a geographical area ranging from Afghanistan to Lebanon). Observations drawn from interspecific hybridizations suggest the following organization of the Setaria complex: a primary pool composed of S. italica and its presumed wild progenitor S. viridis (2n 5 2x 5 18), a secondary pool (S. verticillata and S. faberi) with a chro-
mosomic number 2n 5 4x 5 36 and a tertiary pool containing S. glauca (4x and 8x) and many other wild species ( Zangre´ et al. 1992). One basic chromosome number (x 5 9) has been reported among Setaria species. The genome size of Setaria species has not been documented (Arumuganathan and Earle 1991; Bennett and Leitch 1995; Bharathan et al. 1994). Our objective was to determine the genome size and ploidy levels of the Setaria gene pool. Intra- and interspecific variation was assessed using cytogenetic approaches. In addition to evolutionary significance, the results are discussed relative to comparative mapping.
Material and Methods Plant Material Fourteen Setaria species ( Table 1) were studied. Botanical identification was achieved using descriptors from different nomenclatures ( Berhaut 1954; Rominger 1962; Stapf and Hubbard 1930). One geographical accession per species was studied, except for four species (S. italica, S. viridis, S. pumila, S. sphacelata) for which multiple accessions were tested ( Table 1). Seeds were germinated in May and plants were grown under standard conditions in the greenhouse of the University Paris-sud (Orsay, France). During the period of development, the minimum and maximum temperature means ranged from 88C to 428C. The same individuals were used for the karyological analysis and for flow cytometry. Karyological Analysis Root tips were treated with 8-hydroxyquinolin (0.002 M) for 2 h at 168C and fixed in ethanol-acetic acid 3:1 (v/v) modified from Crouillebois and Siljak-Yakovlev (1989). Fixed and hydrolyzed (8 min in 1 N HCl at 608C) roots were Feulgen stained, then squashed under a coverslip in a drop of aceto carmin. Chromosome number was determined for at least 25 metaphases on root tips of five different individuals per species ( Table 1). Genome Size and Base Composition Determination The determination of nuclear DNA content and base composition by flow cytometry requires comparative measurements with an internal standard. Two internal standards were used: Lycopersicon esculentum (2C 5 2.01 pg and 40% GC) and Petunia hybrida (2C 5 2.85 pg and 41% GC) (Marie
Table 1. List of Setaria spp. accessions and determination of chromosome numbers and ploidy levels Chromosome number and ploidy level (2n) Geographical origin
Sample Accession size number
Determined in this Published study data
South Africaa Pakistanb South Africaa Hungaryb Chinac Francec China 1c China 2c South Africaa South Africaa
5 5 5 5 5 4 5 5 5 4
PI209208 078196 PI464546 017400 22-92 177-86 129-86 128-86 PI365018 PI314901
2x 2x 2x 2x 2x 2x 2x 2x 2x 4x
5 5 5 5 5 5 5 5 5 5
18 18 18 18 18 18 18 18 18 36
S. incrassata Hack. Zimbabwea S. leiantha Hack. Argentinaa S. neglecta South Africaa S. palmifolia ( Koenig) Stapf New Guineaa S. parviflora (Poiret) Kerguelen Mexicoa S. queenslandica Domin. Australiaa S. sphacelata (Schum.) Stapf & Hubb. Mexicoa Taiwana S. macrostachya H.B. & K. Mexicoa S. pumila Nob. Afghanistana Indiaa
3 5 5 5 5 5
PI299072 PI304866 PI353402 PI354405 PI216544 PI316342
4x 4x 4x 4x 4x 4x
5 5 5 5 5 5
36 36 36 36 36 36
5 4 4 5 5
PI451734 PI282707 PI216573 PI223294 PI271610
4x 4x 6x 6x 6x
5 5 5 5 5
36 36 54 54 54
Species S. holstii Herrm. S. italica ( L.) Beauv.
S. viridis ( L.) Beauv.
S. woodii Hack. S. chevalieri Stapf
4x 5 36d 2x 5 18e
2x 5 18f 2x 5 18d 4x 5 36,g 6x 5 54,f 2x 5 18h ? ? 6x 5 54i ? ? 2x 5 18,j 4x 5 36,g 6x 5 54j 6x 5 54,j 8x 5 72k 4x 5 36l
Seeds from National Institute of Agrobiological Resources (Japan). Seeds obtained from North Central Regional Plant Introduction Station ( Iowa State University). c Seeds obtained from millet collection of Orsay ( University of Paris XI, Orsay, France). d Raman et al. (1959). e Chistopher and Abraham (1976). f Moffett and Hurcombe (1949). g de Wet and Anderson (1956). h Gupta and Singh (1977). i Mehra and Sharina (1975). j de Wet (1958). k Brown (1950). i Singh and Godward (1960). a
b
Table 2. Nuclear DNA content and base composition in Setaria
Species S. holstii S. italica
S. viridis
S. S. S. S. S. S. S. S. S.
woodii chevalieri incrassata leiantha neglecta palmifolia parviflora queenslandica sphacelata
S. macrostachya S. pumila
Ploidy level
2C DNA (pg)
DNA per haploid genome (pg)
2x 2x 2x 2x 2x 2x 2x 2x 2x 4x 4x 4x 4x 4x 4x 4x 4x 4x 6x 6x 6x
1.70 1.03 1.04 1.02 1.03 1.04 1.03 1.00 1.66 4.46 4.23 2.40 3.50 3.88 4.82 2.76 2.06 3.31 3.60 5.14 5.26
0.85 0.51 0.52 0.51 0.51 0.52 0.51 0.50 0.83 1.11 1.06 0.60 0.87 0.97 1.20 0.69 0.51 0.83 0.60 0.86 0.88
Standard deviation in parentheses. Hubbard 1930).
a
(0.02) (0.02) (0.01) (0.01) (0.00) (0.01) (0.01) (0.01) (0.03) (0.06) (0.02) (0.02) (0.07) (0.04) (0.04) (0.04) (0.01) (0.12) (0.06) (0.09) (0.06)
GC base composition (GC%) 41.4 (0.13)
43.2 (0.21) 41.2 (0.57)
41.0 42.2 41.8 41.5 43.4 43.4 42.1 42.1 41.8 42.2 41.2 42.5
(0.07) (0.36) (0.18) (0.09) (0.00) (0.09) (0.28) (0.11) (0.85) (0.08) (0.09) (0.20)
Life cyclea P A A A A A A A ? P ? ? ? P P ? P P P A A
A 5 annual, P 5 perennial (Amigo et al. 1991; Rominger 1962: Stapf and
and Brown 1993). The internal standard chosen was Petunia hybrida except for S. palmifolia, S. queenslandica, S. neglecta, and S. sphacelata, for which Lycopersicon esculentum was used. Leaf tissue of each sample was chopped with a razor blade together with the internal standard in Galbraith et al. (1983) buffer modified by adding 10 mM of sodium metabisulfite. The suspension was filtered through 30 mm mesh nylon. To determine genome size, ethidium bromide (50 mg/ml, Sigma) was used as a DNA-specific fluorochrome (not dependent on base composition), using 5 min incubation in RNAse (2.5 units/ml, Boehringer-Mannheim). Measurements were made on the five individuals used for the karyological analysis. Base composition was determined using bisbenzimide Hoechst 33342 (5 mg/ml; Aldrich) and mithramycin (50 mg/ml in 50 mM MgCl2; Sigma), respectively AT- and GC-specific fluorochromes. In a preliminary experiment, five individuals from two accessions were tested: S. italica from China (no. 22-92) and S. viridis from France (no. 177-86). This experiment showed no differences in base composition between individuals, and all subsequent measures were done on two individuals per species. The flow cytometer was an EPICS V (Coultronics, France). The ethidium bromide analysis was repeated 5–10 times for the each specimen, and at least 4 times for both Hoechst and mithramycin. Each measure comprised the analysis of about 5,000 nuclei. The fluorescent ratio of each sample was calculated from the fluorescence intensity of the G0-G1 nuclei relative to that of the 2C standard. The DNA content was obtained by multiplying this ratio by the DNA content of the standard. The results were compared using a Mann-Whitney U test. The base composition (AT% and GC%) was determined using a nonlinear model formulated by Godelle et al. (1993).
Results and Discussion Genome Size and Ploidy Level in Setaria Species Complex Setaria italica and its wild relative S. viridis have a similar 2C genome size ( Table 2) of 1 pg (P , .01 for all pairwise comparisons), which ranks these species with Oryza sativa ( Bennett and Leitch 1995) among the smallest genome size in cereal crops. This result is consistent with genetic data ( Darmency et al. 1987; Zangre´ et al. 1992) classifying these two forms as unique
Brief Communications 557
members of the primary gene pool, that is, as conspecific. Distinctive ploidy levels compared to published data were found for S. holstii, S. pumila, S. palmifolia, confirming the presence of several ploidy levels within these species ( Table 1). No significant differences were found (P . .05 for all pairwise comparisons) among geographical accessions for the species S. viridis, S. italica, S. pumila, and S. sphacelata ( Table 2); thus no trends associating geographic location and DNA content was evident. Interspecific variability observed within the tetraploids and the hexaploids was important. The nuclear genome value ranged from 2.06 pg to 4.82 pg for tetraploids, and from 3.6 pg to 5.26 pg for hexaploids. Differences in DNA content observed for the same ploidy level could result from genomic events increasing DNA content such as variation in heterochromatin content or in dispersed repeat sequences such as transposons (Cerbah et al. 1995; Dean and Schmidt 1995; Godelle et al. 1993). In some cases these differences were more than twofold. The interspecific and intraspecific variation of ploidy level and nuclear DNA content need to be further investigated in order to classify these species into secondary or tertiary gene pools. This can be achieved by analyzing chromosome pairing in hybrids among these species and species belonging to the primary gene pool. The hexaploid species (S. pumila and S. macrostachya) are said to belong to the tertiary pool. Whether the differences in DNA content constitute a barrier to hybridization is questionable and can be tested. Three wild species have the same chromosome number as S. italica: S. holstii, S. woodii, and S. viridis. S. viridis has similar DNA content to S. italica. Useful agronomic traits could therefore be transferred to cultivated foxtail millet by conventional breeding schemes such as backcrossing. Green foxtail millet has already been used to transfer atrazine and triazine resistance ( Darmency and Perne`s 1985; Ricroch et al. 1987; Zangre´ 1986) into foxtail millet. The transfer of resistance to dinitroaniline and sethoxydim has been reported for foxtail millet (Wang and Darmency 1997; Wang et al. 1997). For S. holstii and S. woodii, which have significant differences (P , .01 for all pairwise comparisons with S. italica) in DNA content with S. italica, crossability with S. italica must be further investigated. In the Oryza complex, transferring resistance to brown planthopper from O. australiensis, a wild
558 The Journal of Heredity 1998:89(6)
rice species belonging to the tertiary gene pool, to cultivated rice O. sativa has been shown ( Ishii et al. 1994). Polyploidy and Life Cycle Polyploidy may be correlated with several life-history traits ( Bennett 1972). Indeed, the majority of polyploids have been found in perennial herbs, and most polyploid annual grasses are self-fertilizing plants (Jackson 1976). Furthermore, it has been proposed that, within a genus, an increase in DNA amount affects the duration of cell division: the higher the DNA C value, the longer the cell cycle (Maszewski and Kolodziejczyk 1991; Rees and Narayan 1981). Thus short-lived, ephemeral plants would have, in general, lower nuclear DNA amounts than long-lived perennial plants. However, much of the variation in genome size is not correlated with organismic complexity. In our sample ( Table 2), six species (S. holstii, S. macrostachya, S. chevalieri, S. parviflora, S. palmifolia, S. sphacelata) are perennials and three are annuals (S. italica, S. viridis, S. pumila). For the perennials, genome size ranged from 1.7 to 4.82 pg and the three ploidy levels were represented. For annuals, values ranged from 1.0 to 5.26 pg. The haploid (1C) value of annuals (from Table 2) ranged between 0.50 and 0.88 pg, while that of perennials was 0.51 to 1.20 pg. Setaria Genus Within Poaceae Family Base composition within the Setaria genus was evaluated independently with mithramycin and bisbenzimide Hoechst: the calculated GC percentage ranged from 41.0 to 43.4. This result is altogether typical for the Poaceae: Triticum aestivum, 43.7%, and Zea mays, 44.5% (Marie and Brown, 1993); Pennisetum spp. ranged from 42.7 to 44.9% (Martel et al. 1997). Nuclear DNA content within Poaceae ranges from 1 pg for rice and foxtail millet (our data) to 33 pg for T. aestivum L. ( Bennett and Leitch 1995). Comparative mapping is an important tool in current research, including that aimed at understanding the evolution of grasses. Genetic maps are available for the major cereal crops (maize, rye, rice, wheat, barley, oat, sorghum, pearl and foxtail millet). Comparative mapping has revealed the conservation of cereal genomes by demonstrating the colinearity of their maps (Ahn and Tanksley 1993). Extensive colinearity of wheat, rye, barley, rice, and maize genomes ( Devos et al. 1994; Saghai Maroof et al. 1996; Sherman et al. 1995) has been demonstrated. Paterson et al. (1995) have
recently shown a correspondence between quantitative trait loci (QTL) involved in the domestication process of rice, maize, and sorghum. Its small genome size and its genetic map (Wang et al., 1998) aligned with other cereal maps make S. italica a good species for comparative mapping studies. In addition, compared to rice it is a temperate crop belonging to the Panicoideae subfamily that is closer to the Pooideae subfamily than Bambusoideae, which includes Oryza species among others ( Kellogg and Linder 1995). From the Laboratoire Evolution et Syste´matique, Ba ˆtiment 362, Universite´ PARIS XI-CNRS, URA 2154, 91405 Orsay cedex, France ( Le Thierry d’Ennequin, Panaud, Siljak-Yakovlev, and Sarr), and Cytome´trie, Institut des Sciences Ve´ge´tales, Gif-sur-Yvette cedex, France ( Brown). The authors thank J-M. Bureau and D. De Nay for their technical assistance, and Malika Cerbah for her precious help. Address correspondence to M. Le Thierry d’Ennequin at the address above or e-mail:
[email protected]. q 1998 The American Genetic Association
References Ahn S and Tanksley SD, 1993. Comparative linkage maps of the rice and maize genomes. Proc Natl Acad Sci 90:7980–7984. Amigo J, Bujan M, and Romero MI, 1991. Re´vision taxonomique du genre Setaria (Gramineae) dans la pe´ninsule Ibe´rique. Bull Soc Bot Fr 138( lettres bot. (2)): 155–165. Arumuganathan K and Earle ED, 1991. Nuclear DNA content of some important plant species. Plant Mol Biol Rep 9:208–218. Bennett MD, 1972. Nuclear DNA amount and minimum generation time in herbaceous plants. Proc R Soc Lond B 191:109–135. Bennett MD, and Leitch IJ, 1995. Nuclear DNA amounts in angiosperms. Ann Bot 76:113–176. Berhaut J, 1954. Flore du Se´ne´gal. Dakar: Librairie Clairafrique. Bharathan G, Lambert G, and Galbraith DW 1994. Nuclear DNA content of monocotyledones and related taxa. Am J Bot 8:381–386. Brown WV, 1950. A cytological study of some Texas Gramineae. Bull Torrey Bot Club 77:63–76. Cerbah M, Coulaud J, Godelle B, and Siljak-Yakovlev S. 1995. Genome size, fluorochrome banding, and karyotype evolution in some Hypochoeris species. Genome 38:689–695. Chistopher J and Abraham A, 1976. Studies on the cytology and phylogeny of south India grasses. Cytologia 41:621–637. Crouillebois ML and Siljak-Yakovlev S, 1989. A karyological study of Chinese ‘‘glutineux rouge’’ and French ‘‘burganjou’’ varieties of millet (Setaria italica ( L.) P.B.). Caryologia 42(3–4):217–224. Darmency H and Perne`s J, 1985. Use of wild Setaria viridis ( L.) Beauv. to improve triazine resistance in cultivated S. italica ( L.) by hybridization. Weed Res 25: 175–179. Darmency H, Zangre´ GR, and Perne`s J, 1987. The wild weed crop complex in Setaria italica: a hybridization study. Gentica 75:103–107. Dean C and Schmidt R, 1995. Plant genomes: a current
molecular description. Annu Rev Plant Physiol Plant Mol Biol 46:395–418.
in North America. In: Illinois Biological Monographs, vol. 29. Urbana, Illinois: University of Illinois Press.
Devos KM, Chao S, Li QY, Simonetti MC, and Gale MD, 1994. Relationship between chromosome 9 of maize and wheat homeologous group 7 chromosomes. Genetics 138:1287–1292.
Saghai Maroof MA, Yang GP, Biyashev RM, Maughan PJ, and Zhang Q, 1996. Analysis of the barley and rice genomes by comparative RFLP linkage mapping. Theor Appl Genet 92:541–551.
de Wet JMJ, 1958. Additional chromosome numbers in Transvaal grasses. Cytologia 23:113–118.
Sherman JD, Fenwick AL, Namuth DM, and Lapitan NLV, 1995. A barley RFLP map: alignment of three barley maps and comparisons to Gramineae species. Theor Appl Genet 91:681–690.
de Wet JMJ and Anderson LJ, 1956. Chromosome numbers in Transvaal grasses. Cytologia 21:1–10. de Wet JMJ, Oestry-Stidd LL, and Cubero JI, 1979. Origins and evolution of foxtail millets. J d’Agric Trad Bot Appl XXVI:53–64. Galbraith DW, Harkins KR, Maddox JM, Ayres NM, Sharma DP, and Firoozabady E, 1983. Rapid flow cytometric analysis of the cell cycle in intact plant tissues. Science 220:1049–1051. Godelle B, Cartier D, Marie D, Brown SC, and SiljakYakovlev S, 1993. Heterochromatin study demonstrating the non-linearity of fluorometry useful for calculating genomic base composition. Cytometry 14:618–626.
Singh DN and Godward MBE, 1960. Cytological studies in the Gramineae. Heredity 15:193–199. Stapf O and Hubbard CK, 1930. Setaria. In: Flora of tropical Africa, vol. 9 (Prain, ed). London: Crown Agents; 768–866. Wang T and Darmency H, 1997. Inheritance of sethoxydim resistance in foxtail millet, Setaria italica ( L.) Beauv.. Euphytica 94:69–73. Wang T, Fleury A, Ma J, and Darmency H, 1997. Genetic control of dinitroaniline resistance in foxtail millet (Setaria italica). J Hered 87:423–426.
Gupta PK and Singh RV, 1977. Variations in chromosomes and flavonoids in Setaria Beauv. Nucleus 20:167– 171.
Wang ZM, Devos KM, Wang RQ, and Gale MD, 1998. Construction of RFLP-based map of foxtail millet, Setaria italica ( L.) Beauv. Theor Appl Genet 96:31–36.
Ishii T, Brar DS, Multani DS, and Khush GS, 1994. Molecular tagging of genes for brown planthopper resistance and earliness introgressed from Oryza australiensis into cultivated rice, O. sativa. Genome 37:217–221.
Zangre´ R, 1986. Contribution a` l’e´tude de la domestication et de l’ame´lioration du millet Setaria italica ( L.) P.B.: analyse de descendances d’un croisement S. viridis ( L.) P.B., S. italica ( L.) P.B. (PhD dissertation). Rennes, France: University of Paris XI.
Jackson RC, 1976. Evolution and systematic significance of polyploidy. Annu Rev Ecol Syst 7:209–234. Jusuf M and Perne`s J, 1985. Genetic variability of foxtail millet (Setaria italica) Electrophoretic study of five isozymes systems. Theor Appl Genet 71:57–60. Kellogg EA, and Linder HP, 1995. Phylogeny of poales. In: Monocotyledones: systematics and evolution (Rudall PJ, Cribb PJ, Cutler DF, and Himphried CJ, eds). Kew, England: Royal Botanic Gardens; 511–542. Li Y and Wu S, 1996. Traditional maintenance and multiplication of foxtail millet (Setaria italica ( L.) P. Beauv.) landraces in China. Euphytica 87:33–38. Li Y, Wu S, and Cao Y, 1995. Cluster analysis of an international collection of foxtail millet (Setaria italica) ( L.) P. Beauv. Euphytica 83:79–85. Marie D and Brown SC, 1993. A cytometric exercise in plant DNA histograms, with 2C values for 70 species. Biol Cell 78:41–51. Martel E, de Nay D, Siljak-Yakovlev S, Brown S, and Sarr A, 1997. Genome size and basic chromosome number in pearl millet and fourteen related Pennisetum species. J Hered 88:139–143. Maszewski J, and Kolodziejczyk P, 1991. Cell duration in antheridial filaments of Chara spp. (Characeae) with different genome size and heterochromatin content. Plant Syst Evol 175:23–38. Mehra PN and Sharma ML, 1975. Cytological studies in some central and eastern Himalayan grasses. Cytologia 40:75–89. Moffett AA and Hurcombe R, 1949. Chromosome numbers of South African grasses. Heredity 3:369–373. Paterson AH, Lin YR, Li Z, Schertz KF, Doebley JF, Pinson SRM, Liu SC, Stansel JW, and Irvine JE, 1995. Convergent domestication of cereal crops by independent mutations at corresponding genetic loci. Science 269: 1714–1718. Raman VS, Chandrasekharan P, and Krishnaswami D, 1959. Chromosome numbers in Gramineae. Curr Sci 28: 453–454. Rees H and Narayan RKJ, 1981. Chromosomal DNA in higher plants. Phil Trans R Soc Lond B 292:569–578. Ricroch A, Mousseau M, Darmency H, and Perne`s J, 1987. Comparison of triazine-resistant and -susceptible cultivated Setaria italica: growth and photosynthetic capacity. Plant Physiol Biochem 25:29–34. Rominger JM, 1962. Taxonomy of Setaria (Gramineae)
Zangre´ R, Nguyen-van E, Rherissi B, and Till-Bottraud I, 1992. Organisation du pool ge´nique de Setaria italica ( L.) P. Beauv. et exploitation des ressources ge´ne´tiques d’espe`ces spontane´es. In: Complexes d’espe`ces, flux de ge`nes et ressources ge´ne´tiques des plantes ( Lavoisier, ed). Paris: BRG; 87–97. Received February 10, 1997 Accepted May 7, 1998 Corresponding Editor: William F. Tracy
Inbreeding Depression and Outcrossing Rate in the Endangered Autotetraploid Plant Aster kantoensis (Asteraceae) K. Inoue, M. Masuda, and M. Maki Inbreeding depression in a population of an endangered autotetraploid plant, Aster kantoensis (Asteraceae), was estimated over a 2 year period. The first-year survival rate of the outcrossed progeny was significantly higher than that of the selfed progeny. After 2 years the number of flowers per reproductive individual was also greater in the outcrossed progeny, and the composite value of inbreeding depression was 0.790. The multilocus estimate of outcrossing rate in the population is 0.883 6 0.064. The high value of inbreeding depression is consistent with the predominant outcrossing of the population. In the last two decades, inbreeding depression has been one of the major topics
of study in evolutionary biology because it greatly influences the evolution of reproductive systems (Charlesworth and Charlesworth 1990; Charlesworth et al. 1990; Holsinger 1991; Lande and Schemske 1985; Lande et al. 1994; Schemske and Lande 1985; Uyenoyama and Waller 1991a–c). Some theoretical studies have predicted that the incidence of inbreeding depression in a population or species is related to certain attributes of that population. For example, these studies expected the incidence of inbreeding depression to be lower in selfing populations than in outcrossing ones (Charlesworth and Charlesworth 1990; Charlesworth et al. 1990; Lande and Schemske 1985). Several experimental findings support the existence of this relationship ( Holtsford and Ellstrand 1990; Latta and Ritland 1994; McCall et al. 1994; Willis 1993), but a few could not find a clear relationship ( Barrett and Kohn 1991; Waller 1993). Lande and Schemske (1985) also predicted that the equilibrium level of inbreeding depression in tetraploid populations will be half of that in its diploid progenitor populations under the partial dominance of deleterious genes. Few studies, however, have examined inbreeding depression in autotetraploid species (cf. Husband and Schemske 1997). Recently it has been found that the autotetraploid species are more common in natural plant populations than was formerly believed (Soltis and Soltis 1993). This finding raises the question of under what conditions will polyploid individuals become established in diploid populations. According to theoretical studies, polyploids will become established when their fertility or viability is greater than that of the diploids ( Felber 1991; Rodriguez 1996). Thus inbreeding depression, as a factor in viability, is relevant to the evolution of polyploidy when the selfing rate is similar between diploids and polyploids. Aster kantoensis Kitamura (Asteraceae) is an endangered plant endemic to Japan ( Ito and Soejima 1995). The chromosome number of the species is 2n 5 36. Because basic chromosome number of Japanese Aster is x 5 9 (Watanabe 1997), A. kantoensis is a tetraploid species. Inheritance of allozyme markers are tetrasomic (Maki et al. 1996b), suggesting that this species is autotetraploid (Maki et al. 1996b). In this study we estimated the level of inbreeding depression over the course of two years and the outcrossing rate in a natural population of A. kantoensis.
Brief Communications 559
Materials and Methods Plant Materials Aster kantoensis is a monocarpic perennial, usually requiring several years to reproduce ( Takenaka et al. 1996; Washitani et al. 1997). Its seeds germinate in April or May with only slight primary dormancy. This species is typical of riparian plant species in that it invades new open sites after river flooding and establishes large populations before other competitive perennial species are able to establish themselves. This species is partially autogamous; bagging experiments have shown that approximately 60% of individuals fail to produce seeds in isolation, although seed set is more than 50% in 11% of the individuals ( Inoue et al. 1994). In natural populations, syrphid flies and butterflies are the dominant pollinators of A. kantoensis ( Inoue et al. 1994). The Red Data Book of Japanese wild plants lists A. kantoensis as ‘‘vulnerable to extinction ( EPSG 1989), a condition brought about over the last three decades as the habitats of this species have been destroyed by flood prevention practices and the construction of athletic facilities ( EPSG 1989; Kuramoto 1987, 1995; Kuramoto and Sone 1985; Kuramoto et al. 1992). Estimation of Inbreeding Depression More than 70 rosettes were collected from a natural population of A. kantoensis in Kusabana in Akiruno City in the winter of 1990 and maintained in a greenhouse at Shinshu University. In the autumn of 1991, when more than 65 individuals bolted, approximately half of the heads were bagged to prevent outcrossing. In order to allow the remaining heads to be open-pollinated, the greenhouse windows were left open to allow flying insects to enter freely. A wasp species (Polistes chinensis Fabriens) frequently visited the open-pollinated heads of A. kantoensis which produced seeds as in natural populations (approximately 70 seeds per head). While 56% bagged heads produced dramatically fewer seeds (fewer than 10), the bagged heads of 11 plants produced a total of more than 30 seeds at the whole plant level, in spite of the bagging. These 11 plants also produced many seeds by open-pollination. In our estimation of inbreeding depression for 2 years, we used both outcrossed and selfed seeds from these 11 individuals which produced seeds by both treatments. In the early spring of 1992, we placed both the outcrossed and selfed seeds in
560 The Journal of Heredity 1998:89(6)
Table 1. Relative performance of the outcrossed and the selfed progeny of A. kantoensis in the 1992 census
Outcrossed Selfed 1–self/out Significance
a
Survivorship
Stem diameter
Proportion of flowering
0.314 (0.089)a 0.241 (0.090) 0.232 ,0.05
1.399 (0.214) 1.281 (0.111) 0.084 n.s.
0.050 (0.081) 0.018 (0.060) 0.640 n.s.
Significance was determined by Wilcoxon’s signed-rank test. Values in parentheses are standard deviations.
peat moss plates and cultured them at 208C in a growth chamber for 3 weeks. We planted these seedlings in sand-filled plastic pots in April 1992 and maintained them in the nursery of the Botanical Gardens, University of Tokyo, for 2 years (1992 and 1993). Forty seedlings from the outcrossed and the selfed seeds of each individual were planted. When the numbers of the seedlings obtained were less than 40 for an individual, all the seedlings were planted. In November 1992, we censused the survivorship of the progeny array. Since the stem diameter is well correlated with above-ground biomass ( Takenaka et al. 1996), we measured the stem diameters for the surviving plants at the ground surface using a degimatic calliper. Because a few individuals flowered in 1992, we counted the number of flowering individuals. From November 1992 to November 1993 the surviving plants were maintained in the nursery. In November 1993, we censused the survivorship of the progeny, the number of flowering individuals per progeny array, and the number of flowers on each of the reproductive individuals. As in 1992, we measured the stem diameters for the surviving plants. Inbreeding depression was estimated as 12(the mean performance of selfed progeny/the mean performance of outcrossed progeny) for the following components: the survivorship in 1992, the proportion of survivors flowering in 1992, the stem diameter of the survivors in 1992, the continuing survivorship in 1993 of the 1992 survivors, the proportion of survivors flowering in 1993, the number of flowers per flowering individual in 1993, and the stem diameter of survivors in 1993. The composite value of inbreeding depression through 2 years was calculated by 1 2 P(wsi/wci), where wsi and wci are the mean performances of the selfed and the outcrossed progeny at the life-history component i, respectively (A˚gren and Schemske 1993; Husband and Schemske 1996). Considering that the fitness components measured are not all indepen-
dent, we used the following four components for the estimation of the composite inbreeding depression: the survival to 1992, the survival to 1993, the proportion of flowering in 1993, and the number of flowers in 1993, excluding data on flowering in 1992 because a very small number of individuals flowered in 1992. Estimation of Outcrossing Rate A head was sampled from each of 24 naturally occurring individuals in the population Kusabana in December 1993. We germinated these seeds at 208C in a growth chamber and cultured them for approximately 1 month. The genotypes of four to six seedlings per progeny were determined by starch-gel electrophoresis. Protocols for enzyme extraction, horizontal starch-gel electrophoresis, and stain recipes were followed as described by Maki et al. (1996a). Five enzyme species were stained: aconitase (ACO), alcohol dehydrogenase (ADH), aspartate aminotransferase (AAT ), 6-phosphogluconate dehydrogenase (6-PGDH), and shikimate dehydrogenase (SkDH). A total of seven polymorphic loci (6pgdh-1, 6pgdh-2, Skdh, Aco-1, Aco-2, Adh, and Aat-2) were scored for 118 individuals in 24 families. Selfing rates and their standard errors were estimated by the mating system program TETRAT, developed by Ritland (1990). For loci with more than two alleles, the less frequent alleles were combined into a single class.
Results In 1992 the proportion of surviving progeny was significantly higher for outcrossed progeny than for selfed progeny ( Table 1). The magnitude of inbreeding depression among the first-year survivors was 0.232. The mean stem diameter was not significantly different between the outcrossed and the selfed progeny ( Table 1). Only a small percentage of the survivors flowered in 1992, and the proportion of flowering plants in the survivors was not
Table 2. Relative performance of the outcrossed and the selfed progeny of A. kantoensis in the 1993 census
Outcrossed Selfed 1–self/out Significance
a
Survivorship
Stem diameter
Proportion of flowering
Number of flowers
0.589 (0.169) 0.406 (0.275) 0.311 n.s.
1.740 (0.380) 1.809 (0.315) 20.040 n.s.
0.652 (0.303) 0.747 (0.293) 20.146 n.s.
102.9 (27.7) 35.7 (23.7) 0.653 ,0.01
a
Significance was determined by Wilcoxon’s signed-rank test. Values in parentheses are standard deviations.
significantly different between the outcrossed and the selfed progeny ( Table 1). Although the number of flowers per flowering individual was counted in 1992, a significance test was not carried out because of the very small sample size. In 1993 the three components—survivorships, stem diameter, and the proportion of flowering plants—were not significantly different between the outcrossed and the selfed progeny, but the mean number of flowers per reproductive individual was significantly larger in the outcrossed progeny than in the selfed group ( Table 2). The magnitude of inbreeding depression based on estimates of flower production was 0.653 ( Table 2). The composite value of inbreeding depression was 0.790 (5 1 2 0.767 3 0.689 3 1.146 3 0.347) when including four components—the survival to 1992, the survival to 1993, the proportion of flowering in 1993, and the number of flowers in 1993— and was 0.733 (5 1 2 0.767 3 0.347) when including only the two statistically significant components—the survival to 1992 and the number of flowers in 1993. The multilocus estimate of the outcrossing rate was very high (0.883 6 0.064), and the single-locus estimate was somewhat lower (0.767 6 0.057). The difference in outcrossing rate between multilocus and single-locus analysis was significantly positive (P , .05).
Discussion For the last decade, much attention has been paid to inbreeding depression in plants. Previous studies focused on the effects of mating systems on inbreeding depression and revealed that inbreeding depression tends to be greater in outcrossing species than in selfing species ( Barrett and Kohn 1991; Husband and Schemske 1996). Lande and Schemske (1985) considered the effect of ploidy level on inbreeding depression and predicted that inbreeding depression would be smaller in autotetraploids than in diploids. However, because there are only a few studies on the
inbreeding depression and selfing rate in autotetraploid plant species, at present we cannot evaluate the levels of inbreeding depression observed in certain autotetraploid species. Although naturally occurring autotetraploids had been believed to outcross exclusively (Mac Key 1970), a few recent studies which examine the outcrossing rate in natural populations of autotetraploid species revealed the partial selfing in the population by allozyme variation ( Husband and Schemske 1997; Murawski et al. 1994). A. kantoensis is a predominantly outcrossing autotetraploid, although partially selfing. As demonstrated in our 2 years of experimentation with selfing in A. kantoensis, significant differences were found between the outcrossed and the selfed progeny, notably in the first-year survivorship and in the number of flowers per flowering individual in the second year. The magnitude of the composite inbreeding depression was very high, even compared to an outcrossing diploid plant species ( Husband and Schemske 1996). This result was unexpected, because the population turnover of A. kantoensis is very rapid and the population was most likely founded by a few individuals ( Kuramoto 1995; Maki et al. 1996a). In this kind of population dynamic, deleterious genes are expected to be purged from the subject populations, reducing the rate of inbreeding depression (Schemske and Lande 1985). In addition to the population dynamics of the species, tetraploidy is also expected to reduce the inbreeding depression ( Husband and Schemske 1997; Lande and Schemske 1985). Unfortunately the maintenance mechanism of deleterious mutations in autotetraploid populations has been theoretically examined less intensively than in diploid populations ( Bever and Felber 1991). In addition, only a few studies have measured the inbreeding depression in wild autotetraploid plant species ( Busbice and Wilsie 1966; Husband and Schemske 1997). In Epilobium angustifolium, inbreeding depression is higher
for diploids than for tetraploids, corresponding to the previous theoretical expectation ( Husband and Schemske 1997; Lande and Schemske 1985). Although it is not clear at present which is the most closely related diploid to A. kantoensis, A. asa-grayi is a candidate ( Ito et al. 1994). Estimation of inbreeding depression and outcrossing rate for A. asa-grayi is therefore necessary for the elucidation of the effect of tetraploidy on inbreeding depression in A. kantoensis. Studies on inbreeding depression and selfing rate in A. asagrayi are now on progress. Because we obtained the outcrossed seeds by open pollination in a greenhouse, these might contain some selfed seeds. However, the pollinator visitations were more frequent in a greenhouse than in natural conditions, and thus we can regard almost all of the seeds as outcrossed. Moreover, if the outcrossed seeds contained some selfed seeds, inbreeding depression would be somewhat underestimated. Among outcrossing species, the magnitude of inbreeding depression is particularly high in primary life-history components such as seed production, although the inbreeding depression values at the survival, growth, and reproduction stages are also considerable ( Husband and Schemske 1996). Because we did not obtain selfed progeny by hand-pollination, inbreeding depression at the seed development stage could not be estimated from our research. Even disregarding the seed development stage, however, we see that the magnitude of the inbreeding depression was very high in A. kantoensis. If the viability of selfed progeny is weak, it is unlikely that only one solitary individual can found a large population. At the very least, several individuals are essential to found a new population. Previous population dynamic studies showed that A. kantoensis rapidly establishes its population at newly open flood sites ( Kuramoto 1995; Kuramoto et al. 1992). Because no seed bank is considered to be formed in A. kantoensis (Washitani et al. 1997), seeds from different individuals were simultaneously transferred from other upstream populations by water. Studies on seed migration are needed to clarify the population and genetic dynamics of A. kantoensis and to manage the conservation of the species. From Biological Institute and Herbarium, Faculty of Science, Shinshu University, Nagano, Japan ( Inoue), Department of Biology, Faculty of Science, Kyushu University, Fukuoka, Japan (Masuda), and Department of Biology, Fukuoka University of Education, Akama, Mu-
Brief Communications 561
nakata, Fukuoka, 811-41 Japan (Maki). We thank Dr. Kuramoto and Dr. Washitani for their helpful suggestions. This study was supported in part by the Tokyu Foundation for Better Environment (to K. Inoue), by a the grant-in-aid from the Japanese Ministry of Education, Science and Culture (to K. Inoue and M. Maki), and by the Global Environment Research Fund ( F-1) of the Japan Environment Agency (to M. Maki). Address correspondence to Dr. Maki at the address above or e-mail:
[email protected].
Kuramoto N and Sone N, 1985. Vegetation conservation and land-use in the floodplain of the River Tama. J Jpn Inst Landscape Arch 48:169–174 (in Japanese with English summary). Kuramoto N, Takenaka A, Washitani I, and Inoue K, 1992. A conservation biology of Aster kantoensis growing along the Tama River. J Jpn Inst Landscape Arch 55:199–204 (in Japanese with English summary).
q 1998 The American Genetic Association
Lande R and Schemske DW, 1985. The evolution of selffertilization and inbreeding depression in plants. I. Genetic models. Evolution 39:24–40.
References
Lande R, Schemske DW, and Schultz S, 1994. High inbreeding depression, selective interference among loci, and the threshold selfing rate for purging recessive lethal mutations. Evolution 48:965–978.
A˚gren J and Schemske DW, 1993. Outcrossing rate and inbreeding depression in two annual monoecious herbs, Begonia hirtusa and B. semiovata. Evolution 47: 125–135. Barrett SCH and Kohn JR, 1991. Genetic and evolutionary consequences of small population size in plants: implications for conservation. In: Genetics and conservation of rare plants ( Falk DA and Holginger KE, eds). Oxford: Oxford University Press; 3–30.
Latta R and Ritland K, 1994. The relationship between inbreeding depression and prior inbreeding among populations of four Mimulus taxa. Evolution 48:806–817. Mac Key J, 1970. Significance of mating systems for chromosomes and gametes in polyploids. Hereditas 66: 165–176.
Bever JD and Felber F, 1991. The theoretical genetics of autopolyploidy. Oxford Surv Evol Biol 7:185–217.
Maki M, Masuda M, and Inoue K, 1996a. Genetic diversity and hierarchical population structure of a rare autotetraploid plant, Aster kantoensis (Asteraceae). Am J Bot 83:296–304.
Busbice TH and Wilsie CP, 1966. Inbreeding depression and heterosis in autotetraploids with application to Medicago sativa L. Euphytica 15:52–67.
Maki M, Masuda M, and Inoue K, 1996b. Tetrasomic segregation of allozyme markers in an endangered plant, Aster kantoensis. J Hered 87:378–380.
Charlesworth D and Charlesworth B, 1990. Inbreeding depression with heterozygote advantage and its effect on selection for modifiers changing the outcrossing rate. Evolution 44:870–888.
McCall C, Waller DM, and Mitchell-Olds T, 1994. Effects of serial inbreeding on fitness components in Impatiens capensis. Evolution 48:818–827.
Charlesworth D, Morgan MT, and Charlesworth B, 1990. Inbreeding depression, genetic load, and the evolution of outcrossing rates in a multilocus system with no linkage. Evolution 44:1469–1489. EPSG ( Endangered Plant Survey Group), 1989. Japanese red data book of plants. Tokyo: Nature Conservation Society of Japan. Felber F, 1991. Establishment of a tetraploid cytotype in a diploid population: effect of relative fitness of the cytotypes. J Evol Biol 4:195–207. Holsinger KE, 1991. Inbreeding depression and the evolution of plant mating systems. Trends Ecol Evol 6:307– 308. Holtsford TP and Ellstrand NC, 1990. Inbreeding effects in Clarkia tembloriensis (Onagaraceae) populations with different natural outcrossing rates. Evolution 44: 2031–2046. Husband BC and Schemske DW, 1996. Evolution of the magnitude and timing of inbreeding depression in plants. Evolution 50:54–70. Husband BC and Schemske DW, 1997. The effects of inbreeding in diploid and tetraploid populations of Epilobium angustifolium (Onagaraceae): implications for the genetic basis of inbreeding depression. Evolution 51:737–746. Inoue K, Washitani I, Kuramoto N, and Takenaka A, 1994. Factors controlling the recruitment of Aster kantoensis (Asteraceae). I. Breeding system and pollination system. Plant Spec Biol 9:133–136. Ito M and Soejima A, 1995. Aster. In: Flora of Japan IIIb. Angiospermae Dicotyledoneae Sympetalae ( Iwatsuki K, Yamazaki T, Boufford DE, and Ohba H, eds). Tokyo: Koudansha; 59–73. Ito M, Soejima A, and Nishino T, 1994. Phylogeny and speciation of Asian Aster. Kor J Plant Taxon 24:133–143.
Murawski DA, Fleming TH, Ritland K, and Hamrick JL, 1994. Mating system of Pachycereus pringlei: an autotetraploid cactus. Heredity 72:86–94. Ritland K, 1990. A series of FORTRAN computer programs for estimating plant mating systems. J Hered 81: 235–237. Rodriguez DJ, 1996. A model for the establishment of polyploidy in plants. Am Nat 147:33–46. Schemske DW and Lande R, 1985. The evolution of selffertilization and inbreeding depression in plants. II. Empirical observations. Evolution 39:41–52. Soltis DE and Soltis PS, 1993. Molecular data and the dynamic nature of polyploidy. Crit Rev Plant Sci 12: 243–273. Takenaka A, Washitani I, Kuramoto N, and Inoue K, 1996. Life history and demographic features of Aster kantoensis, an endangered local endemic of floodplains. Biol Conserv 78:345–352. Uyenoyama MK and Waller DM, 1991a. Coevolution of self-fertilization and inbreeding depression. I. Mutationselection balance at one and two loci. Theor Popul Biol 40:14–46. Uyenoyama MK and Waller DM, 1991b. Coevolution of self-fertilization and inbreeding depression. II. Symmetric overdominance in viability. Theor Popul Biol 40:47– 77. Uyenoyama MK and Waller DM, 1991c. Coevolution of self-fertilization and inbreeding depression. III. Homozygous lethal mutations at multiple loci. Theor Popul Biol 40:173–210. Waller DM, 1993. The statics and dynamics of mating system evolution. In: The natural history of inbreeding and outbreeding ( Thornhill NW, ed). Chicago: Chicago University Press; 97–117.
Kuramoto N, 1987. Vegetation changes and their causes in the floodplain of the River Tama. Appl Phyto Sociol 16:13–23 (in Japanese with English summary).
Washitani I, Takenaka A, Kuramoto N, and Inoue K, 1997. Aster kantoensis Kitam., an endangered flood plain endemic plant in Japan: instability of form persistent soil seed banks. Biol Conserv 82:67–72.
Kuramoto N, 1995. Conservation biological studies on Aster kantoensis along the Tama River. Bull Lab Landscape Arch Sci 15:1–120 (in Japanese).
Watanabe, K. 1997. Index to chromosome number of Japanese Asteraceae (1911–1996). Proc Jpn Soc Plant Taxon 12:1–64.
562 The Journal of Heredity 1998:89(6)
Willis JH, 1993. Effects of different levels of inbreeding on fitness components in Mimulus guttatus. Evolution 47:864–876. Received September 22, 1997 Accepted February 18, 1998 Corresponding Editor: Jonathan F. Wendel
Microsatellite Loci Identified in the Seagrass Posidonia oceanica (L.) Delile G. Procaccini and M. Waycott The detection of within- and between-population genetic variability in the Mediterranean seagrass Posidonia oceanica (L.) Delile, a difficult species to work with because of its genotypic homogeneity, longevity, and clonal growth, has been achieved through the development of six polymorphic microsatellite markers. The development of these markers is significant because previous studies indicate extreme levels of clonality in this seagrass species using minisatellite multilocus DNA fingerprints and RAPD markers. A further eight microsatellite regions were found to be monomorphic, but wider and more extensive population surveys may find variation with these microsatellite regions. Ten of the 14 microsatellite regions were observed to be present in two Australian con generic species, P. australis and P. sinuosa, suggesting that there is potential for their wide application in population genetic analyses in this genus. These markers represent an important contribution to population genetic analysis in seagrasses, a group of considerable interest because of their important role in nearshore benthic marine communities worldwide. Seagrasses are marine angiosperms that reproduce both sexually and clonally through rhizome growth which often results in extensive, continuous, monospecific meadows in many regions around the world (den Hartog 1970). The survival of these seagrass meadows may have profound implications on the stability of nearshore marine habitats (den Hartog 1970). The relative importance of the two reproductive strategies in forming and maintaining meadows is in many cases still unknown. To date, few studies have investigated the genetic structure of seagrass populations. Considerable genetic diversity has been shown within populations of the hermaphrodite Posidonia australis (Waycott 1995; Waycott and Sampson
1997; Waycott et al., in press), the monoecious Zostera marina (Alberte et al. 1994; Ruckelshaus 1995), and in the dioecious Cymodocea nodosa (Procaccini and Mazzella 1996), while almost complete genetic identity has been described for the dioecious Amphibolis antartica (Waycott et al. 1996) and for Posidonia oceanica (Procaccini et al. 1996; Procaccini and Mazzella 1996). The relationship between population genetic structure and breeding system in seagrasses is of interest because approximately 75% of all seagrass species are dioecious (Cox 1993; Les 1988), compared with the angiosperms as a whole where only 4–7% are dioecious (Richards 1986). The constraints placed on the breeding system, primarily through hydrophily (water pollination where the pollen is in contact with the water itself ), by life in the marine environment has been suggested to be the evolutionary driving force behind the high degree of dioecy in this group (Cox 1993; Cox and Knox 1988; Pettit et al. 1981). The study of evolution of dioecy among seagrasses requires detailed knowledge of the breeding systems among congeneric seagrass species. The data currently available indicates that intraspecific genetic diversity is not a direct consequence of reproductive systems such as dioecy, but is determined by other biological factors such as habitat availability, reproduction, recruitment, and by the local environmental conditions (Waycott and Les 1996). The Mediterranean seagrass Posidonia oceanica has slow rhizome elongation rates ( Boudouresque and Jeudy de Grissac 1983) and rare and episodic seedling formation and establishment ( Buia and Mazzella 1991; Caye and Meinesz 1984; Thelin and Boudouresque 1985). This species, like the remainder of the genus, is diploid (2n 5 20) and bisexual ( Kuo et al. 1990) and forms large dense meadows which are in some instances thought to be stable over thousands of years (den Hartog 1970). If P. oceanica grows as slowly and apparently clonally as early studies indicate, its ability to respond to direct and indirect impacts of environmental disturbance or climate change may be extremely limited, although many aquatic species display a high degree of phenotypic plasticity ( Les 1988). The almost complete genetic identity found in populations of P. oceanica (Procaccini et al. 1996; Procaccini and Mazzella 1996) could be indicative of the general decline of this species in the western Med-
iterranean basin, which is subjected to increasing anthropogenic stress ( Bellan-Santini et al. 1994). Previous analysis of the genetic structure of P. oceanica populations has been via the use of minisatellite DNA fingerprinting and RAPD-PCR that, while useful for the estimation of the genetic identity within and between populations, were not sufficiently polymorphic to assess population genetic processes. These techniques also generate dominant markers which make the assessment of gene flow and inheritance difficult. More informative data can be provided by using simple sequence repeats (SSRs) or microsatellites, as they are highly polymorphic codominant markers (Weber and May 1989). Due to the high apparent degree of clonality within this species and its apparently rare recruitment, the ability to assess gene flow and patterns of relatedness within populations is of particular interest. Simple sequence repeats (microsatellites) are highly variable genetic markers present in both coding and noncoding regions of the genome. SSRs can be analyzed as codominantly inherited loci and accurately genotyped. The SSR DNA sequences consist of tandemly repeated motifs of 6 bp or less that can vary among individuals in the number of units of the core sequence ( Tautz 1989). Variation in the number of nucleotide repeats generates a number of easily scorable bands, which are inherited in a Mendelian fashion and can be designated as alleles (Avise 1994). The potential use of these molecular markers is now well documented, particularly in animals where they have been used in genetic mapping studies in humans and mice ( Dib et al. 1996; Dietrich et al. 1992), in mating system and paternity testing in mammals, birds, fishes, and social insects (Craighead et al. 1995; Estoup et al. 1995; Kellogg et al. 1995; Morin et al. 1994; Primmer et al. 1995), and in genetic analysis of natural populations in mammals and amphibians (Paetkau et al. 1995; Paetkau and Strobeck 1994; Roy et al. 1994; Scribner et al. 1994; Taylor et al. 1995). In plants, SSRs have been reported to occur less frequently than in animals ( Lagercrantz et al. 1993). Generally, microsatellite markers in plants have been developed in commercially important species such as soybean (Akkaya et al. 1992; Morgante and Olivieri 1993), grapevine ( Thomas and Scott 1993), rice (Wu and Tanksley 1993; Yang et al. 1994), barley (Saghai Maroof et al. 1994), and Eucalyptus ( Byrne
et al. 1996) where they have been mainly used in genetic mapping or cultivar identification. Recently hypervariable microsatellite markers have been identified in the chloroplast genome (Powell et al. 1995a). In spite of the potential uses of SSRs in population genetic and breeding analysis (Queller et al. 1993; Rafalski and Tingey 1993), few published data are as yet available demonstrating their use in the genetic analysis of natural plant populations (Chase et al. 1996; Powell et al. 1995b). These reports demonstrate the potential use of this powerful technique in developing appropriate management strategies for threatened species and populations. In this study we identify microsatellite markers in the seagrass P. oceanica. The level of polymorphism and the number of alleles present at identified microsatellite regions are assessed in individuals belonging to different localities in the Mediterranean basin. In addition, two congeneric Australian species were assessed for the presence and absence of any microsatellite regions identified in P. oceanica. The aim of this study was to provide an effective tool for population genetic analysis in P. oceanica and possibly other closely related species.
Materials and Methods Plant Material and DNA Extraction Collections of P. oceanica shoots were obtained from populations along the Mediterranean coasts of Italy, Spain, and Croatia. Sampling sites were Lacco Ameno and San Pietro ( Island of Ischia, Gulf of Naples, Italy), Gorgona ( Tuscany Coasts, Italy), Pantelleria (Sicily, Italy), Medas Islands (Catalan Coasts, Spain), and Dugi Island (Croatian Coasts). Sixteen individuals were analyzed from Lacco Ameno, while only one or two individuals were considered from each of the other six populations, to verify the levels of polymorphism in any identified microsatellite regions between geographically disjunct localities. For Lacco Ameno, San Pietro, and Medas Island the same individuals collected for previous studies (Procaccini et al. 1996; Procaccini and Mazzella 1996) were analyzed. In addition, samples of the congeneric species P. sinuosa and P. australis, collected at Rottnest Island, Perth, Western Australia, were included in the analysis. Individual shoots were collected and, when possible, transported to the laboratory where epiphytes were removed from
Brief Communications 563
leaf tissues using a razor blade and DNA was extracted. Alternatively, tissue was fixed in absolute ethanol. CTAB extraction of total DNA was performed as in Procaccini et al. (1996). Genomic Library Construction and Microsatellite Screening P. oceanica genomic DNA was digested to completion with 4 units/mg of Sau 3aI restriction enzyme. Aliquots of digested DNA were dot-blotted with the Bio-Rad DOT-BLOT apparatus on Hybond-N1 membrane (Amersham) according to the manufacturer’s instructions. Dot blots were hybridized with 17 synthetic oligonucleotides (30 bases long), which were end-labeled with 20 mCi of g-32P ATP in a 10 ml reaction containing 20 pmol of oligonucleotide and 10 units of T4 polynucleotide kinase ( New England Biolabs) (30 min at 378C, 5 min at 958C) and purified through Sephadex G-25 spin columns ( NAP-5, Pharmacia). Hybridization was carried overnight at 558C in 63 SSC, 53 Denhardts, 0.05% Na pyrophosphate, 1% SDS, with 13 106 cpm/cm2 for each probe. Filters were washed at 558C in 23 SSC/0.1% SDS and 13 SSC/0.1% SDS. Four oligos giving the strongest signals [( TG)n, (AGC)n, (ACC)n, (AGG)n] were chosen for the next analysis. Sau 3aI digested DNA was separated on 2.0% agarose gel and fragments between 400 and 600 bp were excised and purified with Qiaex II Gel Extraction Kit (Qiagen). Genomic fragments were ligated into the BamHI site of pBluescript KS1 plasmid (Stratagene). Desalted ligations were transformed by electroporation (2.5 V, 25 mFD, 200 ohm) in E. coli strain. Approximately 25,000 colonies were screened by colony hybridization on Hybond-N1 nylon membrane (Amersham), using the four selected synthetic oligonucleotides mentioned above. One hundred twenty-six positive clones were picked and grown overnight in LB medium. Plasmid DNA was extracted by alkaline lysis (Sambrook et al. 1989) and rescreened as above with the four selected oligonucleotides. Only the colonies giving the strongest signals were sequenced. Thirteen clones were chosen for designing primers on the flanking regions of microsatellite sequences. Primers were designed with the aid of the program OLIGO ( National Biosciences) and synthesized on a Beckman Oligo 1000H DNA synthesizer. One additional microsatellite region has been identified in a P. oceanica DNA sequence of the trnL ( UAA) chloroplast intron (Procaccini G, unpublished data).
564 The Journal of Heredity 1998:89(6)
PCR was conducted in a total volume of 10 ml to a final concentration of 50 mM KCl, 10 mM Tris–HCl pH 9.0, 200 mM of each dNTP, 2 mM MgCl2, 1.7 pmoles of each primer, 0.5 units of Taq DNA polymerase (Perkin Elmer Cetus), 10 ng of template DNA. Amplification cycles were 35 of 15 s denaturation at 948C, followed by 30 s annealing (558C–728C), and 30 s extension at 728C. PCR products were visualized on 1.5–2% agarose gels. Characterization of Microsatellite Regions Once PCR conditions were optimized, one of the two primers was end-labeled as above in 50 ml reaction volume. Genomic DNA from individuals belonging to different P. oceanica populations and Australian P. australis and P. sinuosa was then amplified in a 10 ml reaction volume (PCR conditions as above). Samples were separated by electrophoresis in 6% acrylamide denaturing gels. Gels were dried and exposed to autoradiograph film. Band Scoring and Allele Designation Molecular weights of microsatellite bands were visually determined by comparison with a known nucleotide sequence. Different loci were identified and given putative allelic designations ( Table 1). Replicate amplifications and runs were performed in some cases to verify the stability of the products and their fragment sizes. The correct designation of bands as scorable alleles was confirmed by two experiments. First, PCR products from two individuals containing the high and low molecular weight allele of the Poc-26 clone [(GCGAGGA)4] were excised from agarose gel, purified by Gene-Clean, and sequenced with Thermo Sequenase (Stratagene); second, the PCR products obtained from Poc-45 clone [( TCC)8 ( TTC)4] were run on an acrylamide denaturing gel and then transferred on Hybond-N1 (Amersham) nylon membrane (Gerloff et al. 1995). The DNA was UV cross-linked to the membrane, hybridized at 398C overnight with 32P-labeled synthetic oligonucleotide [( TCC)8 ( TTC)4] as a probe (methods as above), and washed two times in 23 SSC, 0.1% SDS. Autoradiography was performed as an overnight exposure on Kodak X-AR films.
Results Fourteen microsatellite regions were identified in P. oceanica. Thirteen were obtained from library screening with the four
repeat-sequence oligonucleotides and one from an existing sequence of the trnL ( UAA) chloroplast intron (Procaccini G, unpublished data). The fourteen microsatellite regions include nine simple repeats (two dinucleotides, six trinucleotides, and one heptanucleotide) and five complex repeats ( Table 1). Of the four repeated sequences used to screen the P. oceanica library, only three were represented; (AGG)n was present in six clones, three clones contained the (ACC)n repeat, and two clones contained the ( TG)n repeat. Several other repeated motifs were identified in the sequenced clones: the ( TGC)n repeat was found as part of a complex pattern and as a simple repeated region, while (AT )n was found in the complex repeat of the selected chloroplast region. Where possible, 24 base long primers were designed. External primer sequences, repeated regions, and size of alleles are shown in Table 1. Correct assignment of bands as scorable alleles was determined following three different criteria: (1) for all loci by determining the molecular weight of the allelic bands in relation to a known nucleotide sequence (e.g., Figure 1). Low molecular weight bands, present as a ladder of lower intensity at the bottom of all gels, were not included in the analysis, and were interpreted as artifacts of PCR reactions; (2) for Poc-45 by hybridization of acrylamide gel with the labeled microsatellite sequence [( TCC)8 ( TTC)4] as a probe. The probe was found to hybridize to the amplification products of the expected size; (3) for Poc-26 by direct sequencing of the low and high molecular weight alleles ( Figure 2). Sequence data demonstrated that there was a 7 bp difference between the two alleles which corresponded to the insertion or deletion of one repeat unit (GCGAGGA) in the microsatellite motif. These experiments were conducted primarily because no progeny were available for testing each putative locus for inheritance. The 14 primer pairs shown in Table 1 satisfied at least one of the criteria mentioned above and gave only one main product of amplification of the expected molecular size. These regions are scorable as sequence-tagged sites and are of potential use in standard genetic analysis. Eight SSRs were monomorphic among the individuals surveyed and therefore are not informative, although a wider sample may reveal polymorphism with these markers. Six microsatellite regions were polymorphic ( Table 1). Poc-trn and Poc-5 are ho-
Table 1. Repeated microsatellite motif, oligonucleotide primer sequences, and allelic designation and size for the 14 microsatellite regions identified in P. oceanica
a
Allelic designation and size in base pairs (allele)a
Clone
Repeat sequence
Primers (59 to 39)
Poc-3
( TG)4
Poc-5
( TGG)10
Poc-12
(CA)5
Poc-15
( TGT )3 ( TGG)2 TGA ( TGC)2 ( TAC)2
Poc-23
(CCA)4
Poc-24
(GGA)5 (GAGGA)2
Poc-25
(GGT )5
Poc-26
(GCGAGGA)4
Poc-35
( TCC)11
Poc-38
(AGG)8
Poc-42
( TGC)6
Poc-45
( TCC)8 ( TTC)4
Poc-46
(GGA)7 (GGT )9
Poc-trn
( TA)5 TTA ( TA)8 TAAA ( TA)4
TCTCGAAAGAAGGACTTGCAATGC GCCAGAGCAAACAGTAGAAGGAGT TCTTCGGCTTGTGCTCGTCCTTGA GCCTCTCCTGCCCACCACCGTT TACTAAAGCAATAAACAGCAGAAT GTGTGTCATCTGCAACTGCTTGTG CTTCTTCTTGGGACGGTTGTTGTT TCAACCTCGACCTGGTCCCAAAGC GTGATTTCGTGAGATATATCTTCA GCAGCAGTGGCAAAAGGAGAGGTG GAATCACCGAAGACGGCTGGTCAC AGAATGTAACGAGTACTTAGCGAG CTGCTGCTGCTACCGCTGTTGT TCACGACCTTCACTGCATCGAT CTCGCTAAGTACTCGTTACATTCT AATTGCGAGGACAAGTCACGAGGA TGGCAAAGTCAATGGCAATAGTAG GTACGTCGTCTCGGATGGGAGA ATCCTTGTTGTCTGGCATCGAAGG CTCATTGGATGACAGTCGCTTCCC AGAGCACCGACCCCGAGCACCCA ATTCCCGTTTTCTCCGTCGATGCA AATTGCCAGATTCTGGTGTCAGAATA CTTCGCTGCCGTCACAATGAACAA GAAGTGGGATTGGTGTTGTAGTCTTC AAGCTCCTTCAATGCCTACTCCAA GGGCAATCCTGAGCCAAATCC TTGATATGTCAGTATGTATACGTACG
Poc-3.152 Poc-5.170 (A) Poc-5.173 (B) Poc-12.353 Poc-15.397 Poc-23.276 Poc-24.174 Poc-25.160 Poc-26.282 (A) Poc-26.275 ( B) Poc-35.200 (A) Poc-35.194 ( B) Poc-38.176 Poc-42.176 (A) Poc-42.170 ( B) Poc-45.168 (A) Poc-45.144 ( B) Poc-46.112 Poc-trn.409 (A) Poc-trn.395 (B) Poc-trn.381 (C)
All the scored alleles are shown for polymorphic loci. In the polymorphic loci, alleles of the expected molecular size are indicated in bold type.
mozygous and monomorphic in the Lacco Ameno population ( Table 2) and are present with private alleles in the Croatian (Poc-trn and Poc-5) and in the Spanish (Poc-trn) individuals ( Figures 1 and 3). Poc-26 is heterozygous and polymorphic only among the individuals collected along the coast of the Island of Ischia ( LA and SP; Figure 2). The allele Poc-26.275, in fact, was present only in this geographical locality. A total of 13 alleles have been identified among the six scorable microsatellite regions in the populations surveyed. Genotype frequencies were calculated for all genotypes found in the Lacco Ameno population among the six polymorphic loci observed ( Table 2). A direct comparison of genotypes detected using microsatellites and RAPDs was conducted using data from Procaccini et al. (1996) ( Table 3). This identifies eight genotypes among the samples analyzed with microsatellites and two genotypes when assessed using RAPDs. Ten of the 14 P. oceanica microsatellite regions were found to occur also in two Australian species of the genus, P. australis and P. sinuosa. Different alleles were pres-
ent among the three species in some cases ( Figures 1 and 3).
Discussion Microsatellite markers identified in this study detect significantly higher levels of within population genetic variation than any technique previously applied to this seagrass species. Previous studies observed very low levels of genetic variation within samples assessed from a population of P. oceanica from Lacco Ameno, Ischia (Procaccini et al. 1996; Procaccini
and Mazzella 1996). In fact, among the samples assessed side by side with the microsatellite regions in this study, only two genotypes were observed using RAPDs ( Table 3), a technique generally accepted as being highly sensitive for the detection of genetic variability (Peakall et al. 1996). The microsatellites detect eight genotypes among the same samples, a fourfold increase in sensitivity among this limited set of samples. The presence of eight genotypes within a meadow of P. oceanica is significant since previously this species was thought to form largely uniclonal
Figure 1. Microsatellite region Poc-5 variation among individuals from three populations of P. oceanica and from two individuals of P. sinuosa (Ps) and P. australis (Pa). LA 5 Lacco Ameno ( Island of Ischia, Italy), CR 5 Dugi Island (Croatian), ME 5 Medas Islands (Spain). All the individuals are homozygous. Different alleles are present in the Croatian population of P. oceanica and in the two congeneric Australian species. A marker nucleotide sequence is shown (ACGT ), to determine the size of different alleles. The molecular size of the two P. oceanica alleles is indicated.
Brief Communications 565
Figure 2. Microsatellite region Poc-26 amplified from individuals belonging to six populations of P. oceanica. LA 5 Lacco Ameno ( Island of Ischia, Italy), CR 5 Dugi Island (Croatian), ME 5 Medas Islands (Spain), SP 5 S. Pietro ( Island of Ischia, Italy), PA 5 Pantelleria (Sicily, Italy), GO 5 Gorgona ( Tuscany Coast, Italy). The alleles from the second and the sixth individuals of LA (275 bp and 282 bp, respectively) were sequenced.
meadows which were probably largely relictual. However, these results do indicate that there are still a low number of clones per population and provide a technique for assessing the extent of individual clones within populations. The observation of different alleles among the shoots sampled from different localities indicates that they will be successful in defining any structuring or gene flow which may be operating in the Mediterranean Sea. Posidonia oceanica is considerably more genotypically depauperate than the Australian P. australis (Waycott 1995; Waycott et al. 1997). The discrepancy in population genetic variability between species may reflect the relative selective pressures on the two species despite similarities in their growth forms and habitat preferences. The longer period of human impact in the northern Mediterranean and the glaciation events in the region are significant environmental differences between the two species. However, the result that P. oceanica, in contrast to P. australis, has low levels of genetic diversity is further support for the idea that there is no cor-
relation between floral structure and genetic diversity in seagrasses (Waycott and Les 1996). A number of studies have found very low levels of genetic diversity (even uniformity) in plants using more traditional methods such as allozymes (Crawford et al. 1994; Huber and Leuchtmann 1992; Mashburn et al. 1978; Waycott et al. 1996; Wolff and Jeffries 1987). These observations of allozymic uniformity have also been corroborated by studies with DNA fingerprinting techniques showing high levels of clonality in some populations of seagrasses (Procaccini et al. 1996; Procaccini and Mazzella 1996; Waycott et al. 1996). The finer-scale observations on the level of genotypic variability within the apparently almost uniform population of P. oceanica in Lacco Ameno demonstrates a conservatism which needs addressing. There are only two alleles per putative locus present in this population at all the polymorphic microsatellite regions detected ( Table 2). The low level of allelic diversity, despite the usually high level of polymorphism observed with this technique
(Chase et al. 1996; Weber and May 1989), is indicative of the clonal and relictual nature of this species in the western Mediterranean. It may be that the few genotypes observed within the population are residual from a considerably larger population of genets or that there was a restricted founding event in this population and subsequent low levels of recruitment from within the population resulting in the present-day population structure. For this reason, a much wider survey in nearby localities would be of considerable interest, in addition to the testing of progeny inheritance of the markers. Unfortunately the extremely low levels of flowering and lower levels of seed set in P. oceanica make the latter problematic and dependent upon the fortuitous collection of material, which we have been unable to do at this stage. The presence of microsatellite markers from P. oceanica in the two congeneric species P. australis and P. sinuosa suggests that there is a high level of sequence conservation across the genus. The application of these markers in Australian Posidonia species will allow new insights into the relationships between taxa of this interesting group of angiosperms, as has been demonstrated by Schlo¨tterer et al. (1991) for cetaceans and in other plant species ( Byrne et al. 1996). Forbes et al. (1995) point out that species from which microsatellites have been selected by library screening (sheep, Forbes et al. 1995; primates, Bowcock et al. 1994) show greater range in microsatellite amplification size when compared with related taxa. We found that the size of microsatellite repeated regions in P. australis and P. sinuosa was approximately the same as P. oceanica, although we have yet to sequence
Table 2. Genotypes frequencies of the six polymorphic microsatellite regions in the P. oceanica population of Lacco Ameno (Island of Ischia, Italy)
Locus
Number of individuals
Poc-5 Poc-26
16 16
Poc-35
16
Poc-42
16
Poc-45
16
Poc-trn
16
Alleles
Frequency
AA AA BB AB AA AB AA BB AB AA AB BB
1.00 0.50 0.06 0.44 0.94 0.06 0.44 0.06 0.50 0.56 0.44 1.00
566 The Journal of Heredity 1998:89(6)
Figure 3. Microsatellite region Poc-trn amplified from individuals in three populations of P. oceanica and from two individuals of P. sinuosa (Ps) and P. australis (Pa). All the individuals from the populations located in the Island of Ischia ( LA and SP) and one of the individuals from Spain (ME) are homozygous for the same allele. Note that the Australian samples show substantially smaller fragment sizes.
Table 3. Presence/absence of alleles in the population of Posidonia oceanica from Lacco Ameno, Island of Ischia, Italy
Sample LA1 LA4 LA8 LA2 LA3 LA7 LA5 LA6 LA10 LA11 LA12 LA13 LA14 LA9 LA15 LA16
1
2
3
4
5
6
7
8
9
10
11
12
13
A
B
1 1 1 1 1 1 1 1 1 1 1 1 1 1 1 1
0 0 0 0 0 0 0 0 0 0 0 0 0 0 0 0
1 1 1 0 1 1 1 1 1 1 1 1 1 1 1 1
1 1 1 1 1 1 1 1 0 0 0 0 0 0 0 0
1 1 1 1 1 1 1 1 1 1 1 1 1 1 1 1
0 0 0 0 0 0 0 0 0 0 0 1 0 0 0 0
1 1 1 1 1 1 1 1 1 1 1 0 1 1 1 1
0 0 0 0 1 1 1 1 1 1 1 1 1 0 0 0
1 1 1 1 1 1 1 1 1 1 1 1 1 1 1 1
0 0 0 0 0 0 1 1 0 0 0 1 1 1 1 1
0 0 0 0 0 0 0 0 0 0 0 0 0 0 0 0
1 1 1 1 1 1 1 1 1 1 1 1 1 1 1 1
0 0 0 0 0 0 0 0 0 0 0 0 0 0 0 0
1 1 1 2 3 3 4 4 5 5 5 6 7 8 8 8
1 1 1 1 1 1 1 1 1 1 1 1 2 1 1 1
1 5 Poc-5.173, 2 5 Poc-5.170, 3 5 Poc-26.282, 4 5 Poc-26.275, 5 5 Poc-35.200, 6 5 Poc-35.194, 7 5 Poc-42.176, 8 5 Poc-42.170, 9 5 Poc-45.168, 10 5 Poc-45.144, 11 5 Poc-trn.409, 12 5 Poc-trn.395, 13 5 Poc-trn.381, A 5 genotype number for microsatellite regions, B 5 genotype number from RAPD data [data from Procaccini et al. (1996) for the same DNA samples]. Microsatellite region designations from Table 1.
microsatellite loci in the genus Eucalyptus. Aust J Bot 44:331–341. Caye G and Meinesz A, 1984. Observations sur la floraison et la fructification de Posidonia oceanica dans la Baie de Villefranche et en Corse du Sud. In: International Workshop on Posidonia oceanica Beds ( Boudouresque C-F, Jeudy de Grissac A, Olivier J, eds). Marseille: GIS Posidonie, 1:193–201. Chase M, Kesseli R, and Bawa K, 1996. Microsatellite markers for populations and conservation genetics of tropical trees. Am J Bot 83:51–57. Cox PA, 1993. Water pollinated plants. Sci Am 269:68– 74. Cox PA and Knox RB, 1988. Pollination postulates and two-dimensional pollination in hydrophilous Monocotyledons. Ann Missouri Bot Garden 75:811–818. Craighead L, Paetkau D, Reynolds HV, Vyse ER, and Strobeck C, 1995. Microsatellite analysis of paternity and reproduction in Arctic grizzly bears. J Hered 86: 255–261. Crawford DJ, Stuessy TF, Cosner MB, Haines DW, Wiens D, and Penaillo P, 1994. Lactoris fernandeziana ( Lactoridaceae) on the Juan-Fernandez-Islands: allozyme uniformity and field observations. Conserv Biol 8:277–280. den Hartog C. 1970. The sea-grasses of the world. Amsterdam: North-Holland.
these regions to determine their homology with P. oceanica sequences. More extensive surveys of different species are also required to determine the level and the mode of conservation of microsatellite loci across this genus, which is of wider interest to the understanding of the nature of this relatively new class of population genetic markers. The microsatellite markers identified here have immediate implications to the conservation of P. oceanica as they identify a greater level of population genetic variability, indicating a larger number of individuals within the main population studied. Future assessment of fine-scale population level recruitment and gene flow in P. oceanica within and between regions of the Mediterranean is now possible through the wider application of these markers. This seagrass species is an important marine biological resource which may be under considerable pressure in a highly perturbed environment where it grows throughout much of the northern Mediterranean. Genetic variability detected at individual, population, and species levels highlight that the application of microsatellite analysis to genetic studies of highly clonal and/or genetically uniform plants could significantly improve our understanding of these organisms which have been viewed as lacking genotypic diversity. It will allow us to unravel problems of population genetic analysis in this highly clonal organism. From the Laboratorio di Ecologia del Benthos, Stazione Zoologica ‘A. Dohrn’, 80077 Ischia, Naples, Italy (Procaccini), and the Department of Botany, University of Western Australia, Nedlands, Australia (Waycott). M. Waycott is currently at the Department of Tropical En-
vironment Studies and Geography, James Cook University, Townsville, Australia. The authors thank M. C. Gambi and L. Piazzi for help in collecting plant material, E. Biffali and the Molecular Biology Service of the Zoological Station of Naples for technical assistance, D. Marino for helpful comments and logistic assistance, and L. Mazzella for the comments on the manuscript and continuous support during this research. This article represents a component of the PhD research by G.P., supported by the Zoological Station ‘A. Dohrn’ of Naples, Italy, and directed by Prof. F. Cinelli, of the Department of Environmental Sciences at the University of Pisa, Italy, and by L. Mazzella of the Zoological Station ‘A. Dohrn’ of Naples. M.W. was supported by an ARC Small Grant to D. I. Walker and S. H. James. Address correspondence to G. Procaccini at the address above or e-mail:
[email protected]. q 1998 The American Genetic Association
References Akkaya MS, Bhagwat AA, and Cregan PB, 1992. Length polymorphisms of simple sequence repeat DNA in soybean. Genetics 132:1131–1139. Alberte RS, Suba GK, Procaccini G, Zimmerman RC, and Fain SR, 1994. Assessment of genetic diversity of seagrass populations using DNA fingerprinting: implications for population stability and management. Proc Natl Acad Sci USA 91:1049–1053. Avise JC, 1994. Molecular markers, natural history and evolution. New York: Chapman & Hall. Bellan-Santini D, Lacaze JC, and Poizet C, 1994. Les bioce´noses marines et littorales de Me´diterrane´e, synthe`se, menaces et perspectives. Paris: Muse´e National d’ Histoire Naturelle. Boudouresque J-F and Jeudy de Grissac A, 1983. L’ herbier a` Posidonia oceanica en Me´diterrane´e: les interactions entre la plante et la se´diment. J Rech Oce´anogr 8:99–122. Bowcock AM, Ruizlinares A, Tomfohrde J, Minch E, Kidd JR, and Cavalli-Sforza LL, 1994. High resolution of human evolutionary trees with polymorphic microsatellites. Nature 368:455–457. Buia MC and Mazzella L, 1991. Reproductive phenology of the Mediterranean seagrasses Posidonia oceanica ( L.) Delile, Cymodocea nodosa ( Ucria) Aschers., and Zostera noltii Hornem. Aquat Bot 40:343–362. Byrne M, Marquez-Garcia MI, Uren T, Smith DS, and Moran GF, 1996. Conservation and genetic diversity of
Dib C, Faure´ S, Fizames C, Samson D, Drouot N, Vignal A, Millasseau P, Marc S, Hazan J, Seboun E, Lathrop M, Gyapay G, Morissette G, and Weissenbach J, 1996. A comprehensive genetic map of the human genome based on 5264 microsatellites. Nature 380:152–154. Dietrich W, Katz H, Lincoln SE, ShinH-S, Friedman J, Dracopoli NC, and Lander ES, 1992. A genetic map of the mouse suitable for typing intraspecific crosses. Genetics 131:423–447. Estoup A, Scholl A, Pouvreau A, and Solignac M, 1995. Monoandry and polyandry in bumble bees ( Hymenoptera; Bombinae) as evidenced by highly variable microsatellites. Mol Ecol 4:89–93. Forbes SH, Hogg JT, Buchanan FC, Crawford AM, and Allendorf FW, 1995. Microsatellite evolution in congeneric mammals: domestic and bighorn sheep. Mol Biol Evol 12:1106–1113. Gerloff U, Schlo¨tterer C, Rassmann K, Rambold I, Hohmann G, Fruth B, and Tautz D, 1995. Amplification of hypervariable simple sequence repeats (microsatellites) from excremental DNA of wild living bonobos (Pan paniscus). Mol Ecol 4:515–518. Huber W and Leuchtmann A, 1992. Genetic differentiation of the Erigeron species (Asteraceae) in the Alps: a case study of unusual allozymic uniformity. Plant Syst Evol 183:1–16. Kellogg KA, Jeffrey AM, Stauffer JR Jr, and Kocher TD, 1995. Microsatellite variation demonstrates multiple paternity in lekking cichlid fishes from Lake Malawi, Africa. Proc R Soc Lond B 260:79–84. Kuo J, James SH, Kirkman H, and Den Hartog C, 1990. Chromosome numbers and their systematic implications in Australian marine angiosperms: the Posidoniaceae. Plant Syst Evol 171:199–204. Lagercrantz U, Ellegren H and Andersson L, 1993. The abundance of various polymorphic microsatellite motifs differs between plants and vertebrates. Nucleic Acids Res 21:1111–1115. Les DH, 1988. Breeding systems, population structure and evolution in hydrophylous angiosperms. Ann Missouri Bot Garden 75:819–835. Mashburn SJ, Sharits RR, and Smith MH, 1978. Genetic variation among Typha populations of the south eastern United States. Evolution 32:681–685. Morgante M and Oliveri AM, 1993. PCR amplified microsatellites as markers in plant genetics. Plant J 3:175– 182. Morin PA, Wallis J, Moore JJ, and Woodruff DS, 1994. Paternity exclusion in a community of wild chimpan-
Brief Communications 567
zees using hypervariable simple sequence repeats. Mol Ecol 3:469–478. Paetkau D, Calvert W, Stirling I, and Strobeck C, 1995. Microsatellite analysis of population structure in Canadian polar bears. Mol Ecol 4:347–354. Paetkau D and Strobeck C, 1994. Microsatellite analysis of genetic variation in black bear populations. Mol Ecol 3:489–495. Peakall R, Smouse PE, and Huff DR, 1995. Evolutionary implications of allozyme and RAPD variation in diploid populations of dioecious buffalograss Buchloe¨ dactyloides. Mol Ecol 4:135–147. Pettit J, Ducker S, and Knox B, 1981. Submarine pollination. Sci Am 244:92–100. Powell W, Morgante M, Andre C, McNicol JW, Machray GC, Doyle JJ, Tingey SV, and Rafalski JA, 1995a. Hypervariable microsatellites provide a general source of polymorphic DNA markers for the chloroplast genome. Curr Biol 5:1023–1029. Powell W, Morgante M, McDevitt R, Vendramin GG, and Rafalski JA, 1995b. Polymorphic simple sequence repeat regions in chloroplast genome. Applications to the populations genetics of pines. Proc Natl Acad Sci USA 92:7759–7763. Primmer CR, Moller AP, and Ellegren H, 1995. Resolving genetic relationships with microsatellite markers: a parentage testing system for the swallow Hirundo rustica. Mol Ecol 4:493–498. Procaccini G, Alberte RS, and Mazzella L, 1996. Genetic structure of the Seagrass Posidonia oceanica ( L.) Delile in the western Mediterranean: ecological implications. Mar Ecol Progr Ser 140:153–160. Procaccini G and Mazzella L, 1996. Genetic variability and reproduction in two Mediterranean seagrasses. In: Seagrass biology: proceedings of an international workshop, Rottnest Island, Western Australia, January 25– 29, 1996; 85–92. Queller DC, Strassman JE, and Hughes CR, 1993. Microsatellites and kinship. Trends Ecol Evol 8:285–288.
568 The Journal of Heredity 1998:89(6)
Rafalski JA and Tingey SV, 1993. Genetic diagnostics in plant breeding: RAPDs, microsatellites and machines. Trends Genet 9:275–280.
in grapevine reveal DNA polymorphisms when analyzed as sequence-tagged sites (STSs). Theor Appl Genet 86:985–990.
Richards AJ 1986. Plant breeding systems. London: Allen & Unwin.
Waycott M, 1995. Assessment of genetic variation and clonality in the seagrass Posidonia australis using RAPD and allozyme analysis. Mar Ecol Prog Ser 116:289–295.
Roy MS, Geffen E, Smith D, Ostrander EA, and Wayne RK, 1994. Patterns of differentiation and hybridization in North American wolflike canids, revealed by analysis of microsatellite loci. Mol Biol Evol 11:553–570.
Waycott M and Sampson J, 1997. The mating system of an hydrophilous angiosperm, Posidonia australis. Am J Bot 84:621–625.
Ruckelshaus MH, 1995. Estimates of outcrossing rates and of inbreeding depression in a population of the marine angiosperm Zostera marina. Mar Biol 123:583–593.
Waycott M, James SH, and Walker DI, in press. Genetic variation within and between populations of Posidonia australis, a hydrophilous, clonal seagrass. Heredity.
Saghai Maroof MA, Biyashev RM, Yang GP, Zhang Q, and Allard RW, 1994. Extraordinarily polymorphic microsatellite DNA in barley: species diversity, chromosomal location, and population dynamics. Proc Natl Acad Sci USA 91:5466–5470.
Waycott M and Les DH, 1996. An integrated approach to the evolutionary study of seagrasses. In: Seagrass biology: proceedings of an international workshop, Rottnest Island, Western Australia, January 25–29, 1996; 71–78.
Sambrook J, Fritsch EF, and Maniatis T, 1989. Molecular cloning: a laboratory manual, 2nd ed. Cold Spring Harbor, New York: Cold Spring Harbor Laboratory Press. Schlo¨tterer C, Amos B, and Tautz D, 1991. Conservation of polymorphic simple sequence loci in cetacean species. Nature 354:63–65. Scribner KT, Arntzen JW, and Burke T, 1994. Comparative analysis of intra- and interpopulation genetic diversity in Bufo bufo, using allozyme, single-locus microsatellite, minisatellite, and multilocus minisatellite data. Mol Biol Evol 11:737–748. Tautz D, 1989. Hypervariability of simple sequences as a general source of polymorphic DNA markers. Nucleic Acids Res 17:6463–6471. Taylor AC, Sherwin WB, and Wayne RK, 1995. Genetic variation of microsatellite loci in a bottlenecked species: the northern hairy-nosed wombat Lasiorhinus krefftii. Mol Ecol 3:277–290. Thelin I and Boudouresque J-F,1985. Posidonia oceanica flowering and fruiting: recent data from an international inquiry. Posidonia Newsl 1:5–14. Thomas MA and Scott NS, 1993. Microsatellite repeats
Waycott M, Walker DI, and James SH, 1996. Genetic uniformity in Amphibolis antartica, a dioecious seagrass. Heredity 76:578–585. Weber JL and May PE, 1989. Abundant class of human DNA polymorphisms which can be typed using the polymerase chain reaction. Am J Hum Genet 44:388– 396. Wolff SL and Jeffries RL, 1987. Morphological and isozyme variation in Salicornia europaea (s.l.) (Chenopodiaceae) in northeastern North America. Can J Bot 65: 1410–1419. Wu KS and Tanksley SD, 1993. Abundance, polymorphism and genetic mapping of microsatellites in rice. Mol Gen Genet 241:225–235. Yang GP, Shagai Maroof MA, Xu Qifa Zhang CG, and Biyashev RM, 1994. Comparative analysis of microsatellite DNA polymorphism in landtraces and cultivars of rice. Mol Gen Genet 245:187–194. Received November 22, 1996 Accepted February 18, 1998 Corresponding Editor: Norman F. Weeden