V. Radojičić, G. Marković, M. Janković, B. Drašković: Broadband Traffic Forecasting in the Transport Network
VALENTINA RADOJIČIĆ, Ph.D. E-mail:
[email protected] GORAN MARKOVIĆ, Ph.D. E-mail:
[email protected] University of Belgrade, Faculty of Transport and Traffic Engineering Vojvode Stepe 305, 11000 Belgrade, Serbia MILAN JANKOVIĆ, Ph.D. E-mail:
[email protected] Republic Agency for Electronic Communications Višnjićeva 8, 11000 Belgrade, Serbia BORKO DRAŠKOVIĆ, M.Sc. E-mail:
[email protected] Telekom Srbija, a.d. Takovska 2, 11000 Belgrade, Serbia
Information and Communication Technology Original Scientific Paper Accepted: Feb. 28, 2011 Approved: July 5, 2012
BROADBAND TRAFFIC FORECASTING IN THE TRANSPORT NETWORK
ABSTRACT This paper proposes a modification of traffic forecast model generated by residential and small business (SOHO, Small Office Home Office) users. The model includes forecasted values of different relevant factors and competition on broadband market. It allows forecasting the number of users for various broadband technologies and interaction impact of long-standing technologies as well as the impact of the new technology entrant on the market. All the necessary parameters are evaluated for the Serbian broadband market. The long-term forecasted results of broadband traffic are given. The analyses and evaluations performed are important inputs for the transport network resources planning.
KEY WORDS broadband technologies, competitive forecasting method, market, network, traffic
1. INTRODUCTION Broadband access has rapid growth in terms of the number of users serviced, the bit rates delivered, and the ability to support a larger set of services and applications. In the delivery of broadband multimedia services to end-users, it is necessary to build a highspeed backbone and access network. More people are using the Internet for multimedia and interactive applications such as entertainment video, interactive/ multiplayer gaming, and video chat.
Long-term broadband demand forecasts have been and are crucial for investment decisions, rollouts and dimensioning of transport networks. Transport networks provide local, regional or international connections for different types of services (voice, data and video) and applications [1]. Typically, these networks serve a great number of users (residential and business) and carry enormously large volume of traffic. A variety of technologies may be implemented in these networks, such as Digital Subscriber Line (DSL), cable networks, passive optical networks (PONs), optical Ethernet fibre to the premises (FTTP), and wireless broadband access such as Worldwide Interoperability for Microwave Access (WiMAX) or Long Term Evolution (LTE) in the last mile. The landscape of broadband technologies has grown more capable and complex with the addition of these exciting alternatives. The decision-makers and technologists alike are faced with choices on access technologies and network architectures that have long-term implications. However, even if a technology is proven to be optimal for the current environment, it can deteriorate by the elapse of time or the advent of new challenging technologies in the future [2]. Mostly, an incumbent operator exploits transport capacities to offer telecommunication service/products to the residential and business market. In addition, incumbent operator can lease transport capacities to wholesale market for other operators. The empirical data show a rise in residential access data rates. In 2009 more than 271 million people used these net-
Promet – Traffic&Transportation, Vol. 24, 2012, No. 4, 275-284
275
V. Radojičić, G. Marković, M. Janković, B. Drašković: Broadband Traffic Forecasting in the Transport Network
works worldwide [3], and this number is expected to rise to 636 million by 2014. In Germany alone, more than 66% of all Internet users connect to the Internet via residential broadband networks. The percentage is similar in other western countries like the USA [4, 5]. This trend is mainly followed by increased demands for new broadband services that may be offered to end users over different access technologies, such as cable TV distribution systems, digital subscriber lines (DSL), fibre optic network connections (FTTx – Fiber To The “x”, where x stands for the home, curb, cabinet, business or building) and wireless (fixed or mobile) broadband access. FTTx as a new broadband technology has been selected for a number of fiber-to-thehome deployments, now widely available in Korea, Japan, USA and some European countries, for example in Sweden and the Netherlands [6, 7]. In addition, the intention of the European Union recommendation is to induce heavier fibre competition in the access networks. Investment in broadband communications and its infrastructures is receiving extraordinary attention from the policy-makers all over the world, due to the significant impact of high-speed Internet access on the whole economy and society [8]. The total broadband market includes current and potential subscribers. The determination of the market potential involves studying of the overall population size. In general, there are two basic user categories: residential and business. Business users may be classified into several categories according to the number of required lines or bit rates [9]. As the SOHO (Small Office Home Office) represents the single line business users, there is possibility to gather them with the residential users. In the residential market segment, it is better to include the number of households as a variable rather than the total population size, but if it is done so far it is necessary to estimate the number of households as the second variable [10]. The residential users may be classified over different categories by age, gender, occupation, dwelling place, incomes, etc. Note that individual household members typically have different needs for using some services. With the aim of adequately planning the required transport network resources, it is necessary to forecast traffic demands that are in direct correlation to the forecasted number of users. In this article, we propose a new model for overall broadband traffic forecasting in transport networks generated by the residential and SOHO users. The proposed model is based on the forecasted values of relevant influence factors: cumulative function of the number of users, broadband penetration, busy hour concentration factor, packet switching concentration factor, utilization capacity factor, mean access capacity and market potential. Forecasting the number of users was performed by competition diffusion model which takes into account the relationship between 276
the longstanding broadband technologies as well as the impact of late technology entrant on the market. The diffusion speeds of different technologies are expressed through the estimated parameters of innovators and imitators. The main goal of the proposed model is to take into consideration the competition between the existing and new broadband technologies. In this sense, we proposed here two possible scenarios for the Serbian broadband market development. The paper is organized as follows. In the second section the diffusion/adoption process is described. The third section explains the competitive diffusion model that we used to forecast the future broadband demands. This model includes the impact a novel technology has on the diffusion process of the broadband market. In the fourth section, we proposed a new model for broadband traffic estimation. In section five the proposed model is applied in a case of the Serbian broadband market that is characterized by three long-standing technologies: ADSL (Asymmetric Digital Subscriber Line), HFC (Hybrid Fiber-Coax), FWB (Fixed Wireless Broadband), which has to be outpaced by a new broadband technology, FTTC/FTTH (Fiber to the Curb/Fiber to the Home). Finally, we conclude the article, giving managerial implications and directions for further research.
2. DIFFUSION/ADOPTION PROCESS In marketing, the diffusion models have been used traditionally for capturing the lifecycle dynamics of a new service, for forecasting the demand for a new service, and as a decision aid in making pre-launch, launch and post-launch strategic choices. Since their entrance into marketing, the diffusion models have become increasingly complex. This complexity has been driven by the need to enhance the forecasting capability of these models and to improve their usefulness as a decision-making tool for managers [11]. Traditionally, the deployment of new telecommunication services/technology has taken years of efforts and large amounts of investment. Thus, being able to predict the market acceptance before taking the business risk is critically important [12]. There is an extensive amount of research in marketing of the development and applications of new service/technology adoption models. Numerous studies in a variety of disciplines suggest that a cumulative sale of new services/technology against time is an S-shaped curve [13-17 ]. The FisherPry and Gompertz models are usually applied for modelling the technology substitution or adoption [18]. According to the diffusion theory, a new service sales growth at any time depends largely on the strength of the word of mouth from its previous adopters. Similarly, a service sales growth should then depend on the extent to which it receives good word of mouth from its Promet – Traffic&Transportation, Vol. 24, 2012, No. 4, 275-284
V. Radojičić, G. Marković, M. Janković, B. Drašković: Broadband Traffic Forecasting in the Transport Network
Potential adopters
Adoption rate
+
Adopters
+ Marketing efforts
+
Word of mouth
Innovation effect
+
Imitation effect
+
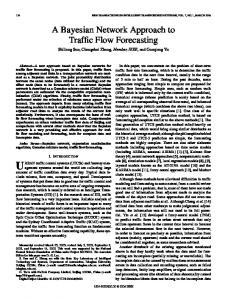
Figure 1 - Bass diffusion/adoption process [ 20]
own previous adopters. An edited volume by Mahajan, Muller, and Wind [14] covers in depth various topics in diffusion models, such as estimation and applications. The most important model in this stream of research is the Bass model [19]. The Bass diffusion model has been widely used as forecasting procedure of new services/technologies and it was proposed to deal with the problem of initial adopters. Mahajan, Muller, and Bass (1990) provide an excellent overview of the Bass model, its extensions, and some directions for further research. Figure 1 illustrates the Bass diffusion/adoption process. This modelling approach assumes that potential adopters become aware of an innovation by means of external events, for instance, marketing efforts. Bass introduced the idea of dividing the innovation adoption rate into two factors, one endogenous, usually called “imitation effect”, and the other exogenous, and commonly referred to as the “innovation effect”. The innovation effect has direct influence on the adoption rate. The potential adopters become adopters at adoption rate that depends on the marketing efforts and the word-of-mouth promotion. For the word-of-mouth adoption it is assumed that everybody contacts everybody else in a population group.
The mathematical structure of the Bass model is derived from a hazard function corresponding to the conditional probability that an adoption will occur at time t given that it has not occurred yet. This model has three key parameters: coefficient of innovation or external influence (p), coefficient of imitation or internal influence (q) and market potential (m). If f^ t h is the density function of time to adoption and F^ t h is the cumulative fraction of adopters at t, the basic hazard function underlying the Bass model is (Bass, 1969): f^ t h (1) = p + q $ F^ t h 1 - F^ t h Parameter q reflects the influence of those consumers who have already adopted the technology (i.e. word-of-mouth communication from previous adopters), while p captures the influence that is independent from the number of adopters (i.e. external communication). The sales in period 6t, t + Dt @ is S^ t h = m 6F^ t h - F^t - 1h@ , where Dt = 1 (e.g. month, quarter or year) and m refers to the market potential for the new technology. Three service characteristics (marketing, quality, and price) influence the consumer’s valuation of the
Service provider
Influence Marketing
Quality
Price
Understanding
Utility
Acceptability
Decision factor
Adoption
Market potential
Figure 2 - Adoption of new telecommunication services [ 20]
Promet – Traffic&Transportation, Vol. 24, 2012, No. 4, 275-284
277
V. Radojičić, G. Marković, M. Janković, B. Drašković: Broadband Traffic Forecasting in the Transport Network
service and these in turn lead to adoption. Figure 2 represents the basic user choice model, which is used to examine the competition between services. Understanding of a new service may be affected by changing the actions of marketing. On the other hand, the understanding of the service, greatly affects the users who had already accepted a new service. Service utilization is a factor that should include the actual need of the users for the service, the importance of their work or daily life, the benefits that can be achieved by new service, etc. The utility can be affected by changing the quality and marketing functions controlled by the service provider, and depending on the factors of the final acceptance of services. The acceptability of the service is affected by price and quality, which also controls the service provider. For understanding of how service usage changes over time, and particularly how the consumer’s view of the fairness or “equity” of the exchange over time affects the consumer’s usage of services, see [21]. In addition to these, there are a number of external influences such as culture, changes in price and quality equipment, competitiveness on the market, and so on.
3. COMPETITIVE DIFFUSION MODEL In a rapidly changing market, businesses need to supplement traditional forecasting models with dynamic models that explicitly include factors influencing changes in demand and enable managers to explore the impact on demand of different business options [22]. A principal distinction between substitution and diffusion models is that models of technological substitution assume there is a market there to be substituted, and, many times, the size of that market is known, whereas diffusion models make no such assumptions in general. In fact, it is often the case that one of the principal reasons a diffusion model might be of interest in the first place is its ability to estimate or forecast a market potential [23]. The competitive diffusion model is proposed in [15], based on the basic Bass model [ 19] as follows: 1 - e-^p + qh $ t + q 1 + $ e-^p + qh $ t p q 1+ p p p q + $ ` i - i j $ ln q -^p + qh $ t q p q 1+ $e p Fi ^ t h =
qi $ q
(2)
where: Fi ^ t h is the cumulative sales of technology i ( i = 1, 2, f) as a function of time; pi and qi are the coefficients of innovation and imitation of technology i, respectively; p and q are the total coefficients of innovation and imitation on technology level, respectively; If m denotes the market potential, it can be shown that the market potential of technology i is: 278
mi = m $ lim Fi ^ t h = m $ t"3
qi $ q
p p q q $ $1 + ` i $ - 1j $ ln `1 + j. p q q qi
(3)
and the peak sales time of technology i, 2qi p + q^qi - pih (4) ti* = 1 $ ln c m p+q p^qi + pih Suppose that several technologies are present on the market from the time of introduction of the broadband technologies; that is t = 0 . Suppose at time tn , new technology enters the market, where tn > 0 . One of three things can be expected to happen to the market at the broadband technology level. The adoption of service will expand (i.e., m will become larger), the technology will start diffusing faster (i.e., q will be higher), or both market expansion and faster diffusion will happen simultaneously. At the technology level, the existing technologies may get affected in their diffusion speed either positively or negatively, and the exact effect depends on parameters m, p, pi , q and qi [ 15]. Generally, it is possible that the new entry affects both the market potential and the diffusion speed of the service. A new entrant in a market changes the market dynamics not only by its entry but also by the marketing actions and reactions that follow the entry. These actions include price cutting, more advertising and promotional efforts, wider distribution, and so forth, which cause the changes observed in the diffusion dynamics. Equations 5 and 6 describe the cumulative sales growth of the total broadband market and of technology i, respectively, after the new technology entry [15]: Q k ;1 + FnE - ^k - Fnh e-^p + kQh^t - tnh p (5) F^ t h = Q Q c1 + Fnm - ^k - Fnh e-^p + kQh^t - tnh p p Fi ^ t h = Fin + Qi ^ p + qFnh p + kQ - 1E ; 2 Q p + QFn + Q^k - Fnh e-^p + kQh^t - tnh Qp-pQ p + kQ - i 2 i ln ; (6) E Q p + QFn + Q^k - Fnh e^p + kQh^t - tnh +
where: F^tnh = Fn and Fi ^tnh = Fin ; Q represents the total factor of imitation for technology level; Qi represents the factor of imitation for technology i; k is the estimated value that tells us what percentage of the market has expanded or contracted because of the new technology entry. The cumulative sales function for new technology, Fnew ^ t h , after tn , is given by: Fnew ^ t h = Qnew ^ p + qFnh p + kQ - 1E ; Q2 p + QFn + Q^k - Fnh e-^p + kQh^t - tnh Q p p + kQ - new2 $ ln ; (7) E Q p + QFn + Q^k - Fnh e^p + kQh^t - tnh =
Promet – Traffic&Transportation, Vol. 24, 2012, No. 4, 275-284
V. Radojičić, G. Marković, M. Janković, B. Drašković: Broadband Traffic Forecasting in the Transport Network
The proposed model can be used for several purposes. For example, by applying these equations to an empirical data set and by comparing the estimates of equivalent parameters before and after the new technology entry, we can infer the changes in the speed of diffusion of the broadband market and of each technology.
4. MODEL FOR BROADBAND TRAFFIC FORECASTING Traditionally, the residential market generates different types of traffic: voice traffic, dial-up Internet traffic, ADSL traffic, etc. The voice traffic has nearly reached saturation. During the next years, the line switched voice traffic will be rather stable before parts of the line switched voice traffic are substituted by IP voice. Competition has already started between broadband technologies to capture parts of the broadband market. We propose here a modification of traffic forecast model for the transport network by Kjell Stordahl [1] , TR ^ t h , generating by residential and SOHO users in busy hours: TR ^ t h = m
I
/ Ci ^ t h $ Ai ^ t h $ bi $ ui $ HPi ^ t h $ Fi ^ t h
(8)
i=1
where: I is the total number of broadband technologies; Ci ^ t h is the mean downstream access capacity in year t; Ai ^ t h is the mean access capacity utilization in year t; bi is busy hour concentration factor; ui is packet switching concentration factor; HPi ^ t h denotes the access penetration (%) in year t; Fi ^ t h denotes the cumulative function of households for technology i in year t; m is the market potential. Our modification is performed by introducing the competitive forecasting model by technologies in equation (8). In this manner, as result of estimation the relevant forecasting parameters (coefficient of innovation and imitation of technology i, and total coefficient of innovation and imitation on broadband technology level) more efficient modelling of competitive market could be achieved. It is the main difference compared to [1] where the total number of households and market share are estimated. The downstream access capacity is continuously increasing. Nowadays, the operators offer a set of different access capacities. There will be an evolution from low access capacities to higher access capacities especially because of the new and enhanced applications. The broadband user does not utilize the maximum available capacity all the time. The access capacity utilization indicates the average utilized capacity taking into account the proportion of time during downloading and the proportion of time for upstream. This value also reflects the degree of using the specified bandwidth [1].
The busy hour concentration factor is defined as the ratio of traffic intensity in a busy hour and the total traffic generated during a day [24]. Traditional Internet services give low values for packet switching concentration factors. Applications like music on demand and video on demand generate high packet switching concentration [25]. The busy hour concentration factor is increasing because of the Internet. For broadband connections the busy hour concentration factor is significantly higher because of heavy users, longer holding times, flat rate and the evolution of new applications. Usually, the busy hour for residential broadband traffic is in the evening. The estimation of the number of households of a certain technology, should take into account the existence of other technologies at the same market place. If we are not able to estimate the household penetration, HPi ^ t h , by technology i, we may use the total broadband penetration of a considered area, HP, as we proposed in equation (8). The cumulative function of households, Fi ^ t h , is obtained based on the competitive diffusion model presented in Section 3.
5. NUMERICAL RESULTS – CASE STUDY IN SERBIA Table 1 shows the number of users on the Serbian telecommunication market: dial-up, ADSL, HFC/cable modem, FWB and other technologies. It is obvious that the dial-up Internet traffic decreases and will be continuously substituted by different broadband technologies. The existing competing broadband technologies on the Serbian market include HFC, ADSL and FWB. Moreover, it is expected that FTTx technology will be also introduced in the future. Table 1 - Number of users on the Serbian telecommunication market [26] Year
Dial up
2004
545,164
2005 2006 2007
ADSL
HFC 0
8,372
708,226
9,530
882,611
26,126
692,905
132,359
FWB
Other 0
6,117
23,956
1,049
13,914
54,598
21,968
10,210
87,731
36,059
2,276
2008
397,202
267,876
151,154
48,130
1,135
2009
252,195
351,252
187,923
45,864
5,547
In order to forecast the total broadband traffic, TR ^ t h , we estimated all the relevant parameters from equation (8) as follows. We assumed that the mean downstream access capacity will increase exponentially in the future for all the considered technologies due to launching of new multimedia services and expansion of various video services, Ci ^ t h = C^ t h [26]. The forecasted results for
Promet – Traffic&Transportation, Vol. 24, 2012, No. 4, 275-284
279
V. Radojičić, G. Marković, M. Janković, B. Drašković: Broadband Traffic Forecasting in the Transport Network
the mean downstream access capacity, for the Serbian market are presented in Figure 3. Based on the network traffic measurements of generated sessions, the linear trend is obtained for the utilization of access capacities for all the considered technologies, Ai ^ t h = A^ t h . The forecasted results for the mean access capacity utilization for the Serbian market are presented in Figure 4. 80,000 70,000 y = 239.31e0.3567x R 2 = 0.9802
60,000
Kbit/s
50,000 40,000 30,000 20,000 10,000
2019
2020
2017
2018
2016
2014
2015
2013
2012
2010
2011
2009
2007
2008
2005
2006
0
Year
Figure 3 - Mean downstream access capacity, C(t) 0.36
Mean access utilization
0.34 y = 0.0089x + 0.1971 R 2 = 0.9966
0.32 0.30 0.28 0.26 0.24 0.22
2019
2020
2018
2017
2016
2015
2014
2013
2012
2011
2010
2009
2007
2008
2005
2006
0.20
Year
Figure 4 - Forecasted results of the mean access capacity utilization, A(t)
The measurement results show that the packet switched concentration factor, u^ t h , and the busy hour concentration factor, b^ t h , for different broadband technologies are nearly constant values: u^ t h = u = 0.6 and b^ t h = b = 0.23 , respectively.
The growth of the Internet sector in Serbia is evident in terms of total revenues, cumulative number of broadband users and market penetration [ 26]. We noticed (Table 1) very significant increase of ADSL technology, slightly smaller increase of HFC technology. Also, wireless technology increased approximately linearly during the concerned period. It is obvious that in 2008 for the first time we had users of mobile internet. Based on the available statistical data for the Serbian market, the number of broadband penetration without 3G technology is 9.218% (2009) that is less than the average values for different European countries or EU countries. Otherwise, the broadband penetration with 3G technology is far greater, i.e. 16%. The forecasted results for total broadband penetration on the Serbian market, HP^ t h , are obtained based on the linear regression function ( R2 = 0.9904 ) given by the following equation [26]: HP^ t h = 2.5918t - 1.266 for t = 1^2004h, 2^2005h, f (10) The competitive diffusion model, presented in Section 3 (equations (2), (6) and (7)), for different broadband technologies is used for the calculation of the cumulative function of households, Fi ^ t h . The main advantage of this approach compared with other relevant papers is that it takes into account the competition on broadband market in order to estimate the number of users and the generated broadband traffic. We analyzed here two possible scenarios related with the diffusion model parameters. Scenario 1 assumes that the market potential, before (m) and after (M) launching new technology, stay the same (m = M ). The parameter values (before the new technology entry) were estimated by fitting the historical data for long-standing technologies from Table 1. After the new technology entry, we assumed that the coefficients of innovation remain unchanged, but the coefficients of imitation of the existing technologies are reduced. It means that the substitution effects will happen between new FTTx and current technologies (HFC, ADSL, and FWB). However, due to late technology entry the coefficients of imitation on the total broadband technology level will be increased. The required parameter values for Scenario 1 are given in Table 2.
Table 2 - Estimated parameters for Scenario 1 Before tn = 2010 ( m = 2.475.128 )
After tn = 2010 ( M = 2.475.128 )
i
Broadband technology
p = 0.03
q = 0.48
p = 0.03
Q = 0.52
1
HFC
p1 = 0.010
q1 = 0.060
p1 = 0.010
Q1 = 0.050
2
ADSL+
p2 = 0.001
q2 = 0.242
p2 = 0.001
Q2 = 0.220
3
FWB
p3 = 0.001
q3 = 0.035
p3 = 0.001
Q3 = 0.020
4
FTTx
–
–
–
Q4 = 0.120
280
Promet – Traffic&Transportation, Vol. 24, 2012, No. 4, 275-284
V. Radojičić, G. Marković, M. Janković, B. Drašković: Broadband Traffic Forecasting in the Transport Network
Table 3 - Estimated parameters for Scenario 2 Before tn = 2010 ( m = 2.475.128 )
After tn = 2010 ( M = 2.846.397 )
i
Broadband technology
p = 0.03
q = 0.48
p = 0.03
Q = 0.52
1
HFC
p1 = 0.010
q1 = 0.060
p1 = 0.010
Q1 = 0.060
2
ADSL+
p2 = 0.001
q2 = 0.242
p2 = 0.001
Q2 = 0.242
3
FWB
p3 = 0.001
q3 = 0.035
p3 = 0.001
Q3 = 0.035
4
FTTx
–
–
–
Q4 = 0.120
Scenario 2 assumes that the market potential, before (m) and after (M) launching new technology, is changed. Also, the coefficients of innovation and imitation of the existing technologies remain unchanged. Meanwhile, the coefficient of imitation on broadband technology level is increased. It means that the new technology entry will make influence only on the increasing of the market potential and total broadband penetration. Market positioning of technologies and the diffusion speeds also create substitution effects between technologies [27]. The diffusion coefficients and the factors associated with technological change and regulatory policies in telecommunication services are investigated in articles [28, 29]. The estimated parameter values for Scenario 2 are given in Table 3.
Market potential (m for t # tn and M for t $ tn ) is obtained by analyzing demographic statistical data for the whole territory of Serbia, taking into account the birth rate and migration rate of the population [26]. The results of the forecasted number of broadband residential users for Scenario 1 are illustrated by Figures 5, 6 and 7. Figure 5 provides a graphic presentation of the yearly growth of long-standing technologies before the new technology entry. In addition, Figures 6 and 7 illustrate the impact the new technology entry has on the broadband market. By looking at these figures, it is possible to forecast the number of users for each broadband technology and what actually will happen in terms of market expansion in the future. This is also illustrated by Figures 8, 9 and 10 for Scenario 2. 18
8 7 6
ADSL HFC FWB Total number of broadband users
Number of users (×105)
Number of users (×105)
9
5 4 3
16 14 12 10 8 6
2
4
1
2
0 2005
2006
2007
2008
2009
0 2005
2010
ADSL HFC FWB FTTx Total number of broadband users
2008
2011
Figure 5 - Cumulative number of residential users by technologies (HFC, ADSL, FWB) before tn for Scenario 1
2017
2020
Figure 6 - Cumulative number of residential users by technologies (HFC, ADSL, FWB, FTTx) after tn for Scenario 1 9
ADSL HFC FWB FTTx
10
5
Number of users (×105)
15
Number of new users (×104)
2014 Year
Year
8 7 6
ADSL HFC FWB Total number of broadband users
5 4 3 2 1
0 2005
2008
2011
2014
2017
2020
Year
Figure 7 - Current number of new users by technologies (HFC, ADSL, FWB, FTTx) for Scenario 1
Promet – Traffic&Transportation, Vol. 24, 2012, No. 4, 275-284
0 2005
2006
2007
2008
2009
2010
Year
Figure 8 - Cumulative number of residential users by technologies (HFC, ADSL, FWB) before tn for Scenario 2
281
V. Radojičić, G. Marković, M. Janković, B. Drašković: Broadband Traffic Forecasting in the Transport Network
2.5 ADSL HFC FWB FTTx Total number of broadband users
16 14 12
Number of new users (×105)
Number of users (×105)
18
10 8 6 4
ADSL HFC FWB FTTx
2.0 1.5 1.0 0.5
2 0 2005
2008
2011
2014
2017
0 2005
2020
2008
2011
Year
Figure 9 - Cumulative number of residential users by technologies (HFC, ADSL, FWB, FTTx) after tn for Scenario 2
2017
2020
Figure 10 - Current number of new users by technologies (HFC, ADSL, FWB, FTTx) for Scenario 2 100
70 60
2014 Year
FTTx FWB
ADSL HFC
90
FTTx FWB
ADSL HFC
Market share (%)
Market share (%)
80 50 40 30
70 60 50 40 30
20
20 10 0
10 0 2011 2012 2013 2014 2015 2016 2017 2018 2019 2020 Year
2011 2012 2013 2014 2015 2016 2017 2018 2019 2020 Year
Figure 11 - Forecasted broadband market share by technologies (Scenario 1)
Figure 12 - Forecasted broadband market share by technologies (Scenario 2)
Based on the results of the forecasted number of broadband users, it is possible to illustrate the market share by technologies up to 2020, for Scenario 1 (Figure 11) and Scenario 2 (Figure 12).
In both Scenarios it is obvious that the technologies that enter into the market earlier, in practice, keep the leadership position for a long time. This is also shown by [2]. Better positioning on the broad-
1400 1200
Traffic [Gb/s]
1000 800 600 400 200 0 Scenario 1 Scenario 2
2011 2012 2013 2014 2015 2016 7 14 27 48 82 136 9 19 38 68 117 194
2017 2018 2019 2020 222 358 570 900 316 509 810 1278
Figure 13 - Traffic forecasting results for Scenarios 1 and 2
282
Promet – Traffic&Transportation, Vol. 24, 2012, No. 4, 275-284
V. Radojičić, G. Marković, M. Janković, B. Drašković: Broadband Traffic Forecasting in the Transport Network
band market could be reached by higher quality of service, competitive tariffs and longer advertising time [30]. Based on equation (8) we obtained the total broadband traffic, TR ^ t h , generated by residential and SOHO users, into the transport network. Results for Scenarios 1 and 2 are given by Figure 13. It could be noticed that the total residential and SOHO broadband traffic will increase exponentially in the future. For example, it is expected that in 2015 the total broadband traffic into the transport network will reach about 82 Gbit/s (Scenario 1) and 117 Gbit/s (Scenario 2). Higher values of forecasted traffic for Scenario 2 result from greater market potential and coefficient of imitation on broadband technology level.
6. CONCLUSION The major advantage of the presented approach is that the forecasting procedure combines two concepts. The first one is its ability of modelling the competition of different technologies on the broadband market and the second is to forecast overall residential traffic as well as market share of various technologies. In this paper we analyzed the effects of the new broadband technology entry on the diffusion dynamics of the existing technology. We considered the Serbian broadband market for residential and SOHO users. We assumed two possible scenarios. Firstly, the new technology entry has led to a decrease of the imitation factors of long-standing technologies. Secondly, the market potential increase and the late entry do not change the diffusion parameters of other technologies. The obtained forecasted results for the number of users and traffic are greater in case of Scenario 2. However, we expect that Scenario 1 would be more likely for the Serbian market. The presented model will be useful to technology managers, because the simple presentation of the number of users does not explain the competition effect between long-standing technologies as well as the effect the fourth technology entry has on the market. The proposed model can be used to study the consequence of any changes in the broadband market, such as reposition of an existing technology, major price reduction, and a grand promotional campaign by an existing technology. The main objective of the presented model is to predict busy hour residential traffic increase into the transport network. However, the obtained results do not include redundancy and protection capacity in the transport network. These forecasted values are required inputs to transport network planning process – evaluating new network structures, expansion of the network and introduction of new network services and technologies.
Dr VALENTINA RADOJIČIĆ E-mail:
[email protected] Dr GORAN MARKOVIĆ E-mail:
[email protected] Univerzitet u Beogradu, Saobraćajni fakultet Vojvode Stepe 305, 11000 Beograd, Srbija Dr MILAN JANKOVIĆ E-mail:
[email protected] Republička agencija za elektronske komunikacije Višnjićeva 8, 11000 Beograd, Srbija BORKO DRAŠKOVIĆ, M.Sc. E-mail:
[email protected] Telekom Srbija, a.d. Takovska 2, 11000 Beograd, Srbija
REZIME PROGNOZIRANJE ŠIROKOPOJASNOG SAOBRAĆAJA NA NIVOU TRANSPORTNE MREŽE U ovom radu predložen je modifikovan model za prognoziranje širokopojasnog saobraćaja na nivou transportne mreže, generisanog od strane rezidencijalnih i malih poslovnih korisnika. Ovim modelom se omogućava prognoziranje broja korisnika po različitim širokopojasnim tehnologijama tako što se uzima u obzir međusobni uticaj konkurentnih tehnologija, kao i uticaj ulaska nove tehnologije na sveukupan razvoj tržišta. Neophodni parametri modela procenjeni su za slučaj tržišta širokopojasnih servisa u Srbiji. Dobijeni rezultati predstavljaju neophodne ulazne parametre za proces planiranja i dimenzionisanja resursa transportne mreže.
KLJUČNE REČI širokopojasne tehnologije, prognoziranje, tržište, mreža, saobraćaj
LITERATURE [1] Stordahl, K.: Long-term telecommunication forecasting, Ph.D. thesis, Norwegian University of Science and Technology, Trondheim, Norway, 2006 [2] Dischinger, M.: Making Broadband Access Networks Transparent to Researchers, Developers, and Users, Ph.D. thesis, University of Karlsruhe, Karlsruhe, Germany, June 2010 [3] OECD Broadband Portal, 2009. Available at: http:// www.oecd.org/sti/ict/broadband [4] Windsor Oaks Group, Market Outlook Report: Global Fixed Broadband Subscriber Forecast, 2009. Available at: http://www.broadbandtrends.com/Report_Summary/BBT_GlobalBBOutlook_091140_Summary.htm [5] Rappoport, P., Alleman, J., Taylor, L.: Forecasting the Spatial Deployment of FiOS, Telektronikk, Vol.104, No. 3/4, 2008, pp. 29–36 [6] Hoven, G.: Open fiber-to-the-home networks in Europe, IEEE LEOS Newsletter, 2008, pp. 13-14 [7] Larsen, C.P.: Access network technologies: deployments in Sweden, 33rd European Conference on Optical Communication, Berlin, Germany, No. 1, pp. 39-42, September 2007
Promet – Traffic&Transportation, Vol. 24, 2012, No. 4, 275-284
283
V. Radojičić, G. Marković, M. Janković, B. Drašković: Broadband Traffic Forecasting in the Transport Network
[8] Cambini, C., Jiang, Y.: Broadband Investment and Regulation: A Literature Review, Telecommunications Policy, Vol. 33, No. 10-11, 2009, pp. 559-574 [9] Stordahl, K., Murphy, E.: Forecasting Long-Term Demand for Services in the Residential Market, IEEE Communications Magazine, Vol. 33, No. 2, 1995, pp. 44 - 49 [10] Radojicic, V.: Forecasting in telecommunications, The Faculty of Transport and Traffic Engineering, University of Belgrade, Serbia (originally in Serbian), 2003 [11] Radas, S.: Diffusion Models in Marketing: How to Incorporate the Effect of External Influence, Privredna kretanja i ekonomska politika, Vol. 15, No. 105, 2005, pp. 30-51 [12] Lucky, R.W.: New Communications Services – What Does Society Want?, Proceedings of the IEEE, Vol. 85, No. 10, 1997, pp. 1536-1543 [13] Mahajan, V., Muller, E., Bass, M.F.: New Product Diffusion Models in Marketing: A Review and Directions for Research, Journal of Marketing, Vol. 54, No. 1, 1990, pp. 1–26 [14] Mahajan, V., Muller E., Wind Y.: New Product Diffusion Models: From Theory to Practice, Kluwer Academic Publishers, Boston, pp. 3-24, 2000 [15] Krishnan, T.V., Bass, F.M., Kumar, V.: Impact of a Late Entrant on the Diffusion of a New Product/Service, Journal of Marketing Research, Vol. 37, No. 2, 2000, pp. 269–278 [16] Kumar, A., Baisya, R.K., Shankar, R., Momaya, K.: Diffusion of mobile communications: Application of Bass diffusion model to BRIC countries, Journal of Scientific & Industrial Research, Vol. 66, No. 4, 2007, pp. 312316 [17] Geroski, P.A.: Models of technology diffusion, Research Policy, Vol. 29, No. 4/5, 2000, pp. 603-625 [18] Vanston, L.K., Hodges, R.L.: Technology forecasting for telecommunications, Telektronnikk, Vol. 100, No. 4, 2004, pp. 32-42 [19] Bass, F.M.: New Product growth model for consumer durables, Management Science, Vol. 15, No. 15, 1969, pp. 215-227
284
[20] Sterman, J.D.: Business Dynamics: System Thinking and Modelling for a Complex World, Irwin/McGraw Hill, Boston, 2000 [21] Bolton, R.N., Lemon, K.N.: A Dynamic Model of Customers’ Usage of Services: Usage as an Antecedent and Consequence of Satisfaction, Journal of Marketing Research, Vol. 36, No. 2, 1999, pp. 171–186 [22] Lyons, M.H., Burton, F., Egan, B., Lynch, T., Skelton, S.: Dynamic Modeling of Present and Future Service Demand, Proceedings of the IEEE, Vol. 85, No. 10, 1997, pp. 1544-1555 [23] Norton, J., Bass, F.M.: A Diffusion Theory Model of Adoption and Substitution of Successive Generations of High Technology Products, Management Science, Vol. 33, No. 9, 1987, pp. 1069-1086 [24] Stordahl, K.: Traffic Forecasting Models for the Incumbent Based on New Drivers in the Market, Telektronikk, Vol. 104, No. ¾, 2003, pp. 122–127 [25] Stordahl, K., Elnegaard, N.K.: Broadband in the residual market: First mover’s advantage. Proceedings World Telecommunication Congress, Budapest, Hungary, April – May, 2006 [26] Republic Agency for Electronic Communications: An Overview of Telecom Market in the Republic of Serbia in 2010, 2010, available at: http://www.ratel.rs/market/overviews_of_telecom_market.129.html [27] Armstrong, J.S.: Principles of Forecasting. A Handbook for Researchers and Practitioners. Kluwer Academic Publishers, Boston, 2001 [28] Hjelkrem, C.: Market scenarios and conjoint analysis. Telektronikk, Vol. 104, No. ¾, 2008, pp. 136–143 [29] Gruber, H.: Competition and innovation. The diffusion of mobile telecommunications in Central and Eastern Europe, Information Economics and Policy, Vol. 13, No. 1, 2001, pp. 19-34 [30] Kohli, C.: Signaling New Product Introductions: A Framework Explaining the Timing of Preannouncement, Journal of Business Research, Vol. 46, No. 1, 1999, pp. 45-56
Promet – Traffic&Transportation, Vol. 24, 2012, No. 4, 275-284