(SEMS) at Robert Morris University (RMU) was awarded a five-year grant from the National Science Foundation. (NSF) to fund scholarships to 21 academically ...
Building a Community of Scholars: One University’s Story of Students Engaged in Learning Science, Mathematics, and Engineering Through a NSF S-STEM Grant – Part II Maria Kalevitch Cheryl Maurer Paul Badger Greg Holdan Robert Morris University Abstract The School of Engineering, Mathematics, and Science (SEMS) at Robert Morris University (RMU) was awarded a five-year grant from the National Science Foundation (NSF) to fund scholarships to 21 academically talented but financially challenged students majoring in the disciplines of science, technology, engineering, and mathematics (STEM). Each student received a total of $24,000 over their four years of study. This study presents the experiences during years three through five of the grant project. Most importantly, this paper focuses on the experiences and tracking data from this cohort of students during their second, third, and fourth years as college students. Terms: STEM (Science, Technology, Education, and Mathematics), SEMS (School of Engineering, Math and Science
Introduction In our previously published JSTEM article (2012) we explain that “While 25 percent of high-achieving lowerincome students fall out of the top academic quartile in math in high school, only 16 percent of high-achieving upper income students do so” (Wyner et al., 2007). This margin of difference may affect how these same lowerincome students perceive math and science programs. There is also evidence that math and science are yet among the subjects underrepresented by minorities and women. Not only are they limited in terms of income, but also they may be limited as to choice of discipline or major, especially in the math and science. With this in mind, The School of Engineering, Mathematics, and Science (SEMS) at Robert Morris University successfully pursued a fiveyear grant from the National Science Foundation (NSF) to award scholarships to 21 academically talented but financially challenged students majoring in the disciplines of science, technology, engineering, and mathematics (STEM)” (Kalevitch et al., 2012). The purpose of this paper is a continuation of the findings reported from years two through four of the STEM
40
program relative to both academic progress and selfefficacy of the student participants. Drs. George Semich and James Bernauer conducted focus group queries throughout this time and will be reporting these qualitative findings in a separate article. Focus group queries were conducted at the beginning the program, during the first two weeks of their second semester, at the end of their first year, and finally near the end of their last year.
Background Our previous article mentioned that “in a report from Tapping America’s Promise: Education for Innovation Initiative 2008, it was noted that by the year 2015 the goal was to increase the annual number of U.S. science, technology, engineering, and math bachelor level undergraduates. The competition from foreign countries certainly has impacted the United States relative to its ability to move forward in these key areas. In fact, President Obama (2010) proposed a national initiative to increase the number of mathematics and science teachers across the nation, and recognized more than 100 educators and mentors, including 56 NEA members, for their outstanding contributions to science, technology, engineering, and mathematics (STEM). In the president’s fiscal year 2011 budget, $150 million of the Investing in Innovation fund will be focused on STEM projects. Moving forward is not a matter of suggestion but rather a matter of expressed need” (Kalevitch et al., 2012). In addition, the President’s Council of Advisors on Science and Technology presented a report to the President titled, “Engage to Excel: Producing One Million Additional College Graduates with Degrees in Science, Technology, Engineering, and Mathematics” in February 2012. This
Arif Sirinterlikci report states that economic projections point to a need for approximately 1 million more STEM professionals than the U.S. will produce at the current rate over the next decade if the country is to retain its historical preeminence in science and technology. To meet this goal, the United States will need to increase the number of students who receive undergraduate STEM degrees by about 34% annually over current rates. As mentioned in our previous article, “to meet this need, Robert Morris University successfully embarked on a grant-seeking opportunity through the National Science Foundation. After weighing and considering various options, it was decided that the School of Engineering, Mathematics and Science (SEMS) at Robert Morris University would target a group of local students who were academically talented, but financially challenged, to participate in a college program with emphasis on the disciplines of science, technology, engineering, and mathematics. A total of twenty-one students were identified with the assistance of the admissions counselors at the University. The STEM grant would cover a five-year period and provide each student with a stipend of $24,000 for expenses during the four-year period to completion of the degree” (Kalevitch et al., 2012). The twenty-one students who were selected had to meet financial eligibility requirements as well as academic requirements. Financial eligibility was determined by the Free Application for Federal Student Aid (FAFSA), which determines a student’s Expected Family Contribution (EFC). This was used to determine Pell Grant eligibility. The full application package included an academic transcript, a personal essay, and three recommendation letters as well as an evaluation form completed by the high school counselor and two teachers. Once the students
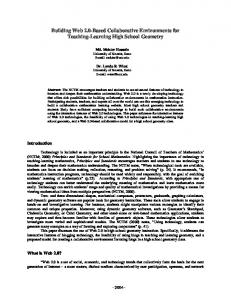
Table 1. Incoming Admission Criteria of STEM Scholars and SEMS Freshmen Class
Journal of STEM Education
Volume 16 • Issue 2
May-July 2015
were accepted to the university, a personal interview was conducted to evaluate each applicant for a STEM scholarship, which requires a minimum overall GPA of 3.2 and SAT scores of 1150. Table 1 is a summary of the initial cohort’s admission criteria which shows that the group had an average GPA of 3.65 and an average SAT score of 1176. The average GPA and SAT score of incoming freshmen in SEMS were 3.60 and 1143. Once the students were selected for the scholarship, they were required to maintain a minimum QPA of 3.0 and demonstrate financial need in order to remain eligible for the scholarship. A living-learning environment was created for the STEM Scholars who chose to live on campus. They were assigned to room with each other in a specific campus dormitory, on the same floor, as opposed to being randomly placed among the other freshmen. They also had a designated Resident Assistant who was a SEMS student. They initially came to campus two weeks prior to the start of the fall semester (and the majority of other freshmen) to participate in the Mathematics and Science Boot Camp (MSBC). The main goal of the MSBC was to prepare the students in their future science and mathematics classes and to form camaraderie in this new Living-Learning Cohort. In addition to the academic exercises, they were involved in orientation sessions that included community service, cultural activities, reading and writing skills strategies, as well as success, note-taking, time management, critical thinking, and decision-making skills. They also learned more about the university as a community that included academic services, career services, engagement transcripts, financial aid, a library, and cultural diversity. The week was followed by a separate Freshmen Orientation presented by Student Services. A sense of camaraderie was also created by having the STEM Scholars take several common classes together in their first year. They found this to be beneficial as they were comfortable asking one another for help if they felt they were having problems in their classes. This enabled them to help each other and become leaders amongst their fellow students. As a result, study groups and peer tutoring had formed among the group.
Retention of the STEM Cohort The retention of the students making up the STEM cohort was high throughout their four years of study. As can be seen in Table 2, the retention of students from semester to semester did not fall below 85%. Table 3 shows the yearly retention rate in which the lowest year, at approximately 81%, was seen from Year 1 (Fall 2009) to Year 2 (Fall 2010) which was their freshman to sophomore year. This was expected to be the lowest as most students transfer or withdraw after their first or second semesters. When comparing this number to all freshmen SEMS students from Fall 2009 to Fall 2010, it is practically the same at 80.5%, but higher than all freshmen RMU stu-
Table 2. Retention Rates by Semester
Table 3. Retention Rates by Year
dents at 74.7%. It is also comparable to the average retention rate of first year SEMS students over the past 10 years at 83.3% but again much higher when comparing this to all first year RMU students at 77.5% over the same time frame. At the beginning of their sophomore year (Fall 2010), 17 out of the original 21 students of the STEM Cohort remained (retention rate of about 81%). By the end of the Fall 2010 semester, three more students left the program. One left during the middle of the Fall 2010 semester due to personal reasons, one transferred at the end of the fall semester, and the third became academically ineligible at the end of the fall semester but still returned to Robert Morris University in the spring. There were no additional changes during the Spring 2011 semester so by the end of their sophomore year, 14 out of the original 21 remained which calculates as a 66.7% overall retention rate. The cohort was then comprised of 12 males (about 57%) and 9 females (about 43%) with a total of seven (7) students each in engineering, mathematics, and science. The cohort went unchanged during their junior year so there was a 100% retention rate of this particular group for three (3) consecutive semesters. The end of the Spring 2011 semester marked the first time since the STEM Scholars started in the Fall 2009 that there was not a change after each semester. The cohort was still comprised of seven (7) students each in engineering, mathematics, and science with a total of 12 males (about 57%) and 9 females (about 43%). Once again the cohort remained the same during their senior year with the exception of one student leaving RMU after the Spring 2012 semester due to personal reasons. Of the original 21 students, 13 remained which calculates as Table a 61.9% overall retention rate. Thisforalso equates to the 1. Descriptive Information Teacher Areas
Journal of STEM Education
Volume 16 • Issue 2
four-year graduation rate versus a four-year graduation rate of 55-57% for all RMU students. Twenty students, or 95%, completed the program within four years. Three students graduated one semester early at the end of the Fall 2012 semester. In the end, the cohort was comprised of seven students each in engineering and science and six in mathematics with a total of 12 males (60%) and 8 females (40%). Traditionally, RMU programs have more males than females.
STEM Scholars’ Academic Performance The cohort as a group did very well academically for their second year (Fall 2010 and Spring 2011) (Table 4). The overall QPA, 3.44, is equivalent to a B+, which was higher than their overall first year QPA of 3.29. For the Fall 2010 semester, fifteen (71.4%) students had GPAs that ranged from 3.00 to 4.00. Six students had GPAs below 3.00 and one student withdrew during the semester. For the Spring 2011 semester, again, fifteen (71.4%) students had GPAs that ranged from 3.21 to 4.00, four students ranged from 2.77 to 2.98, and the other two students had a 2.57 or lower. It can be also noted from Table 4 that the overall GPA average for all STEM participants was 3.44, with science students having a GPA average of 3.49, engineering students having a GPA average of 3.43 and mathematics students having a GPA average of 3.38. Using a GPA of 3.0 as a measure for a year-end success, we note that 85.7% (18 students) of the cohort achieved this criterion. When comparing the STEM Scholars’academic performance to the other students in their courses for the 20102011 academic year, the STEM Scholars did well (Table 5).
May-July 2015
41
Table 4. STEM Scholar Sophomore Year Academic Performance
Table 5. Course Summary for 2010-2011 Academic Year
Table 6. STEM Scholar Junior Year Academic Performance
42
Journal of STEM Education
Volume 16 • Issue 2
Out of all the grades that were earned by the STEM Scholars, slightly more than 96% were a combination of ‘C’s and higher. Of this total, there were 85 ‘A’s, or 52.8%. The remaining 3.7% was comprised of two ‘D’s, zero ‘F’s, and four ‘Withdrawals’. In comparing the overall GPAs of the class averages and the STEM averages, the STEM Scholars had an overall average of 3.30 whereas the class average was 2.88. As a group, the STEM Scholars performed better than their peers in their classes. When looking at the STEM Scholars’ performance for their third year (Fall 2011 and Spring 2012), they also did well (Table 6). Their performance was very similar to the 2010-2011 academic year mentioned previously. The overall QPA was 3.43, compared to a previous 3.44. Again, this average is equivalent to a B+. Nineteen students, or 90.5%, had GPAs that ranged from 3.00 to 4.00 for the Fall 2011 semester. For the Spring 2012 semester, this number fell to fifteen in the same range. The Science, Engineering, and Mathematics groups’ performances were almost identical to the previous year when comparing their GPA averages. Science was 3.45, Engineering was 3.44, and Mathematics was 3.38. Overall, the group finished the year strong with nineteen (90.5%) having an overall QPA above 3.00. When comparing the STEM Scholars’ academic performance to the other students in their courses, they did rather well. Out of all of the grades that were earned by the STEM Scholars, almost 95% of the grades were a combination of ‘C’s and higher with more than 82% ‘A’s and ‘B’s and more than 46% ‘A’s only. In comparing the overall GPAs of the class averages and the STEM averages, the STEM Scholars had an overall average of 3.32, whereas the class average was 3.12 (Table 7). The students’ academic success can be credited partly to their participation in the Guaranteed 4.0 Learning System that met during the Spring 2012 semester. Students gave a great deal of positive feedback about this program. The only negative comments received were that the students felt it would have been more beneficial to them if they could have participated in this program earlier in their college careers, but unfortunately this program was not available to the students until December 2011. The 4.0 Learning Program is designed to help students learn how to develop better study, critical thinking and time management May-July 2015
the STEM averages, the STEM Scholars had an overall average of 3.35, whereas the class average was 3.13 (Table 9). Once again as a group, the STEM Scholars performed better than their peers in their classes.
Summary of the STEM Cohort’s Academic Performance
Table 7. Course Summary for 2011-2012 Academic Year
The cohort consistently outperformed their peers in their courses every semester. On average, the group’s performance was equivalent to a B+ as compared to a B of their peers. Nine students from the cohort can boast a QPA of 3.60 or higher, with two students having near perfect and one student having a perfect QPA of 4.0. Table 10 summarizes the academic performance of the cohort as a whole as well as in each discipline per semester, and Table 11 summarizes the comparison of the overall GPAs of the class averages and the Cohort averages as well as their retention rates. Three students (two in mathematics and one in science) were able to complete their degrees and graduate at the end of the Fall 2012 semester. Currently, both mathematics students are employed in their fields and the science student is attending graduate school for neuroscience. The majority of the remaining students graduated at the end of the Spring 2013 semester. Nine of these students will be attending graduate school and eight plan to enter the workforce.
Table 8. STEM Scholar Senior Year Academic Performance
Internships, Research Projects, and Service
Table 9. Course Summary for 2012-2013 Academic Year
skills. It provides students with a three-step method that enhances their ability to learn principles and concepts. The “what to do,”“how to do it” and “why” are addressed so students can deal with day to day problems. , The concepts of repetition and effective information input are also introduced to the students so all of this combined can lead to the ultimate goal of enhanced critical thinking. The STEM Scholars’ performance for their senior year (Fall 2012 and Spring 2013) was consistent with the previous three years, with the exception of having the highest overall QPA of 3.47 (Table 8). Again, this average is equivalent to a B+. The performance of all three disciplines improved from the previous year. Seventeen students out of twenty, or 85%, had GPAs that ranged from 3.00 to 4.00 for the Fall 2012 semester. For the Spring 2013 semester, this number was fifteen out of seventeen students, or
88%, in the same range. When looking at the STEM Scholars performance for the Spring 2013 semester, they did extremely well as this was their best semester performance. The average GPA for the Spring 2013 semester was 3.58. Again, the performance of all three disciplines improved from the previous semester. The engineering students had an average GPA of 3.69, math was 3.43, and science was 3.57. The average QPA of 3.47 shows their performance has been consistent over their four years of study. The students also performed better than their peers in their classes again. Out of all the STEM Scholars’ grades, about 94% were a combination of ‘C’s and higher, with almost 81% of the grades being ‘A’s and ‘B’s and about 61% ‘A’s only. In comparing the overall GPAs of the class averages and
Journal of STEM Education
Volume 16 • Issue 2
In addition to the STEM cohort’s strong academic performance, they were involved in professional experiences as well as community service, cultural activities, and outreach activities,just to name a few, throughout their academic careers. Some examples include National Society of Collegiate Scholars, Alpha Chi National College Honor Society, RMU Honors Program, Habitat for Humanity, Division I and Club sports, peer tutors, fraternities, sororities, and various other RMU student organizations. This cohort served as a strong support mechanism to help other students adapt to the college environment and succeed in the future. During their four years of study at Robert Morris University, the cohort also participated in study abroad programs, undergraduate research, and internships. The study abroad programs were faculty-led trips that traveled to Germany and Ireland. Research projects included neu-
May-July 2015
43
the living-learning environment, developed bonds with one another, and displayed high self-efficacy which was critical to the success of the program. As a continuation of the first article, it confirms that a Living-Learning Cohort model was beneficial to these students during their undergraduate studies. Disclaimer: Any opinions, findings, and conclusions or recommendations expressed in this material are those of the authors and do not necessarily reflect the views of the National Science Foundation. Table 10. Summary of Cohort’s Academic Performance
Acknowledgement
This material is based upon work supported by the National Science Foundation under Grant No. 0806927.
References Kalevitch, M., Maurer, C., Badger, P., Holdan, G., Sirinterlikci, A. (2014). Living-learning community in support of STEM education. 2014 Education and STEM by Hawaii University International Conferences. (This presentation was possible because of a NSF S-STEM Scholarship grant awarded to RMU in 2008, #0806927).
Table 11. Comparison of Overall GPAs and Retention Rates of Cohort and Class
ral interface and artificial fingertip testing, feasibility of an anaerobic digester at RMU, self-contained liquid cooling apparatus with CO2, the effect of salinity on the foraging rates of Ramshorne snails, and how coral growth is affected under different spectrums of light. Internships were completed at a variety of STEM companies (United States Steel, Elliott Group, Medrad/Bayer, Bactronix Corporation, Cline Financial Group, LLC, Department of Environmental Protection, etc.). As a result of faculty-student collaboration, two engineering students partnered with an engineering faculty to write a medical manufacturing article, “Designing and Manufacturing Medical Devices with Antimicrobial Technology”, whichwas published in Manufacturing Engineering, Volume 148, Issue 1, January 2012, Pages 73-80. A one-page version of this paper was also published in Medical Manufacturing Yearbook of Society of Manufacturing Engineers, 2011. In addition, their work was cited and included in “Antimicrobial Technologies in Design and Manufacturing of Medical Devices” from the SME 2012 Nanomanufacturing Conference.
44
Conclusion The Living-Learning Cohort model for the STEM Scholars proved to be an overall success. This was apparent in their academic excellence that they displayed throughout their four years of study, the high retention rates from year to year and even semester to semester, and the strong component of advising and mentoring, which they received over the duration of their academic careers. Internships and research projects provided a solid foundation for their future success, as well as their service and other extracurricular activities. One student was quoted as saying, “RMU prepared me more than I could have expected”. In addition, excellent student life support services were at their disposal. All of these components contributed to the achievements of the STEM Scholars who graduated in four years, and even less than that in three cases, who otherwise would not have been able to obtain a college degree without the financial support of the scholarships made possible through the NSF S-STEM grant. Several students commented that the S-STEM Program was the deciding factor for them to attend Robert Morris University instead of other local institutions. They ended being in favor of
Journal of STEM Education
Volume 16 • Issue 2
Kalevitch, M., Maurer, C., Badger, P., Holdan, G., Iannelli, J., Sirinterlikci, A., Semich, G., Bernauer, J. (July–September 2012). Building a community of scholars: one University’s story of students engaged in learning science, mathematics, and engineering through a NSF S-STEM grant. Journal of STEM Education, 13 (4), 34-42. McKinsey & Co., Social Sector Office. (2009). The economic impact of the achievement gap in America’s schools. Retrieved on December 3, 2010 from http://www. mckinsey.com/clientservice/socialsector/ achievementgap.asp Obama, B. (2010). National security strategy. Washington, D.C. The White House. President’s Council of Advisors on Science and Technology. (February 2012). Report to the President: “Engage to excel: producing one million additional college graduates with degrees in science, technology, engineering, and mathematics”. Retrieved from http:// www.whitehouse.gov/sites/default/ files/microsites/ostp/pcast-engage-toexcel-v11.pdf
May-July 2015
Wyner, J.S., Bridgeland, J.M., DiIulio, Jr., J.J. (2007). Achievement trap: a report by the Jack Kent Cooke Foundation. Retrieved from http://www.jkcf.org/ news-knowledge/research-reports/ NSF Grant Award 0806927. (2008-2013). Robert Morris University School of Engineering, Mathematics, and Science (SEMS) S-STEM Scholar Program.
Dr. Kalevitch is the Dean of School of Engineering, Mathematics and Science at Robert Morris University. Dr. Kalevitch is committed to excellence in teaching and always promotes a student-centered learning environment. She has also proven herself to be a very effective researcher: her resume shows a substantial list of publications, including lab manuals, books, and journal articles. She serves as the member of Editorial Advisory Board for several national and international peer-reviewed scientific journals. She was the Project Director on a 5-year NSF S-STEM grant for $562,000 that brought 21 STEM scholarships to the university. Cheryl Maurer is the Director of Science Laboratories
at Robert Morris University where she serves as a member of the Lab Safety and Hazardous Materials Subcommittee. She has also been a member of the Women’s Leadership Advisory Council since its inception in 2010. The council was formed to better engage women alumni and female students at Robert Morris University. She has also been involved in STEM Outreach programs such as the Science Bowl, Expanding Your Horizons (EYH), and Perfume Science workshops.
Paul Badger, Associate Professor of Science and Laboratory Safety Coordinator joined the faculty at Robert Morris University in the fall of 2005 and has taught courses in general chemistry, bio-organic chemistry, organic chemistry, toxicology, forensics, instrumental analysis, and physics. Paul also conducts SEMS workshops for middle and high school students and helps to direct the RMU summer forensic science camp. He has co-authored several papers on near-infrared-emitting Lanthanide complexes and reductively activated complexes of Mn, Cr, and W. He is currently collaborating with the RMU science faculty on research pertaining to soil and water chemistry. Greg Holdan is an Associate Professor of Mathematics
and Education at Robert Morris University. He is the coordinator for secondary mathematics teacher certification and also serves on the graduate and doctoral faculties at Robert Morris. Prior to coming to RMU fourteen years ago, he taught mathematics and computer science at Mt. Lebanon School District, near Pittsburgh. His research interests include learning style and teacher reflection.
Arif Sirinterlikci is the Department Head of Engineering, the Director of Engineering Laboratories, and a University Professor of Engineering at Robert Morris University. He has been an active member of American Society for Engineering Education (ASEE) and Society of Manufacturing Engineers (SME), serving as the Chair of the ASEE Manufacturing Division and SME Bioengineering Tech Group. He has been engaged in STEM Education through Ohio Summer Honors Institute, Benedum Foundation sponsored activities, and Carnegie Science Center. He has also organized multiple competitions including Math Counts, Science Bowl, and FIRST Tech Challenge (FTC).
Journal of STEM Education
Volume 16 • Issue 2
May-July 2015
45