been working with the states of Vermont and North Carolina to identify ... their child's development sufficiently addressed by providers (Bethel et al 2001b).
BUILDING A MODEL SYSTEM OF DEVELOPMENTAL SERVICES IN ORANGE COUNTY
Neal Halfon MD, MPH Shirley Russ, MB ChB, MPH Michael Regalado, MD UCLA Center for Healthier Children, Families, and Communities UCLA School of Public Health
September 2004
UCLA Center for Healthier Children, Families and Communities
1
Acknowledgments This report was funded by a contract from the Children and Families Commission of Orange County. The authors are grateful for the contributions of those interviewed in Orange County for this targeted study. Special thanks go to Christina Altmayer and Alyce Mastrianni for their assistance with the study. Thanks are also due to Debra Mathias for her contributions to the assessment of systems capacity. The opinions expressed in this report are those of the authors.
2
Executive Summary ...................................................................................................................... 8 Proposal for Model Developmental Services System for Orange County ............................. 18 Figure 1: Model System of Developmental Services .......................................... 18 Components of the System:........................................................................................................ 18 First Level: Community-Based Developmental Surveillance and Supports ............... 18 Second Level: Secondary Screening and Surveillance................................................ 18 Third Level: Mid-Level Developmental Assessment, Treatment and Coordination Center............................................................................................................................ 19 Fourth Level: Regional Center...................................................................................... 19 Strategies: .................................................................................................................................... 19 Time and Phasing:......................................................................................................... 19 Sector Strategy:............................................................................................................. 20 Innovation Strategy:...................................................................................................... 20 Place-based Strategies:.................................................................................................. 20 Collaborative Strategies:............................................................................................... 20 Governance: .................................................................................................................. 21 Purpose and Outline ................................................................................................................... 24 The Importance of Developmental Services ............................................................................. 24 Need for a More Systematic Approach..................................................................................... 25 Challenges and Opportunities ................................................................................................... 26 Conceptual Challenges and Gaps .............................................................................................. 26 Figure 2: Transactional Model.............................................................................. 28 Service System Barriers and Challenges .................................................................................. 30 Child Health Providers.................................................................................................. 30 Workforce Training ...................................................................................................... 30 Service fragmentation ................................................................................................... 31 Financial Barriers and Challenges ............................................................................................ 31 Data System Barriers and Challenges....................................................................................... 31 Accountability data ....................................................................................................... 31 Orange County Challenges and Opportunities........................................................................ 31 Study Approach .......................................................................................................................... 33 Figure 3: Readiness to Learn Trajectory.............................................................. 34 Figure 4: Care Model for Child Health (Wagner) ............................................... 35 Figure 5: Critical Pathway to School Readiness.................................................. 35 Demographics of the Orange County 0-5 Population.............................................................. 36 Health and Developmental Services Needs............................................................................... 36 Existing Developmental Services ............................................................................................... 36 Structure:....................................................................................................................... 36 Personnel:...................................................................................................................... 36 Process: ......................................................................................................................... 37 Outcomes: ..................................................................................................................... 37 Key Informant Interviews.......................................................................................................... 37 Focus groups................................................................................................................................ 38 Demographics of the Orange County 0-5 Population.............................................................. 39 Table 1: Population of Orange County aged 0-4 years (OCHNA 2001 Survey) ........................................................................................................................... 39
3
Table 2: Population Characteristics in Orange County and California............ 40 Health and Developmental Services Needs............................................................................... 40 Infant Mortality and Morbidity..................................................................................... 40 Health Insurance Status................................................................................................. 41 School Readiness Indicators....................................................................................................... 41 Table 3: Orange County School Readiness Indicators (CHIS 2001)............... 42 Prevalence of Neurodevelopmental Problems.......................................................................... 42 Table 4: Children served by Early Start, Regional Center and Special Education in Orange County............................................................................. 43 Special Education........................................................................................................................ 43 Table 5: Special Education Enrollment by Age and Disability in Orange County (2002) ................................................................................................... 44 Figure 6: Special Education Enrollment by Age and Disability in Orange County (2002).................................................................................................................... 45 Children in Foster Care.............................................................................................................. 45 Table 6: Orange County Children with One or More Referrals (April 1, 2003March 31, 2004)................................................................................................ 46 Existing Developmental Services in Orange County ............................................................... 46 Key Public Programs.................................................................................................... 46 Table 7: Descriptions of Key Public Programs for Children with Neurodevelopmental Problems......................................................................... 47 Child Health Disability Prevention (CHDP)................................................................. 47 California Children’s Services (CCS)........................................................................... 47 Medi-Cal/Healthy Families........................................................................................... 48 Regional Center ............................................................................................................ 48 Early Start ..................................................................................................................... 49 Mental Health................................................................................................................ 49 Special Education.......................................................................................................... 49 Department of Children and Family Services............................................................... 50 Commission-Funded Developmental Services Programs........................................................ 51 Bridges for Newborns Program .................................................................................... 51 Project Connections ...................................................................................................... 51 Family Support Network – Developmental Screenings................................................ 51 Family Support Network- Early Childhood Mental Health Outreach .......................... 52 EDAC............................................................................................................................ 52 For OC Kids.................................................................................................................. 52 COPE and CUIDAR ..................................................................................................... 53 Metabolic ...................................................................................................................... 53 HABLA......................................................................................................................... 53 School Readiness Centers........................................................................................................... 54 Preschool Nurses ......................................................................................................................... 54 National Developmental Services Best Practice Models.......................................................... 54 Denver System for Assessment and Referral: .............................................................. 54 Healthy Steps for Young Children:............................................................................... 55 Help Me Grow: ............................................................................................................. 55 San Diego C3: ............................................................................................................... 55
4
Provider Capacity for Developmental Services Provision ...................................................... 56 Physicians ..................................................................................................................... 56 Nurses ........................................................................................................................... 57 Developmental Specialists, Therapists and Mental Health Providers Serving Children 0-5 Years in Orange County, June 2004 (D Mathias, AAP Pilot projects, Commission Report) .......................................................................................................................... 57 Table 8: Ratios of Providers to Children with Neurodevelopmental Problems Ages 0-5 Years in Orange County .................................................................... 58 Capacity for Intervention Services through School Districts ................................................. 58 Developmental Surveillance and Screening.............................................................................. 59 Education and Anticipatory Guidance in Pediatric Primary Care........................................ 59 Intervention in Primary Care .................................................................................................... 60 Care Coordination ...................................................................................................................... 61 Assessment Services for Children Suspected of Neurodevelopmental Problems ................. 61 Therapy Services......................................................................................................................... 62 Data Systems and Outcome Measures ...................................................................................... 62 Themes from Interviews and Focus Group .............................................................................. 63 Coordination of Care.................................................................................................................. 65 Funding Streams/Reimbursement/Insurance .......................................................................... 65 Parent and Family Needs ........................................................................................................... 66 Role of Pediatricians and other professional groups ............................................................... 67 Developmental Screening/Surveillance..................................................................................... 67 Role of Schools............................................................................................................................. 68 Role of Child Care providers ..................................................................................................... 68 Multidisciplinary Assessment Teams........................................................................................ 68 Call Center................................................................................................................................... 69 Health Care Infrastructure........................................................................................................ 69 Results of Model Building Exercise........................................................................................... 70 Table 9: Key Barriers to Delivery of Effective Developmental Services in Orange County with Potential Solutions........................................................... 71 Gaps in Services for Children in Orange County .................................................................... 72 Conceptual Gaps ......................................................................................................... 72 Service Delivery Gaps .................................................................................................. 73 Prenatal Substance Abuse ............................................................................................. 73 Maternal Depression ..................................................................................................... 73 Children in Foster Care................................................................................................. 73 Children with Sub-Threshold Developmental Problems .............................................. 74 Children Ages 3-5 Years with Mild or Moderate Developmental Problems................ 74 Infant and Early Childhood Mental Health Issues........................................................ 74 Gaps in System Performance..................................................................................................... 75 Prevention: .................................................................................................................... 75 Early Identification: ...................................................................................................... 75 Assessment:................................................................................................................... 75 Treatment: ..................................................................................................................... 75 Gaps in Service Sector Performance......................................................................................... 75 Pediatric care:................................................................................................................ 75
5
Childcare:...................................................................................................................... 76 Specialty Care: .............................................................................................................. 76 Financial Gaps............................................................................................................................. 76 Data and Information Gaps ....................................................................................................... 77 Gaps Analyses.............................................................................................................................. 78 Conceptual Gaps: .......................................................................................................... 78 Service Delivery Gaps: ................................................................................................. 78 Financial Gaps: ............................................................................................................. 79 Data Gaps:..................................................................................................................... 79 Vision............................................................................................................................ 80 Goals............................................................................................................................................. 80 Promising Practices .................................................................................................................... 81 Financial Capacity ...................................................................................................................... 81 Data Systems................................................................................................................................ 82 Figure 7: Systematic Data Collection for Tracking School Readiness Trajectories ............................................................................................................................... 82 Discussion..................................................................................................................................... 83 Performance of Orange County Developmental Services ............................................ 83 Figure 8: Pyramid of Needs for Developmental Services ................................... 84 Gaps .............................................................................................................................................. 86 Vision............................................................................................................................................ 86 Data............................................................................................................................................... 86 Option 1: ...................................................................................................................................... 88 Option 2: ...................................................................................................................................... 88 Option 3: ...................................................................................................................................... 89 Introduction................................................................................................................................. 90 The System................................................................................................................................... 91 Figure 1: Model System of Developmental Services .......................................... 92 Components of the System:........................................................................................................ 94 First Level: Community-Based Surveillance and Supports......................................... 94 Figure 9: Developmental Services Pathway ......................................................... 94 Figure 10: Developmental Surveillance............................................................... 96 Figure 11: Secondary Screening ........................................................................... 97 Figure 12: Mid Level Assessment.............................................................................................. 98 Figure 13: Regional Center Assessment ............................................................... 99 Second Level: Secondary Screening and Surveillance.............................................. 100 Third Level: Mid-Level Developmental Assessment, Treatment and Coordination Center.......................................................................................................................... 100 Fourth Level: Regional Center.................................................................................... 100 Strategies: .................................................................................................................................. 100 Time and Phasing:....................................................................................................... 101 Sector Strategy:........................................................................................................... 101 Innovation Strategy:.................................................................................................... 102 Place-based Strategies:................................................................................................ 102 Collaborative Strategies:............................................................................................. 102 Funding Strategy: ..................................................................................................................... 103
6
Governance:............................................................................................................................... 104 Training: .................................................................................................................................... 104
7
Executive Summary Background Over the past three decades there has been an increased understanding of the importance of the early years for the future development of all children. The Institute of Medicine’s landmark report From Neurons to Neighborhoods (2000) has emphasized the importance of experiences in early childhood for the lifelong health trajectory. In 1998, California voters passed Proposition 10, the California Children and Families First Act, which provides for an excise tax on tobacco products to fund parent education, health and child care programs that promote early childhood development for 0-5s. The Orange County Children and Families Commission is responsible for allocating these revenues within the second largest county in California. It has as its focus the dual goals of healthy development and school readiness for all children, within the framework of strong families and an integrated quality service system. These goals reflect Healthy People 2010 priorities of increasing quality and years of healthy life, and reducing health disparities. Since adoption of its first Strategic Plan (2000), the Orange County First 5 Commission has shown considerable foresight in funding a number of innovative programs targeted at early identification and intervention for children with neurodevelopmental problems. These programs have been challenged by the need to interface effectively with fragmented healthcare and education systems, and by restrictive eligibility criteria for developmental assessment and intervention services. These new programs have triggered a need for improved coordination and communication between service sectors, and have prompted a review of the organizational structure in which they operate. Purpose of the Study Recognition of the need to develop a comprehensive strategic plan for a new approach to developmental services pathways in Orange County led the Orange First 5 Commission to contract with the UCLA Center for Healthier Children, Families and Communities to examine the existing system of screening, surveillance, assessment and intervention for children with developmental, behavior, and mental problems. This targeted study aimed to identify gaps in existing services, barriers to service utilization, and systems issues which currently prevent optimal service delivery. The study also aimed to develop a vision and a strategic plan for building a model system of developmental services in Orange County. Developmental Services: Challenges and Opportunities. Early childhood is increasingly understood as a time of great opportunity to optimize health and promote development. There is growing consensus that achieving the optimal development of all children will require multi-sector, multi-disciplinary, systems-building initiatives that can address the needs of individual children in the context of their families and communities. A child’s readiness for school is no longer defined around simple academics but in terms of overall physical, emotional, language, and social development during the first five years of life.
8
The emphasis on developmental optimization for all children represents a challenge for traditional developmental services which have been focused primarily on early identification and intervention for children with significant disabilities. Traditional approaches to developmental services have relied on a neuro-maturational framework in which neurological functions are regarded as being essentially “set” at birth and unfold over time. The healthcare focus has been on children’s deficits, with intermittent screening being used in an attempt to document a level of deficit that will trigger eligibility for additional services. Such assessments often focused on the child in isolation, and emphasized elicitation of his or her demonstrable abilities. A transactional model (Sameroff and Mackenzie), however, proposes that neurological, social and psychological development is a dynamic process that results from the complex interaction between the child and the care-giving environment. In this model, intermittent screening is replaced by more flexible, continuous surveillance with an emphasis on optimizing development and viewing the child in the context of his family and environment. In Orange County there is an opportunity to design a new system of developmental services which draws on the transactional model and builds on existing resources to address all aspects of child development with potential lifelong benefits for the children themselves, and extensive benefits to the wider community.
Methods Multiple local, state and national data sources were accessed to obtain a comprehensive picture of the demographics of the county’s 0-5 population, their neurodevelopmental needs, and the resources currently available to meet those needs. Existing developmental services were examined in light of current theoretical models, with an emphasis on promising practices within the county. An extensive series of interviews was undertaken with key informants, together with focus groups of parents and providers to gain an appreciation of their perception of the current system and their visions for an ideal model. A literature review was performed to analyze current theoretical frameworks of developmental services, and to identify national and international best practice models. Results Key Demographics and Health Indicators of the Orange County 0-5 population . • Orange County, with 45,000 births per year (2001), is the fifth most populous county in the nation. . • Rapid population growth of over 20% in the last decade has contributed to changing demographics with over half of the 0-5 population now Hispanic/Latino; white children are the second largest group (36%), then Asian/Pacific islander (11%). The black population is relatively small (1.4%) (OCHNA 2001). . • Over 30% children in the Orange County public schools are English language learners, and that proportion is likely to rise. . • 5.7% (15,000) of Orange County children aged 0-5 years lack healthcare
9
coverage, while 10.2% experienced a coverage gap in the last year. . • If enrolment of eligible children in MediCal, Healthy Families, California Kids and Kaiser Cares for Kids were maximized, however, less than 2,000 would remain uninsured and could potentially be covered by a specially designated county fund. School Readiness Indicators . • Teachers held maturational views regarding school readiness and strongly endorsed restrictive entrance ages and delayed entry (beyond age eligibility) for less capable children. There was strong agreement between parents and teachers that verbal communication skills were the most important criteria for kindergarten success, with ability to interact positively with others also ranking highly (ECENA 2004). . • On CHIS (2001) school readiness indicators, 74.8% of the 0-5 Orange County population was rated as in excellent or very good health (CHIS 2001). . • Over two hours of television watching daily was reported by 78.7% children 0-5, outside of current AAP recommendations. . • Only 45.1% of parents report reading to their children under 5 daily, and only 17% of children aged 3-5 attend preschool, while 30% are in childcare for over 10 hours a week and 19% are living below the poverty level. Prevalence and Patterns of Developmental, Behavioral and Mental Health Problems in Orange County . • National data suggest that 12-15% of American children have a developmental or behavioral disorder (Boyle, Decoufle and Yeargin-Allsop, 1994), while up to 30-40% of parents worry that their child has a learning, behavioral or developmental disorder (Halfon et al 2002a). . • Only 0.7% of children ages 0-3 are enrolled in Orange County’s Early Start program for children who have or are at risk of developmental delays, while Regional Center of Orange County serves 1.9% of county children in the 0-3 age range. Only 1.1% of children under the age of 5 years are receiving special education through the school district, yet in the K-12 public school system, 9.8% of children are identified as having special educational needs (compared with 10.1% for California). These data reveal a sharp contrast, with the majority of children ultimately needing special education not being identified prior to school entry, reflecting a lost opportunity for early intervention. . • Special Education teachers report that a greater number of children are referred to special education in 2nd and 3rd grade (65%) than in kindergarten and first grade (35%) (ECENA 2004). . • Identification of children who are emotionally disturbed peaks in the teenage years, as does diagnosis of specific learning disability at age 11-13 years. Evidence suggests that many of these problems could be detected years earlier, in some cases in the preschool years. . • Almost 1 in 2000 (0.18%) children 0-5 in Orange County are in foster care, while substantiated child abuse reports were made on 3,798 (1.5%) of them.
10
Key Public Programs related to Developmental Services Despite recent trends towards integrated service delivery, the current system of public programs reflects the historically fragmented nature of the system’s development. Health and educational services operate in parallel, with confusing service eligibility requirements. Statewide Programs The Child Health and Disability Prevention (CHDP) program is a preventive wellchild screening program for children with Medi-Cal (through the Early and Periodic Screening, Diagnosis and Treatment (EPSDT) Program) or up to 200% of the poverty line. California Children’s Services (CCS) authorizes and pays for specialty care relating to specified congenital defects, diseases and injuries for families reaching financial eligibility criteria. Medi-Cal, California’s Medicaid program, provides health insurance for low-income families and individuals without health insurance. It serves 59,000 (23%) children 0-5 in Orange County. Healthy Families, California’s State Children’s Health Insurance program (SCHIP) provides health benefits for children of low income families who are not MediCal eligible. It serves 16,000 (6%) children 0-5 in Orange County. Regional Center operates the Early Start program for children ages 0-3 who have or are at risk of developmental delays. Children ages 3 and above are eligible if they have cerebral palsy, epilepsy, autism, mental retardation or a similar condition. Department of Mental Health offers programs for children in the community, in foster care, and with special educational needs according to AB3632. Special Education Local Planning Areas (SELPA) ensure free appropriate public education for all children with identified disabilities. In Orange County 4,702 children ages 3-5 are enrolled in Special Education. Department of Child and Family Services (DCFS) administers child protective services in Orange County, and supervises 1065 (0.4%) children ages 0-5 in foster care. Commission-Funded Developmental Services Programs The Orange County Children and Families Commission has funded a number of programs aimed at filling identified service gaps including the Bridges for Newborns program which screens new mothers in 13 hospitals for a medical home, income and psychosocial risk factors. The program is linked with Project Connections where Public Health Nurses make home visits and perform developmental screenings for children at risk. The Family Support Network provides multidisciplinary developmental screenings at twelve sites throughout the county, reporting that 75% of children screened are referred on for services. The network also provides home visitation to Hispanic children at-risk of emotional disabilities. For OC Kids provides comprehensive assessment and management for children with suspected autism and autistic spectrum disorders. The COPE/CUIDAR program is a two-stage process where parents with concerns about their child’s attention attend a 10week community parenting education program. At the conclusion of the course, parents decide whether they need to proceed on to a full developmental assessment and treatment program. The HABLA program offers bi-weekly home visiting by a trained worker,
11
some of whom are University of California at Irvine (UCI) students to model and coach parenting techniques that will increase verbal interaction and promote child learning and expressive language. HABLA targets low-income Latino children ages 2-4 years. Each school district in Orange County has funding for School Readiness programs. Some districts have adopted a center based school readiness approach often co-located with preschool services. The Commission has also provided funding for Preschool Nurses to be placed in preschools linked with school readiness sites. The nurses are being trained to better assess development, behavior and fitness. The Commission also funds a Metabolic Program to allow for exclusion of a metabolic cause for neurodevelopmental problems. National Programs
National Best Practice Models: The Denver System for Assessment and Referral routinely screens children using the PEDS at 9 and 18 months. Children with problems are referred to a second tier central assessment team which refers children to other diagnostic and treatment services as needed. National Quality Improvement Efforts: The National Initiative on Children’s Health Care Quality (NICHQ) and the North Carolina Center for Children’s Healthcare Improvement are launching major statewide initiatives focused on improving the quality of early childhood developmental services. Using the Breakthrough Series reengineering approach to process improvement, these centers have been working with the states of Vermont and North Carolina to identify delivery problems within pediatric service delivery systems. A collaborative approach has also been used to develop, implement and test the effectiveness of solutions. Healthy Steps for Young Children (Commonwealth Fund, 1992) places a developmental specialist in the primary care practice and includes a team approach to care, home visits, periodic child development screening, a child development information line, parent groups, and linkages to community resources. The Help Me Grow program in Connecticut uses child health providers and a computerized inventory of services for developmental needs, a triage referral and case management system to help children and families access services, and educational programs for parent groups and child care providers. The San Diego C3 program has a network of 175 providers in North San Diego. The PEDS is performed in pediatricians’ offices with children scoring in a risk category being referred to a second-stage center for further screenings.
International Best Practice Models
12
There are several effective and innovative models of providing developmental services to young children that are emerging in different countries across the globe. Smart Start in England has sought to develop community based systems of assessment and referral. The Early Years project in Toronto and similar projects in Montreal and other Canadian cities are also attempting to incorporate child health and developmental services into a more seamless system. Platforms is the name of an initiative that is currently being developed in Melbourne, Australia. Platforms works on a three-pronged approach to coordinate systems for early childhood care. The first arm includes community needs assessment, resource mapping, and education of providers; the second phase uses the PEDS-plus, i.e. a modified PEDS with an additional dozen questions about psychosocial risk factors such as substance abuse and domestic violence; while the third arm is a collection of evidence-based interventions to optimize developmental outcomes. Each of these innovative approaches has element that can be incorporated into the design of more effective developmental services systems for Orange County.
Provider Capacity Orange County has 445 pediatricians and 945 family practice physicians, with a ratio of 557 children under the age of 5 per pediatrician compared with a statewide average of 599. Distribution of pediatricians is uneven, with areas such as Anaheim and Fullerton having a less than ideal ratio. There are limited numbers of pediatricians in a number of subspecialties including neurology and developmental/behavioral pediatrics. Existing Pathways in Orange County for Neurodevelopmental Surveillance, Screening, Diagnostic Assessments and Interventions . • Despite the availability of validated tools such as the PEDS and the Ages and Stages Questionnaire (ASQ), most pediatricians in Orange County continue to rely on clinical judgment to assess development. . • National data suggest that only 50% of parents have their concerns about their child’s development sufficiently addressed by providers (Bethel et al 2001b). . • Many pediatric providers lack knowledge of community-based resources and the skill to know when to refer. . • Care coordination is rarely offered and is generally sector specific. . • Options for multidisciplinary assessments are limited. Children 0-3 can be assessed by the Early Development and Assessment Program (EDAP) at CHOC or by Regional Center (RCOC) while children 3-5 receive a less comprehensive assessment through the school district. . • For children suspected of Autism, a multidisciplinary assessment is available through For OC Kids. . • Physicians report that they rarely receive correspondence from RCOC or the school district on the results of assessments. . • Children eligible for regional center (0-3) or School District Special Education (35) receive therapy services through these organizations while children not
13
eligible for these services have limited treatment options. The coverage of speech therapy and mental health services by most health plans is also very limited. Data Systems and Outcome Measures. The Commission has made a significant investment in OCERS, a state of the art data collection and tracking system to guide program implementation and evaluation. While a number of useful process measures are emerging, the full capacity of the system to measure outcomes will only be possible with additional funding from research sources and with the academic expertise at CHOC, UCI and other institutions.
Themes From Interviews and Focus Groups The first and most prominent theme featured in many interviews were difficulties in communication. This encompassed several different but related problems including difficulties with or lack of communication between parents and providers and between providers from different disciplines, organizations and institutions. Another problem that was identified was that even when providers discussed development and developmental services with other providers, they were often using different conceptual models of development and had different notions of what constituted developmental assessment and of how a service system should optimally function. The communication challenges appear to be particularly salient across sectors—early education to pediatrics and vice versa. Communication across different cultures was especially difficult and the issue of cultural competency was another closely linked theme. Many families being served have little or no English skills; yet services and information sources did not always address this need. To many families, many services, particularly those located in large institutions, lacked awareness of the perceptions and values of different cultures. Most interviewees saw a great need for improved care coordination, and a desire was expressed for the county to develop an effective way of disseminating information about services. A particular need for good care coordination at times of transition (e.g. discharge from neonatal unit or entry into school) emerged as an important sub theme of care coordination, as especially good communication and integration of services are needed at this time. Most interviewees felt that funding streams were complex, fragmented and inadequate to address the existent needs, and that lack of provider reimbursement for developmental services was a major barrier to the provision of an effective system. Parent and family needs were only partly addressed in the current system, with providers feeling that parents needed education and empowerment to advocate for services for their children. Pediatricians were regarded as lacking in knowledge about child development and indeed were often viewed as a barrier to effective surveillance. Most practitioners were not using any formal tools for developmental screening/ surveillance. For children receiving services through the school district, the relationship between parents and schools was often regarded as adversarial, with school-based resources appearing inadequate to meet needs. Many interviewees felt that childcare providers could play a more active role in developmental surveillance given their prolonged contact with children ages 0-5, but there were doubts of whether pediatricians would act on the results of such surveillance.
14
Interviewees were generally positive about the concept of multidisciplinary assessment teams for children with neurodevelopmental problems but doubted the feasibility of sustaining funding of this type of approach, and anticipated transport difficulties for parents. The concept of a call center where parents or professionals could call for advice about navigating the system and available resources met with almost universal enthusiasm, provided calls could be answered by a well-trained staff member. Healthcare infrastructure issues were identified with need for a closer collaboration between CHOC and UCI and a need for strong academic leadership in child development. In a model-building exercise where interviewees were asked to conceptualize how developmental services are organized, almost all interviewees placed themselves or their own organization at the center of the chart. A number of interviewees had not conceptualized how an entire system might operate and interconnect prior to this exercise.
Gaps in Current Services . • Children with prenatal substance exposure (7.5% of Orange County births), children of mothers who are depressed, and children in foster care often fail to receive developmental services. . • Children who fail developmental screening tests but who pass diagnostic tests are generally ineligible for services, yet they continue to perform lower as a group on intelligence and achievement tests (Glascoe 2001). . • Although Early Start provides services for children in the 0-2 range who are at-risk of developmental delays, once those children reach the age of three years they transition out of services and are ineligible for other publicly funded programs. Often these children do not receive services again until kindergarten entry. . • Few practitioners are equipped to identify infant mental health problems, or mother-infant interactional problems and there are limited referral resources to manage these issues. . • There is insufficient funding for preventive services, especially in mental health. • Childcare providers and preschools could play a greater role in developmental surveillance but lack tools and connectivity to other services.
15
Strategic Analysis A strategic analysis was performed to determine the nature of potential gaps in the conceptual approach, the stated mission, organizational capacity, financial capacity and commitments, and available leadership for a proposed model system. Conceptual Gaps The finding of large conceptual gaps among providers related to underlying differences in belief systems about the role of developmental services. Providers grounded in a traditional medical model tend to focus efforts on determining physical causes and genetic predispositions while providers more oriented to a developmental model place more emphasis on socio-emotional factors, family functioning and parent-child interaction factors that contribute to the child’s developmental and behavioral functioning. Service Organization Gaps Service delivery gaps also relate in part to differing conceptualizations of the causes of developmental and behavioral problems. In order to receive services a diagnostic label must first be applied. This situation works for children with easily recognized conditions such as Down Syndrome, but presents a problem for those children who have significant difficulties yet do not “fit” a diagnostic category. Little work has been done on low-cost community interventions such as parent education and parent-child intervention groups which fall short of a traditional therapy approach yet could still meet the needs of many children and families for enhanced services. Financial Gaps While financial gaps remain formidable, much work could be done to better educate providers within and across sectors about existing funding streams and how they work. The use of non-traditional funding sources such as local businesses and corporations also needs to be explored. Similarly, providers could be better informed about existing data on developmental services, while the joint interest of the Commission and grantees to develop a more extensive and outcomes-oriented evaluation should drive efforts to supplement commission funds with research grants. Mission and Focus A number of individuals and groups within the county have strong visions for how developmental services should be organized and delivered in the future. However, these visions often differ and may not be converging on a common vision that all can embrace. Increased communication, discussion and understanding of different assumptions and beliefs between groups is needed in order to move towards a common and shared vision. While stakeholders across different service sectors articulate different goals for a new system, there is much common ground. For example, all would agree that optimizing the developmental trajectories for all children is an important goal that should drive the organization of developmental services. Also, most stakeholders agree that intermittent assessment of development throughout childhood is warranted. Yet, providers differ on whether less trained workers such as WIC staff and childcare providers could play a larger role in surveillance. The role of validated tools such as the PEDS or the ASQ has yet to be agreed on. Each service sector needs to develop sector-specific goals, while 16
place-based goals will need to reflect both the needs of cultural groups and local resources. Leadership Orange County has a distinguished array of strong leaders across different service sectors. Great changes within sectors could result from the input of leaders from other sectors e.g. pediatricians could contribute significantly to the training and best practices of childcare providers while pediatricians would benefit from the enormous knowledge of local resources which resides with the public health nurses. Discussion & Options Considering the findings of this targeted study in relation to the Commission’s stated goals of healthy development and school readiness for all children, it is clear that the county’s current developmental services are not producing desired results. National and county data confirm that a large proportion of children with mild and moderate developmental problems are not being identified until after school entry, so clearly are not entering school with their challenges already identified and addressed. Even when children are identified as having difficulties, they are often ineligible for therapy services until after they enter the school system and fail to learn. Children identified as at-risk for developmental problems who receive services though Early Start then drop out of services when they reach age three, leaving them at risk of later school failure. In short a great many children with substantial developmental challenges are not having their needs addressed. This study has focused on an analysis of the healthcare system and how it is performing in regard to developmental services. Our analysis of the educational and social services systems has been less detailed, and a more in-depth analysis of how these systems function in relation to developmental services would be beneficial. The study findings reveal a “pyramid of need” for developmental services within the 0-5 population, (see Fig 1), with 100% of the population requiring ongoing developmental surveillance, up to 40% requiring some form of secondary screening or assessment, 1020% requiring a fuller multidisciplinary form of assessment, and only 4-6% requiring the fullest level of assessment and ongoing longer-term therapy. The current developmental services system in the county is focused on identifying and serving the top tier, while the needs of those in the lower tiers are not well addressed. Orange County now has a number of options. One option would be to continue to fund discrete programs such as CUIDAR, HABLA and For OC Kids and to let them evolve over time, forming connections in the process of their growth and evolution. A second option would be to continue several of the existing programs and to choose either a geographic area of the county or a specific service sector and target either a place-based or a county-wide sector-specific initiative e.g. ensuring that all pediatric offices in an area become medical homes delivering high quality developmental services. We propose that Orange County consider a third, more ambitious, comprehensive and integrated approach to creating a developmental services system. This system would, by definition, utilize an integrated, multi-disciplinary and multi-sector approach, in keeping with the First 5 mission to create a sustainable capacity to provide services to ensure 17
healthy development and school readiness and, with national initiatives such as the sate Early Childhood Comprehensive Systems (SECCS) initiative to create early childhood systems linking health, education, parenting and other developmental services together.
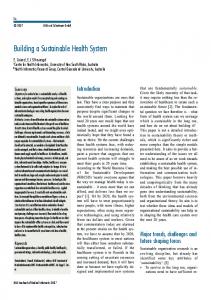
Proposal for Model Developmental Services System for Orange County In response to the demonstrated hierarchy of need for developmental services within the 0-5 population in Orange County, we propose a four-level strategy which we believe is most responsive to this need (Fig 2). While focusing on the needs of children and parents, the model also addresses the needs of childcare, education and healthcare providers, and other professionals who work with this population.
Assessment Phase
Screening Phase Surveillanc e Phase
Regional Center
Assessment Center
Pediatric Office
Child Care WIC School Readiness
Coordination & Case Management
Figure 1: Model System of Developmental Services Components of the System: First Level: Community-Based Developmental Surveillance and Supports An effective system of developmental services requires population-wide support for optimal development, as well as a flexible, continuous surveillance system that can identify children who have specific developmental problems or who are at risk for developing these problems. Second Level: Secondary Screening and Surveillance National estimates suggest that 40% families will have additional concerns about their child’s development or behavior. Pediatricians are in a good position to provide second18
tier services for children identified as at-risk or as having developmental problems by the community-based surveillance system. Some offices, such as those in the Healthy Steps model, have achieved this by stationing a developmental specialist in the provider’s office. A complementary strategy would target systematic upgrading of the quality of the provision of developmental services in pediatric practices through additional training of pediatric providers to use the latest tools and techniques and the introduction and adoption of practice re-engineering strategies designed to improve overall practice performance of developmental services. Third Level: Mid-Level Developmental Assessment, Treatment and Coordination Center It is this level of assessment which is currently most lacking in the Orange County system. More than one center will be needed and at least one should have capacity to perform mobile assessments, traveling to parts of the county where transportation issues preclude client attendance at one of the centers. These centers could be co-located with existing Commission programs such as EDAP, For OC Kids, COPE/CUIDAR at School Readiness Sites, or could be located in separate facilities. The sites could also have capacity for the delivery of low-cost interventions such as parent education groups, Mommy and Me classes, language stimulation groups, and parent training classes on redirecting children’s behavior and fostering longer attention spans. Some of the most challenging aspects of providing developmental services could be addressed through a dedicated care coordination unit that might include a call center and a web-based resource list associated with these mid-level centers, modeled after the Connecticut Help Me Grow program. The success of the Connecticut model and the importance of overcoming difficulties in linking and coordinating services that make up a functional delivery pathways makes this a high priority strategy. Fourth Level: Regional Center Regional Center will continue to determine eligibility for and deliver IDEA Part C Services. While the proposed system changes should result in earlier identification of children needing services, the referrals to regional center should be much more appropriate given the increased system capacity for detection and management of more minor developmental problems, which should prevent flooding of this service Strategies: In order to be responsive to parents, child care and pediatric providers, and communities, we suggest a set of strategies to create, roll out, and implement the system. Time and Phasing: Since it will take at least 5 years to get this new system fully operational, a timing and phasing strategy is important. To facilitate this phase-in process we recommend that the commission develop specific strategic and business plans for each tier of the system and the specific sectors (i.e. pediatric/child health, early education, childcare) involved.
19
Sector Strategy: Because of the level of service delivery change and the introduction of important innovations, it will be important for peer-to-peer training, quality improvements, and funding to develop sector-specific strategies. Sectors include pediatric health care, child care and early education centers, and school readiness sites. Since each of these distinct service delivery sectors has a different culture, vocabulary, services, and funding, sectorspecific strategies will be necessary in order to drive the re-engineering that is essential to move each sector forward and to accomplish the goals and objectives of the overall system delivery. Since current financing options tend to be somewhat sector specific (health care uses Medi-Cal and Healthy Families, EPSDT and CHDP while developmental disabilities uses CCS and IDEA funding), it will be necessary to develop finance strategies that are sustainable within each sector. Innovation Strategy: Much of the work to enhance developmental services across the country has focused on the introduction of a number of innovations into traditional practice and service sectors. CUIDAR and HABLAR are two notable examples of Orange County based innovations that could have national applications and impacts. This spirit of innovation, evaluation, and spread should be supported and extended, with the Orange County First 5 Commission bringing in other supporters to provide venture capital for these efforts.
Place-based Strategies: Since different communities in Orange County have different existing capacities and levels of need, we recommend that specific place based strategies be developed for specific communities. Whether the initial sites are cities, smaller communities or neighborhoods, it will be important to fully construct the developmental services pathway in a few localities so that implementation and feasibility issues can be addressed before attempting to implement county wide. This way the First 5 Commission can also help develop community-level and city-level leadership to support all components of the system within their respective realms. Collaborative Strategies: Each of these strategies lends itself to the development of collaborative learning and rapid re-engineering strategies. From our standpoint, this ability to initiate collaborations within sectors and across communities has the highest likelihood of successfully reengineering services into the kinds of systems and pathways that are necessary to achieve the goals of this initiative. It is important that the members of the collaborative articulate a common vision, agree on a set of common goals, and define a series of measurable outcomes which can be tracked to assess the effectiveness of the new approach. Financing: Funding will need to be made available for the process of system creation and redesign. A large proportion of the services being proposed are potentially fundable under the current federal Medicaid and EPSDT guidelines. The Commission should also consider 20
how it will build in funding for needs assessment, evaluation and capacity building to support this initiative. Strategies might include an endowed research matching fund initially created by the Commission but matched with dollars raised by CHOC and UCI from the Orange County corporate sector. In addition, the Commission could consider how it might leverage its monies within those institutions to initiate endowed professorships that would attract additional world-class faculty, and to enhance research capacity to leverage additional dollars from the National Institutes of Health and other related funding organizations. Governance: Development of the new system will require a governance structure which is both strategic and responsive to the needs of the Commission and the Orange County Community. We would suggest that a steering committee comprised of key stakeholders be established together with a subcommittee structure to address the development of innovative programs; sector-specific strategies including pediatric, child care and school readiness sectors; and place-based system development, infrastructure and financing. The significant multidisciplinary training and education needs might be best accomplished through development of a training consortium including UCI, CHOC, Cal State Fullerton and other institutions. Both feasibility and sustainability will need to be considered in a more detailed strategic and business plan where both cost and potential revenue can be more fully assessed. Phase 1 Implementation Outline: Given the necessity for a staged phase-in of the model system, we propose the following next steps to initiate the process during the initial 1-2 years. 1. Place-based Strategy: All four service levels of the model-community surveillance, secondary screening, assessment and intervention should be established in two communities in Orange County, creating an opportunity for inter-community collaboration on a small scale. This process will involve training of all the relevant providers in those two areas – pediatric healthcare providers, teachers, childcare workers, preschool staff, WIC staff and all who are in regular contact with young children 0-5. Providers will need to come together and explore new ways of working together to ensure an efficient comprehensive approach to developmental services.
2. Sector-based Strategy: At the same time as the place-based strategy is initiated in two communities, a series of sector-specific strategies will be implemented. For pediatric practices the initial focus will be on the implementation of developmental surveillance activities using a validated tool, the PEDS. A series of pilot sites will be chosen by the Commission and the AAP to pilot this initiative. This process lends itself to a collaborative learning strategy such as use of the Breakthrough series to re-engineer practices and ensure the smooth incorporation of the PEDS as a developmental surveillance tool into office practice. Continuous “Plan, Do, Study, Act” Cycles will be used to inform office practice change and achieve developmental services aims. This process will be evaluated to document levels of developmental surveillance achieved. 21
Following use of “Breakthrough Series” type of activity, it is envisaged that best practices will spread to other pediatric providers in the county so that the momentum of the new initiative is maintained. Other interventions may also be considered within the pediatric office, including more widespread use and greater penetration of Reach Out And Read, or potentially using elements of Healthy Steps to augment the productivity of large group practices or clinics.
3. Establishment of Mid-Level Assessment Center: A planning process will begin, led by the CHOC-UCI Collaborative, for the development of a mid-level assessment center in the county focused on delivering assessment services to children with developmental and behavioral problems which fall short of eligibility criteria for regional center. The location of the center should be decided in collaboration with the geographic focus of the place-based strategy. Financing and sustainability of the center will be key issues and a sound fiscal plan using multiple potential funding sources will be created. As the center develops it is envisaged that it will offer low-cost interventions for common childhood developmental issues, while developing its role as a community resource for education on child development. 4. Establish a Care Coordination Program: Care coordination could be provided through a call-center similar to the center that is operated by Help Me Grow in Connecticut. This call center would provide a resource for community based surveillance sites that are attempting to create better connections with pediatric providers and other service providers. The call center/coordination program would also play an essential role in linking pediatric providers with the mid-level assessment center, and to other resources for children identified as needing other community based services and referrals. Using a range of new technology, the call center/coordination program could also provide web based resources to parents, community child care and school readiness partners, pediatricians, and other early childhood developmental service providers. 5. Develop a Short and Long Term Funding Strategy: Developing a funding strategy will be essential for the success of the program. All available federal, state and local funding sources will need to be explored to ensure the viability and sustainability of each component of the system and the system as a whole. A range of local, state and federal funding strategies should be considered that could provide funding during different phases of implementation, and to cover costs associated with services, evaluation, and infrastructure development. Where needed services lack a currently identifiable funding source, alternatives in the Orange County community will be sought, e.g. donations from private foundations, individuals and corporations.
Summary Orange County has built a series of promising and innovative programs in the developmental services arena. Impressive degrees of multi-disciplinary collaboration are emerging. While the challenges are formidable, the combination of effective and strong leadership within key sectors; a willingness to collaborate and to look at existing systems in new ways; and the tremendous progress that has been made in recent years within the 22
CHOC-UCI collaborative place the county in an excellent position to move forward with implementation of the new system. The Commission needs to play a leadership role in developing a strong financial underpinning for this endeavor. The Orange County Model proposed in this report has great potential for true innovation in the field of developmental services. Both implementation and evaluation of the new model will be of national and international interest.
23
Introduction Purpose and Outline This report summarizes the findings of the UCLA Center for Healthier Children, Families and Communities targeted study on developmental services pathways in Orange County. The study was performed April-July 2004 at the request of the Children and Families Commission. The purpose of the study was to examine the existing system of screening, surveillance, assessment and intervention for children with neurodevelopmental needs in the County. The primary aims of the study were to identify gaps in existing services, barriers to service utilization, and other systems issues that currently hinder optimal service delivery. We begin by discussing the importance of developmental services for children’s development and the need for an integrated service system to deliver them. Following the introduction, we report on the methods for the study and then give an overview of the Orange County Commission’s achievements to date in the provision of innovative new programs. We discuss the findings in the light of the Commission’s stated goals of healthy development and school readiness for all children 0-5 years with an analysis of the challenges and opportunities now facing the Commission. Finally, we present a series of options for the Commission to consider for next steps, followed by our proposal for a model system of developmental services in Orange County. The Importance of Developmental Services Early childhood is increasingly understood as a time of great opportunity for optimizing the health and development of children. Scientific evidence has documented how experiences during early childhood, shaped by families and communities, influence future healthy development and learning. One of the more important advancements in our understanding of human health is that healthy development is a complex interaction between biological and social factors operating across the lifespan. Another conceptual advancement has been our understanding that learning begins at birth, and that all experience, both positive and negative, plays some role in shaping the developing brain thus influencing future physical, cognitive, and emotional development. These conceptual advancements emphasize that the development of children’s health and learning are related and that both can be optimized by the provision of appropriate health services, early education, mental health care, and family support services. The landmark 2000 Institute of Medicine (IOM) report, Neurons to Neighborhoods (N2N), synthesizes a growing body of research from the neurosciences, child development and education, and presents a series of recommendations to assure that all children have the opportunity to realize their potential. To optimize the development of all children, certain inputs are not optional but are required including: • • •
Structured, dependable, nurturing relationships with parents and other caregivers; Families with adequate resources to provide safe, nurturing, healthy, and educationally supportive environments; Health care, developmental, and education services that help parents promote the optimal development of their children, and identify and mitigate potential risks and problems at the earliest and most effective possible juncture. 24
The Individuals with Disabilities and Education Act (IDEA), Part B of PL94–142 and Part C of PL105-17 provides special education services for children ages 3 to 21 years and early intervention services for infants and toddlers to age 3 years, respectively. The legislation mandates the identification of children with learning-related problems, evaluation of their health and developmental status, development of a plan to provide needed services including educational and related services, and guaranteed due process. These services have been the major focus of developmental services for the past 15 years with all identification and intervention efforts targeting children with disabilities. Recent trends have focused attention on the need to deliver a broader variety of developmentally oriented services to children during the first 5 years of life. For example, there is an increasing focus on the provision of developmental services promoting optimal development through health care, which is supported and encouraged by the American Academy of Pediatrics and the Maternal and Child Health Bureau, and emphasized in health supervision guidelines. There is also a growing body of research supporting the efficacy of these services (Regalado & Halfon, 2001). Mental health for infants, toddlers, and preschool children is expanding with an array of preventive and therapeutic services provided through a variety of models (Zeanah et al, 2004). Evidence also suggests that high quality child care and preschool are important in providing optimal developmental experiences for children. These advancements in health and mental health care expertise and early childhood educational services lay the groundwork for creating coordinated and integrated service systems to optimize children’s early development and readiness for school. Need for a More Systematic Approach As a result of the increasing consensus about the importance of early childhood and the efficacy of a variety of activities that can be delivered in health care and other service sectors, there is growing momentum across communities, states, and nations to seize upon opportunities to utilize new approaches to enhance early childhood outcomes. Beginning in the early 1990’s, at the outset of what has been called “the decade of the brain” the U.S. Department of Health and Human Services launched Healthy and Ready to Learn in 1992, an ambitious new initiative that linked healthy development and academic achievement. Many initiatives garnered new support; leading to the expansions of Head Start, the launch of Early Head Start, the creation of Healthy Child Care America and many other complementary programs. Enthusiasm has been generated by major international, national, and state level initiatives tied to resources and creative methods that promote health and well-being of young children. In England, Canada, and Australia, for example, major initiatives have been launched to enhance the quality of prevention and intervention services in early childhood. There is also a growing convergence in beliefs that the means to achieve the optimal development of all children will require multi-sector, multidisciplinary, systems-building initiatives that can address the needs of individual children as well as the context of their families and communities. The MCHB State Early Childhood Comprehensive Systems (SECCS) initiative, for example, is designed to plan for and build a more comprehensive and integrated system among the current uneven, and often ineffective, mix of services for children. Several state and national initiatives have taken up this charge and are 25
moving this agenda forward. In England, the national Sure Start program has already created 400 of the more than 2000 neighborhood based, multidisciplinary early childhood service systems. Since the responsibility for child and family services that influence early health and development is divided across multiple health, education, and social service sectors and programs, a more coordinated approach is necessary if early childhood services are to be delivered in an effective, efficient, and accessible manner. In order to help different service providers from different sectors converge around a set of common goals there needs to be some agreement about a shared set of outcomes, and language to capture the results that all sectors and services are trying to achieve. To bring the health sector and education sector together it has been necessary to link the goals of child health care that focus on healthy development with the goals of early learning that focus on school readiness. National Education Goals Panel (NEGP, 2001) redefined and re-framed the concept of “school readiness” to include schools being ready for children, families and community supporting the transition to school, and children being ready to attend school. As part of that definition a child’s readiness for school was no longer defined around simply academics- but in terms of their overall physical, emotional, cognitive, language and social development during the first 5 years of life. This reframing of school readiness by the educational sector created a new bridging construct that immediately became inclusive of many of the goals that have preoccupied the health sector and powerfully communicated the importance of optimizing their health and wellbeing within a family and community context. As multiple sectors that provide services to guarantee and enhance the health, development and school readiness of all children become more unified in vision and purpose, there is an opportunity to improve the delivery of health and other services, and to integrate these services into more responsive and effective systems of early childhood care. Challenges and Opportunities While there is a concerted effort toward optimizing early childhood services on a wide scale, there are also enormous challenges facing us. Some are relatively straightforward to manage, such as the selection of validated assessment instruments to use in the early identification of children who might benefit from early intervention services or special education. Others require a more systematic and comprehensive approach such as the implementation of those instruments within a comprehensive system of care that is effective, efficient, accessible, capable, and acceptable. There are significant challenges unique to governance at state and national policy levels such as understanding the importance of developmental services in health care, and how they should be promoted and paid for. There are inter-disciplinary challenges that emerge as people move toward integrated coordinated service delivery pathways and multidisciplinary approaches with gaps between health and education sectors at federal, state, or local levels. Conceptual Challenges and Gaps Perhaps the most important challenges to confront are conceptual. Conceptual frameworks provide the theoretical and pragmatic basis for all aspects of system development. There are dissimilarities between service sectors in theoretical and conceptual models that contribute to the problems such as lacking a shared vision, communication across disciplines and service sectors, and, therefore, absence of effective collaboration. For example, the major theoretical framework underlying medical 26
approaches is a neuromaturational framework. Neuromaturational theories portray child development as an unfolding of neurological functions in a predictable pattern and time course. A certain percentage of children are born with developmental disabilities that present as deviations from the expected pattern. The neuromaturational framework has led to a focus in health care on children’s deficits and on efforts to document a level of deficits that trigger eligibility and service provision. Deficits are, therefore, defined by science and by available funding. The major limitations of neuromaturational models are that they have not been predictive of developmental outcomes (Sameroff and Mackenzie, 2003) and, because they do not account for the way that development is shaped by the environment, they are not useful in informing early intervention approaches or efforts to optimize all children’s development. On the other hand, systems theorists have emphasized the importance of geneenvironment transactions over time with less of an emphasis on the biological determinism characteristic of a neuromaturational perspective. Systems theories utilizing transactional models have received much emphasis in the social sciences, developmental psychology, and have driven much of the progress and innovation in the early intervention field, but have not impacted medical practice to any significant degree. A transactional model (Sameroff and Mackenzie, 2003) proposes that neurological, social, and psychological development is a dynamic process that results from the complex interaction between child and the caregiving environment. The focus in this model is on how child and parent (caregiving environment) adapt to each other as developmental change proceeds. This is consistent with the view that the developing brain is capable of being modified by both beneficial and deleterious experiences that can have lasting effects on the child depending upon the nature of the adaptation made (Figure 2).
27
Figure 2: Transactional Model
Parent
Child
Expectation for Unrewarding Relationships
Normal Infant
Confirmation of Negative Expectations
Negative effect
Family Story of Bad Child
Negative Behavior
Coercive Behavior
Confirmation of Unrewarding Relationships
Aggressive Preschooler
This has at least three important implications for early intervention. First, it underscores the major role of the family and social-emotional context in which children are raised meaning that supports for parents, particularly with child rearing responsibilities, are crucial. These supports hold for all children with or without biological or sociodemographic risks. For example, while it is widely accepted that poor nutrition, environmental toxins, drug exposure and chronic stress can harm the child’s developing brain, there is also substantial evidence to suggest that supportive, responsive caregiving can mitigate many of the adverse effects of biological risks. On the other hand, significant parental health and psychosocial problems such as maternal depression, substance abuse and family violence place heavy developmental burdens on young children with or without biological risks (Nelson, 2001; Shonkoff and Phillips, 2000). The importance of a transactional model has become even clearer as we’ve learned how a child’s psychological and neurobehavioral development is closely linked to the quality of their health. For example, parents spend a substantial percentage of their efforts fostering good sleep hygiene during infancy. Since the quality of sleep affects physical growth and the regulation of mood, alertness, and executive functions during wakefulness, helping parents foster adaptive sleep habits can prevent the deleterious effects of sleep disturbances on infants and young children which can be wide ranging to include growth, cognitive, and socioemotional disturbances (Dahl, 1996). Other studies demonstrate that helping parents to establish harmonious relationships with their children is important to their health and psychological development. Extreme cases of child abuse and neglect, of course, can lead to growth failure or physical injury. Far short of this, however, are studies suggesting that parenting style and the quality of attachment are linked to a child’s ability to manage stress (Gunnar, 1998) and to the development of asthma (Klinnert et al, 2001). Furthermore, it can be inferred that the quality of the parent-child relationship at least indirectly influences psychobiological responses to stress that affect immune function in children (Boyce et al, 1995). As more is learned about the role of early experience on health development, the potential for the early childhood service providers to reduce these types of risk and adverse exposure by promoting emotionally and cognitively stimulating parenting activities will continue to increase. Secondly, tied to the neuro-maturational model was a notion that the role of clinical assessment was to identify children who had failed to achieve a specific level of function. 28
While somewhat arbitrary clinical assessments and the surveillance and screening systems that are utilized to triage children into an appropriate clinical assessment are based on defining and determining specific developmental deficits – often defined by psychometric properties of particular instrument and where the second standard deviation on a particular functional variable happened to fall in the normative population. While useful for defining the lower end of the functional scale such an approach does not provide information about those children who are not failing but are not achieving their full developmental potential. Often children who did not fail, or fall below the threshold are said to be “good enough”. Unfortunately many if not most parents are not interested in knowing that their child is functioning at a “good enough” level, but approach their parenting responsibilities with the hope of optimizing their child’s developmental function. Parenting based on optimizing a child’s development is often not well served by screening and assessment that merely provides information about whether a child is failing. The transactional models provide the basis for considering how to shift from a deficit model of child development to consider how parents and communities can enhance the availability of developmental assets in order to serve to optimize how children develop. Third, the dynamic nature of developmental change in both child and environment underscores the futility of traditional population screening approaches for developmental problems. These approaches have been characterized by tools that are modestly accurate (at present), very inaccurate (e.g., the Denver tests), or that have poor validation. Although newer psychosocial screening tools are available, screening efforts are still essentially child-focused, neglecting the needs of parents and families whose efforts to support their child’s development is crucial. Screening approaches have seldom addressed environmental factors that influence development. Without accounting for the resources and capacities that parents bring to the child rearing equation it is difficult to assess the true nature of developmental risk or the likelihood that a child facing an number of developmental hurdles will prevail Screening has not historically accounted for developmental change over time. A single effort to screen is typical. Although there are models for monitoring development at predictable developmental transitions (Brazelton), this is not the current standard of care (Schor, 2004). Reconciling these two different perspectives is a critical issue in bridging the service gap between health care and other community services. As we move forward, we must recognize the strengths and weaknesses of the neuromaturational model and broaden the scope and increase the flexibility of services in a manner that captures the transactional nature of development as well. As the foregoing discussion illustrates, the potential impact of developmental services is profound and far-reaching. The proposed Orange County Developmental Services Initiative is poised to take advantage of these new and emerging conceptual breakthroughs, and create a service delivery system that can be maximally responsive to the rapidly evolving clinical science of child development. This will not be without its challenges given the number of individuals and institutions that have grown up and out of an older and probably less useful approach.
29
Service System Barriers and Challenges Child Health Providers Child health providers are in a unique position to assess, identify and intervene on developmental issues, problems and risks. Pediatricians provide 80% of the primary care to children zero to five, and pediatric practice guidelines as well as federal and most manage care contracts provide for children to receive nine well child visits during the first 5 years of life. Pediatric practice guidelines also suggest that all children have their development evaluated at each of these visits. Several recent studies have suggested that content and the quality of developmental services provided by child health providers is not what it should be. In one recent national survey only 57% of parents reported that their child had ever received a developmental assessment in the first three years of life. The same survey demonstrated that children who did not receive developmental assessments were also less like to receive appropriated guidance on developmental issues related to early literacy, discipline, social skills and other topics. In a recent survey conducted by the American Academy of Pediatrics, pediatric providers reported that they face a number of barriers in providing developmental services including constraints on time, reimbursement, inadequate training, as well as having few places to refer children and families if problems were discovered and required additional assessment or treatment. Workforce Training The foregoing discussion of conceptual challenges brings into focus the deficiencies of the current workforce. In health care, for example, the conceptual and service models have not changed in almost a century. The training of physicians places very little emphasis on knowledge and skills in clinical child development. Physicians spend one month learning child development, which amounts to less than a third of what would be spent in an introductory undergraduate course. The primary care training experience is limited by faculty that typically lack expertise in child development and by service models that do not represent the realities of private practice with respect to managing high patient volumes, developing collaborative relationships with other service providers, use of effective services, or use of appropriate coding and billing practices. Although many primary care developmental services have demonstrated efficacy (Regalado & Halfon, 2001), they are unlikely to be effective when employed with the current system infrastructure. Likewise, there is limited expertise in typical child development within other disciplines. Educators, social workers, psychiatrists, speech therapists, physical and occupational therapists, family counselors, and nurses receive limited if any child development training and most receive no clinical experience with typically developing children. Training is frequently limited to children with clinical disorders and to a narrowly focused aspect of child development relevant to one’s specialty area. There are few multidisciplinary training programs thereby limiting opportunities to practice collaborative care. These service models are also highly influenced by neuromaturational and disease model philosophies, which limit their effectiveness for the vast majority of children without clinical disorders, but who may have risks requiring primarily preventive services. In other words, prevention and promotion of optimal development 30
are not the focus of most clinical disciplines that treat children. Therefore, the current system of care almost completely lacks a preventive workforce. Furthermore, there is an inherent danger in pathologizing normal development and behavior by simply transposing a disease-oriented workforce into preventive service, especially in the current climate where there are unrealistic expectations about the newer screening tests. Service fragmentation Much emphasis has been placed upon the challenges of navigating the dysfunctional and highly fragmented service system that exists to implement IDEA. Pediatricians have emphasized this careened for care coordination as part of the medical home concept (AAP Medical Home Statement). Certain conditions may make it difficult for different service providers and agencies to collaborate around the care of children in the current system. Diagnostic and treatment services are given by different providers, and even by different systems, which may be administered and funded separately through schools and public health, mental health, and social service systems. In spite of such barriers, communities throughout the country have made connections between providers and community resources by developing case management and coordination systems, described below. Financial Barriers and Challenges There are coverage, reimbursement, and billing issues that also form barriers to developmental care. These include the lack of adequate reimbursement under existing managed care and capitation contracts for developmental health services and the assumption by most payers that developmental health services are simply part of preventive well-child care. Resolving this issue requires reviewing managed care contracts and making appropriate adjustments (George Washington University Medical Center, 2000). A provider’s lack of familiarity with appropriate billing codes may also constitute a barrier (Rushton et al., 2002). Several states, however, have implemented more appropriate reimbursement mechanisms and many individual practices and groups have educated providers about billing codes to optimize reimbursement. A systematic approach for instituting payment is necessary to ensure widespread and long-term solutions to billing problems. Data System Barriers and Challenges Accountability data Developmental services are often undervalued by accountability systems. Accountability systems that use quality measurement tools, such as the Consumer Assessment of Health Plans Survey (CAHPS) and the Health Plan Employer Data and Information Set (HEDIS) measurement system, do not measure the content and quality of developmental services or whether a developmental assessment was even given. Incorporating measures of developmental services into existing instrument sets could redress this problem. Orange County Challenges and Opportunities The existence of Proposition 10 Funding has placed California in an exciting position regarding early childhood services. Designed to address the prior lack of public funding and support for early child development, this new funding stream provides flexible-use 31
dollars to enhance healthy development and school readiness for all children. This has led to opportunities for funding innovative approaches to achieve these important goals. With this opportunity, however, has come challenge. The multiple and obvious gaps in current early childhood systems have led to demands that these monies be used promptly to fund additional services. There are problems with this approach in that added services alone will not solve the performance problems of the entire system – this will require alternative strategies at a level beyond service delivery. In addition, the longevity of Proposition 10 as a funding stream is uncertain, making services funded entirely or predominantly from this source particularly vulnerable. The Orange County Commission has shown great foresight in its decision to analyze its existing system of developmental services, and, rather than continue to fund additional client-based services in a piecemeal fashion, to consider utilizing a portion of its funding to address long-standing system issues which must be tackled if the Commission’s goals are to be met. The timing for this initiative is optimal, as both health and education sectors are re-considering their approaches to early developmental monitoring, and are beginning efforts to develop a common language around child development and to make their services more family-centered and relevant to child function. Pediatric healthcare services are transitioning from a system of intermittent developmental screening to one of continuous developmental surveillance and there is a national call for a re-engineering of primary care services to better address children’s developmental needs. The programs already funded by the Commission such as Bridges for Newborns, Project Connections COPE/CUIDAR, For OC Kids, HABLA, School Readiness Centers, Preschool Nurses and others have led to innovations in the child development field and laid the groundwork for a comprehensive new approach. In addition, the implementation of these programs has already led to cross-discipline communication and collaboration on a small scale which will need to be repeated over the whole county. As these new programs have arisen to fill needed gaps in services, consequently the organizational structure in which the programs operate must itself grow and mature. There will be pressure to begin changes immediately and to expect results early. Neither of these goals is realistic given the extensive and multi-sector nature of the changes envisaged. Changes to the system will need to be preceded by development of detailed strategic and business plans, with a staged implementation over a multi-year timeline. Strong leadership will be needed to navigate a new approach. Evaluation of any new approach is vital, not only to inform adjustments to the model, but also to disseminate results to the national and international research communities. Although change is challenging, the potential benefits to the community are substantial. If every child with a neurodevelopmental problem is identified early, if effective interventions are implemented promptly and if every child, to the best of his or her potential, enters school healthy and ready to learn, then tremendous benefits to society will ensue. Cost savings could be expected not only in the health sector but also in spending on special education, and in the juvenile justice system. The Commission now stands in an optimal position to begin leveraging its funding as it embarks on a new system which will be of national and international significance.
32
Methods Study Approach We set out to obtain a comprehensive picture of the need for and the structure, process and current outcomes of developmental services in Orange County. First, we wanted to understand the population of children that the system is trying to serve, so we undertook an analysis of the demographics of the 0-5 population with regard to population size and growth trends, race, ethnicity, family and socio-economic factors. Second, we wanted to determine the needs of that population for developmental services to support healthy development, early learning and school readiness. We recognized that data in this area are very incomplete and that much further work is required. We tried to determine what data did exist for the county, and where local data were lacking to utilize population data from California and the US which can be extrapolated to Orange County, albeit with certain assumptions. A literature review was undertaken to determine the best available estimates of neurodevelopmental needs in the early childhood population. As yet, there are no standardized school readiness assessments universally accepted as predictive of later outcomes. Most available data relates to service use e.g. enrollment in Early Start, Regional Center, school district special education services, and foster care. Such service-based data is likely to represent an under-estimate of the true degree of population need. Third, we examined currently available services and how well they are performing for children and families. We looked at whether services were effective, accessible, capable, continuous and acceptable to the population. We determined what kinds of innovative services and promising practices exist in the County that could be built upon or extrapolated. We looked for gaps in service provision and tried to determine the reasons for the gaps and potential strategies to fill those gaps. County resource mapping continued with an analysis of providers in the county across disciplines related to developmental services, to determine whether the county has the capacity to provide sufficient services given the likely degree of need in the population. Fourth, we undertook an extensive series of interviews with key informants and focus groups with parents and providers across the county to gain an appreciation for their perceptions of the current system and their visions for an ideal model. Throughout the study process, we examined the existing system of developmental services within the county in light of existing theoretical models. The healthcare system and healthcare providers are only one of a number of service systems that need to be actively engaged if the desired outcomes of healthy developmental and school readiness for all children are to be achieved. The Readiness to Learn Trajectory (Figure 3) captures some of the service sectors and programs which influence school readiness. The Wagner Care Model for Child Health (Figure 4) indicates how the healthcare system nests within a broader spectrum of community resources and policies which impact functional and clinical outcomes. Discussion of an ideal developmental services system cannot be confined to the healthcare sector but must include the educational and social 33
and family services sectors and others if it is to be truly comprehensive and effective. Similarly the pathway to school readiness involves not only health and educational services but also strong family supports (Figure 6).
Figure 3: Readiness to Learn Trajectory
R e ad i n es s t o L e ar n T r a j ect o r y
Service sectors and Programs that influence school readiness Nascent awareness of standards Nascent emotional regulation Nascent selfhood/identity Language Development
Compliance to simple requests Emotional control Functional use of language Exploration of object world Effective peer interactions
Social relationships Physiological regulation Entry into verbal milieu Attentional/motoric “control” of object world
Birth
Health
6 mo
12 mo
18 mo
24 mo
3 ys
4 ys
5ys
Ongoing well child care, acute, developmental and preventive care
Pre/perinatal care
Education:
Early Intervention Programs (including Head Start and Early Head Start) Pre-school
Social & Family Services:
Parenting and Family Literacy Programs Center and Home Based Family Resource Programs Child Care Programs
34
Figure 4: Care Model for Child Health (Wagner)
Care Model for Child Health Health System
Community Resources and Policies
Health Care Organization
Family Education & Support
Informed, Activated Patient
Delivery System Design
Productive Interactions
Clinical Decision Information Support Systems
Prepared, Proactive Practice Team
Functional and Clinical Outcomes Center for Healthier Children, Families & Communities
Figure 5: Critical Pathway to School Readiness
Critical Pathway to School Readiness Family support & intervention services
Family functioning
Parent education
Families reading together
Access to books and libraries
Quality child care and early education programs
Child health
Pediatric HC providers giving out books
Regular source of health care
Health insurance
Prenatal care
Center for Healthier Children, Families & Communities
Early literacy
Maternal health Breastfeeding
35
School Readiness
Similarly, throughout the study process we considered the funding streams and financial underpinnings of the existing system, and of any future system. A review was also undertaken of national and international best practice models, The study process commenced April 2004 and a UCLA IRB exemption was obtained. Our specific methods comprised: Demographics of the Orange County 0-5 Population US census data, the Orange County Health Needs Assessment (OCHNA) Survey, the Early Childhood and Educational Needs Assessment (ECENA) Survey, the 9th Annual Report on the Conditions of Children in Orange County 2003, and other publicly available data sources were utilized. The population was analyzed for birth rate, race, ethnicity, language, parental education, family size, family structure and median household income, health insurance status, prevalence of neurodevelopmental problems, developmental disability, eligibility for regional center services, and % children ultimately requiring special education. Health and Developmental Services Needs Infant mortality and morbidity rates were obtained from OCHNA data. The health insurance status of the 0-5 population was determined predominantly from data from the California Health Interview Survey (CHIS). Both ECENA and CHIS data were used to determine existing school readiness indicators for the county, and attitudes to school readiness. In the absence of county-specific data a literature review was undertaken to determine the likely proportion of the early childhood population with developmental and/or behavioral issues. County data from ECENA and the California Department of Education were used to determine service utilization for Early Start, Regional Center, and Special Education. Existing Developmental Services Structure: Existing key public programs impacting developmental services were documented and, where possible, utilization of those programs by the county 0-5 population was quantified. Innovative programs funded by the Commission were site visited by members of the team and the programs evaluated for capacity, accessibility, funding source, sustainability and any evaluation data. Promising practices nationally and internationally were identified both from the literature and from knowledge of the study team and were examined for existing evidence-base and effectiveness. Personnel: Data from the Pappelbaum and Turner report and the AAP Pilot report (Mathias) were examined to determine provider capacity to deliver developmental services to the 36
population. Numbers of pediatricians, family practitioners, school and public health nurses, and specialist providers such as developmental-behavioral pediatricians, child neurologists, child psychiatrists, were determined, as were numbers of audiologists, child psychology and psychiatry services, speech therapists, occupational and physiotherapists. Comparison of these data with population demographics allowed estimates of provider: client ratios. Process: Existing county processes for developmental screening and surveillance, anticipatory guidance about child development, community based interventions for prevention or treatment of developmental problems, assessment of children with neurodevelopmental problems, and longer-term therapy options were evaluated using a combination of county data and informant opinion. Where county data were lacking, data were extrapolated from nationally reported surveys such as the National Survey on Early Childhood Health (NSECH). Outcomes: A literature search was undertaken for any existing outcomes data on Orange County Developmental Services programs. Program staff were also asked for any unpublished process and outcomes data. Data from OCERS and reports from POMS were examined. Key Informant Interviews The personal opinions and perspectives of key providers and representative consumers formed an important part of system evaluation. Over 40 key informants were identified in collaboration with the Commission drawn from agencies and organizations serving children with neurodevelopmental problems e.g. CHOC, UC Irvine, Regional Centers, School Readiness Centers, Commission-funded programs. A wide range of disciplines were included -parents, early intervention providers, physicians, program directors, county health department staff, educators and health plan administrators. Each potential interviewee was contacted by email or letter and invited to take part in the targeted study. Interviews were held at a place and time convenient for the interviewee. The interviews were enthusiastically received, with 100% of those being asked to participate agreeing to take part. The average length of interview was two hours. A semi-structured protocol asked detailed questions on methods and tools for developmental screening and surveillance, and the routes whereby children who screen positive or who are identified as at-risk are referred for further assessments. The types of interventions available, eligibility criteria and barriers to obtaining interventions were explored. Open-ended questions were used, and frank comments encouraged. Over half of the interviews were conducted face-to-face with the remainder being completed by telephone. Providers were asked how hypothetical cases such as a six-month-old with feeding and sleeping problems with a depressed mother, and a 10-month-old baby with motor delay who recently arrived in the country would access developmental services.
37
All interviewees were encouraged to think at a systems level, beyond the functioning of their own clinic or program, and to envision an “ideal” or “model” developmental services system. To facilitate this process, a model building exercise was used where interviewees were asked to arrange key services and programs such as “pediatric provider’s office,” “regional center,” “hospital,” childcare center,” “school readiness center” into a cohesive system with arrows depicting flow of clients through services. This exercise was very well received and yielded many valuable insights into how developmental services are conceptualized by different groups within the system. Focus groups A separate semi-structured focus group protocol was developed which was relatively undirected to allow new perspectives on the issues to emerge. For parent focus group recruitment fliers were placed in facilities serving children with neurodevelopmental problems inviting parents to participate in a group discussion to voice their thoughts on services related to child development. The flier was posted in both English and Spanish and translation services were offered for the group to allow non-English speakers to attend. In practice one parent focus group utilized a translator and one was conducted entirely in Spanish with a bilingual bicultural interviewer. Parents responding to the flier were given a number to call outside of the service facility to arrange their attendance. This method was chosen to minimize the possibility that only selected parents might be invited to the focus groups, and to ensure that Spanish-speaking parents would be able to attend. Two focus groups with parents (10-12 parents per group, approximately 22 parents in total), and one focus group with nurses (10 nurses) were held. Funding streams were analyzed using data from Cal Optima, CHDP, EPSDT-mental Health, CCS, private insurers, IDEA-Part C and local school districts. Potential partners in quality improvement initiatives were identified through the study process.
38
Results In this section we describe the characteristics of the Orange County 0-5 population, highlighting changes in demographics over the past decade that have implications for the delivery of developmental services within the county. Second, we present our findings of population need for developmental services, and describe a hierarchical pyramid of neurodevelopmental needs –basic, low, moderate and high for children 0-5. Third, we describe existing developmental services within the county, highlighting new programs funded by the commission. We then present key themes emerging from informant interviews and focus groups which reflect the important feelings, thoughts and perceptions of those involved with delivery and consumption of developmental services. Lastly, we describe important gaps identified in the existing service delivery system. Demographics of the Orange County 0-5 Population Orange County is the fifth most populous county in the nation and, in California, is second only to Los Angeles County in population size. There are 265,249 children (2002) in the 0-5 age group, with just over 45,000 births per year, and these children are largely concentrated in small neighborhoods rather than evenly spread throughout zipcodes. Orange County has undergone very rapid population growth, with a 20% increase over the last decade. Much of this growth results from young adults moving into the area and having families. Consequently, public school enrollment in the county has risen by 31% in the last decade. Almost half of the children in the 0-5 age group are Hispanic/Latino (see Table 1) in households where Spanish is the first language, Currently, 31.1% children in Orange County public schools are English language learners. Table 1: Population of Orange County aged 0-4 years (OCHNA 2001 Survey) Number of children 78,777 2,929 101,006 467 23,863 8,972 216,614
%of 0-4 population 36.4% 1.4% 46.6% 0.2% 11% 4% 100%
Ethnicity White Non-Hispanic Black Non-Hispanic Hispanic/Latino American Indian Asian/Pacific Islander Other Race/Ethnicity All race/Ethnicity
The black population in Orange County is relatively small, while Asians/Pacific Islanders represent the third largest ethnic group. Comparison of tables 1 and 2 reveals that the Hispanic population of Orange County is growing.
39
Table 2: Population Characteristics in Orange County and California Characteristic
Orange County
California
Total population Population under 5 years old Persons with a disability aged 5+
2,938,507 216,014 (7.6%) 434,000
35,116,033 2,563,470 (7.3%) 5,923,361
Race: White Black American Indian Asian Native Hawaiian/PI Other Ethnicity: Hispanic/Latino White (non Latino) Foreign Born Language other than English spoken at home High school graduates Bachelor’s Degrees or higher Persons per household Average family size Median Household income Per capita income Persons below poverty Families with children under 5 years below FPL Families with single female head of household and children under 5 years, below FPL
64.8% 1.7% 0.7% 13.6% 0.3% 14.8% 30.8% 51.3% 29.9% 41.4% 79.5% 30.8% 3.00 3.48 $58,820 $25,826 10.3% 20,686 (12.7%) 5,664 (30.7%)
59.5% 6.7% 1.0% 10.9% 0.3% 16.8% 32.4% 46.7% 26.2% 39.5% 76.8% 26.6% 2.87 3.43 $47,493 $22,711 14.2% 366,539 (19.0%) 147,900 (44%)
From US Census data (http://quickfacts.census.gov/qfd/states/06/06059.html)
Health and Developmental Services Needs Infant Mortality and Morbidity Infant Mortality Rates for Orange County are comparable with those for California (5.3/1000) and the U.S. (6.9/1000). Although the Non-Hispanic Black population in the county is small it shares the same high infant mortality rates as are reported Californiawide and nationally for this ethnic group (11.2 per thousand for black infants vs. 4.3 per thousand for white and 4.7 per thousand for Hispanic). In Orange County 89.3% births receive early prenatal care. Children born with low birth weight (