how might one build an information infrastructure for a shared public resource ..... minimal: a laptop or desktop computer running a Java virtual machine and a ...
> 236
236 < in each of four countries (Kazakhstan, Kyrgyzstan, Tajikistan, Uzbekistan) of age 15 and older, administered in 2006, 2007, and 2008. The survey sample was based on census information for age, gender, ethnicity, and geographic location as released by each country’s government. The survey includes multiple urban and rural sampling locations, and it was administered in Russian and other regional/local languages. In addition to the general sampling scheme, a three-stage process was used to select respondents: • probability proportional to sample size of Primary sampling units (PSUs); • consecutive random sampling of households in determined PSU; and • selection of a household respondent using a Kish Grid method. The survey is a general social survey that asks a series of questions about technology usage, as well as informationgathering habits and patterns of trust and confidence. Because Internet usage rates in the region tend to be low, the survey was not designed to target Internet users specifically, but, rather, gauge general trends among the overall population. C. Inter-city and Intra-city Transportation within Kyrgyzstan Kyrgyzstan is a small, mountainous country in Central Asia. Its population is about 5.5 million and concentrated in the capital of Bishkek in the north and in the heavily agricultural Ferghana Valley in the south. The country has a youth bubble, with the median age of 24.2 years (for comparison, the US median age is 36.7). The population is defined as 98.7% literate; ethnically the population is largely Kyrgyz (64.9%), followed by Uzbek (13.8%) and Russian (12.5%). Since independence from the Soviet Union in 1991, Kyrgyzstan has struggled economically. Unemployment is high and about 40% of the population lives below the poverty line [9]. Personal vehicle ownership rates are low, and the population depends heavily on shared and public transportation for inter-city and intra-city transportation. Cities have taxis and an independently operated bus system known as the marshrutka system. Marshrutnoye taksi is a Russian phrase for ‘routed taxicab’; the marshrutka system is a shared taxi transportation system that runs on largely pre-plotted routes but without standard schedules; the standard bus is a mini-van that seats about 15 and with standing passengers can fit 25 or more. Fares are 8 som (about US$0.19) before 8pm and 10 som (about US$0.24) after 8pm for central city routes. The drivers are often independent contractors as opposed to employees of a municipal or national transportation authority. Bus routes are part of local knowledge, and learning a new route is challenging even for a city resident. Numbered routes are marked by placards placed in the front windshield of the bus, with the rough routing listed as major stops or landmarks. As buses whiz by, people try to glimpse the list of stops written on the placard to see if the bus is going in their direction. Quickly identifying an appropriate marshrutka is a challenging step when a new route is being attempted. There is a lack of official bus stops, and people stand at areas known
2 to be places where the marshrutkas stop. There is no official schedule, so riders are not always sure how long they will have to wait. Sometimes buses are full and will not stop, and then riders have another unknown stretch of time to wait. Routes can shift slightly, and because stops are often demarcated by landmarks rather than actual routings, users sometimes have to guess what route a bus will take to get from listed landmark A to listed landmark B. Overall, the system can work well if one is traveling a familiar route that does not get too crowded, but if one travels at peak times, or off hours, or wants to get somewhere new, the system can be frustrating to navigate because there is no clear pathway to gather the information relevant to a rider. Marshrutkas operate on inter-city as well as intra-city routes. In Kyrgyzstan the inter-city system is relatively transparent, if not especially efficient. In order to travel between towns, one goes to the bus depot where marshrutkas are lined up. In Bishkek, the bus depot is large and well signed, with destinations labeled on placards hanging over the bay where the minibuses are parked. In smaller cities the depots can be parking lots on the edge of town. At the Bishkek depot, drivers stand in front of their buses with microphones, calling out their destination to the crowd. There is no departure time listed, and drivers will not leave until the bus is full. If your destination is a popular one, you may not have long to wait. But if you are headed to a smaller town on a not particularly well-traveled route, you could face a significant wait before the bus leaves. It is these kinds of inefficiencies that make the system ripe for technologyassisted solutions that could disseminate information to users and prospective users of the transportation infrastructure.
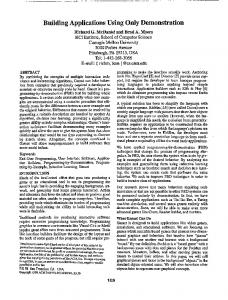
Figure 1 A bus depot in Bishkek with marshrutkas and car taxis.
In addition to the bus depots, there are also more informal ways of traveling between cities. In neighboring Uzbekistan, for example, if you want to travel and not take the buses (which can be overcrowded and perilous on the mountain roads), you can travel to an acknowledged site – in the case of the capital Tashkent, this is a subway stop furthest in the direction in which you want to travel. Or, in Tajikistan, a mountainous country with limited public transportation resources, you similarly go to an established place and look for a driver headed in your direction; at times these trips can
> 236
236
236
236 < in motion and we ran our algorithm to generate predictions about those runs. These predictions were made for five to six simulated user locations per route, and when the bus was anywhere from one to nine minutes away from that simulated user. We provided the algorithm with the model, a time to treat as the current time of the system, calculated by subtracting the expected prediction value from the actual arrival time, and a set of location updates prior to this time, accounting for location message delays (see VI. B). We compared the prediction generated to the actual timing data gathered for that run for a total of 547 measurements of error. The error in a prediction is the absolute value of the difference between the actual time it took for a bus to arrive at the destination and the time predicted by the model. The mean error from our predictions was approximately 94.9 seconds, with a standard deviation of 83.2 seconds. As seen in Figure 10, the amount of error in the prediction increases with the amount of time the bus actually is away from the user. The error can be understood as a proportion of the actual time to arrival of the bus, with the mean proportion equal to approximately 37.9% with a standard deviation of 32.2%. For example, if the bus will actually arrive at a destination in 10 minutes, we can expect the prediction of this arrival time to be, on average about 3 minutes 45 seconds off. In addition to the accuracy of our model, the amount of time required for SMS messages to travel through the network, both those giving location updates and those from user interaction, also affects the accuracy and usefulness of bus arrival time predictions. We examine these factors below. B. Message Latency 1) *box to Server Latency The accuracy of a particular prediction depends on both the accuracy of the route model and on receiving a recent, and thus accurate, location update from the bus whose status is currently being queried. Ideally, the server would have instantaneous information about the exact location of a moving bus at the point it receives a user query about that bus. In practice, the server must base its prediction on the last location update message received from that bus. Both the configured *box frequency of sending updates and any delay in that message getting from the *box to the server affects accuracy of information about the current bus location. Latency of SMS messages can be affected by a variety of factors, such as cell phone network congestion, signal coverage for the *box or the server, or the need for messages to cross networks. We recommend that the *box and the server be on the same cell phone network, as they were in our implementation, to minimize this delay.
9
Figure 10 Mean error in the predicted arrival time, plotted by the actual time to arrival (both axes in seconds).
We examined 381 messages sent from the *box to the server to measure this latency. The average latency, measured from the time it was sent by the *box to the time it was received by the server, is 19.96 seconds, with a range of 10 to 40 seconds (standard deviation of 10.3 seconds). We consider this an acceptable latency for our particular application. Although these measurements were taken in Seattle, fieldwork over the years has demonstrated to the research team that cell coverage and SMS latency in Bishkek is consistent with that experienced in Seattle. 2) User Query Latency Queries return information to users in the form of an estimated time (e.g. 5:30pm) that a bus is expected to arrive at their location. The usefulness of this information depends upon both its accuracy and how quickly it is returned to the user. Factors affecting query processing latency include: server load, cell phone network load, and system limitations on rate of SMS message sends. Based on our measurements of message latency in the previous section, we would predict the roundtrip time for the user to receive a response to their query to be the latency of two SMS messages (assuming time spent at the server is negligible), or approximately 40 seconds. Considering that the typical usage scenario would return predictions on buses several minutes away, we consider this latency to be acceptable. VII. CONCLUSIONS AND FUTURE WORK The *bus system is a direct response to an articulated problem in the developing world, and it takes into close consideration technology usage patterns and technology infrastructure available in such resource-constrained environments. The system recognizes that information is valuable, and that the lack of information inhibits certain kinds of growth and efficiencies. However, there are not always central authorities or institutions with the resources or motivation to supply information infrastructure for citizens, and the *bus system provides a mechanism by which decentralized operators of a
> 236