Sep 5, 2013 - Methods and Organization of the Report .................................................................................. 11. Background: Why New Jersey Focused on Managing By Data . ..... 9 New Jersey is a state administered child welfare system. NJDCF's largest unit ..... There's a projection up there [with] all the bar graphs⦠Our Area.
318 5th Street, Brooklyn, NY 11215
Building Data Driven Child Welfare Practice An Evaluation of the Manage by Data Initiative
By Timothy Ross, Antony Leberatto, and Randi Rosenblum September 5, 2013
Commissioned by the Northeast and Caribbean Implementation Center At the University of Southern Maine
Acknowledgements The authors would like to thank the many people whose support made this report possible. At the New Jersey Department for Children and Families (NJDCF), we thank Commissioner Allison Blake, Barbara Rusen, Elizabeth Bowman, Donna Younkin, Aziz Haidi, and Robert Ring. At the Children’s Bureau, we thank Linda Mitchell. At the Northeast and Caribbean Implementation Center, we thank Kris Sahonchik, David Lambert, Chris Beerits, Julie Atkins, Tammy Richards, and Melissa Frederick, as well as their colleagues at the University of Southern Maine Peter Watson and George Shaler. At Public Catalyst, we thank Molly Armstrong, Lisa Taylor, Eileen Crummy, Maria Lundgren and their colleague Cornelius Bird at the Child Welfare Policy and Practice Group. At Action Research, we are grateful for Ariella Messing’s support in preparing this report. We are especially grateful for the openness and enthusiastic participation of the NJDCF Data Fellows in this research. Their willingness to share their experiences and opinions are the foundation for this study. The authors are solely responsible for the content of this report.
This report was funded by the Northeast and Caribbean Implementation Center at the University of Southern Maine.
2
Table of Contents Acknowledgements ......................................................................................................................... 2 Executive Summary ........................................................................................................................ 5 Introduction: The Challenge of Managing By Data in Child Welfare........................................... 9 The Manage By Data Approach ................................................................................................... 10 Methods and Organization of the Report .................................................................................. 11 Background: Why New Jersey Focused on Managing By Data ............................................... 11 The Manage by Data Initiative ..................................................................................................... 12 Manage by Data in Action: Response Priority in “London” .................................................... 15 From Last to First.................................................................................................................. 16 Diagnosing the Problem ........................................................................................................ 16 Developing action steps ........................................................................................................ 18 Tracking implementation and outcomes ............................................................................... 18 Implementation Challenges and Solutions.................................................................................... 19 Challenge 1: Sustaining Support from Agency Leaders ........................................................... 20 Challenge 2: Balancing time demands ...................................................................................... 21 Challenge 3: Managing Group Dynamics................................................................................. 23 Implementation Summary............................................................................................................. 24 Program Outcomes........................................................................................................................ 25 Outcome 1: Developing staff capacity...................................................................................... 25 Outcome 2: Developing a candidate pool for promotion.......................................................... 28 Outcome 3: Establishing a model for data driven management ............................................... 28 Outcomes Summary and Discussion ............................................................................................ 34 Options to Consider for Replication ............................................................................................. 36 Conclusion .................................................................................................................................... 37 Bibliography ................................................................................................................................. 39 Appendix A: Research Methods and Instruments ....................................................................... 41 Appendix B: Survey Results ........................................................................................................ 50
3
So far, for fifty years, Information Technology has centered on DATA -their collection, storage, transmission, presentation. It has focused on the ‘T' in ‘IT'. The new information revolutions focus on the ‘I'. They ask, ‘What is the MEANING of information and its PURPOSE?' And this is leading rapidly to redefining the tasks to be done with the help of information and, with it, to redefining the institutions that do these tasks.1 --Peter Drucker, Management Challenges for the 21st Century
[Child welfare] agencies are drowning in data that they are mandated to collect, without the capacity to use the information to improve their practice and policy.2 --Putting Data to Work to Improve Child Well-Being: A Post-Convening Report
What I was lacking and have now learned greatly is: how to ANALYZE data; how to make sense of all the information available; and how to pull apart that which is meaningful and sound versus plentiful and junk.
--New Jersey Department of Children and Families Manage by Data Fellow
1
Peter F. Drucker, Management Challenges for the 21st Century, Harper Business, 1999. 207 pages. Putting Data to Work to Improve Child Well-Being: A Post-Convening Report. Casey Family Programs and the National Governors Association for Best Practices: Washington, DC, 2006. P. 1. 2
Executive Summary Despite the potential for child welfare agencies to use data to improve outcomes for children and families, the practice is uncommon outside of central offices. This state of affairs exists for many reasons. Child welfare executives make tough choices between investing in building staff capacity and meeting the immediate needs of children and families. Standard child welfare training spends little if any time discussing how to use data to manage operations. As in many other types of organizations, data analysis and interpretation skills among staff are often limited. Though child welfare agencies have more data today than ever before, data quality remains an issue in many systems. Finally, agencies have occasionally used data to advance public relations goals or to punish poor performance, fueling suspicion of data driven management strategies. Manage by Data, an initiative of the New Jersey Department of Children and Families (NJDCF) funded by the Northeast and Caribbean Implementation Center (NCIC), sought to address this gap as part of NJDCF’s efforts to infuse data-driven decision making throughout the organization. Manage by Data aimed to build the capacity of mid-level staff to use data to manage toward improved outcomes: to diagnose practice issues, to develop solutions, and to track and adjust those solutions as they are implemented. Program developers used a “middle out” strategy to build the capacity of local offices to manage by data. One hundred “Data Fellows,” mostly staff working in the regional and local offices that carry out the day-to-day work of child welfare, were selected to participate in the initiative. In addition to building the capacity of the Fellows, the initiative aimed to create “Manage by Data champions” who would demonstrate and communicate the value of data-driven management strategies to their supervisors and supervisees alike. Fellows would be among the vanguard of a management culture change. In developing the initiative, program developers drew on principles of adult learning. Activities included seminars, coaching sessions, leadership summits, and group work. Group projects required teams of Fellows to develop and test performance improvement projects using live quantitative and qualitative data. The program’s curriculum focused on the connection between data and the lives of children and families, on NJDCF’s history, and on developing practical skills to create tangible solutions to the challenges Fellows faced in their daily work. This report presents findings from the evaluation of Manage by Data. The evaluation sought to identify implementation challenges and solutions, the outcomes of the program on the Fellows’ work and broader agency practice, and to provide suggestions for the expansion of the program in New Jersey and in other jurisdictions if warranted. To evaluate Manage by Data, the research team observed seminars, coaching sessions and summit meetings; conducted focus groups, interviews and surveys; and visited NJDCF district offices. This report covers the program’s efforts, which started in January 2010, through the graduation of the first set of Fellows in June 2012. Summary of implementation findings Manage by Data met or exceeded standard benchmarks of implementation. Almost all activities listed in the program’s logic model were conducted as planned, and the program team made reasoned decisions to cancel or postpone activities that did not take place. Facing tight timelines, program developers produced an extensive and detailed curriculum for each seminar
and delivered the curriculum consistently and on schedule. Fellow attendance at seminar and leadership summit sessions approached 100 percent. Fellows had access to the data and technology they needed and participated in planned activities. Each of the three leadership summits attracted senior leaders from NJDCF and external stakeholders. The vast majority of Fellows gave the curriculum, the coaches, and the program high marks and strong praise. Manage by Data faced many common implementation challenges and used deliberate strategies to meet them: Challenge 1: Sustaining support from agency leaders. Manage by Data required significant support from agency leaders in the form of allowing Fellows the time to complete activities, providing opportunities for Fellows to demonstrate skills publicly, and in facilitating program logistics. To sustain leadership support, Manage by Data included Fellow group projects that used live NJDCF data to develop action plans on topics leadership selected. To ensure that managers supported the program, which required Fellows to spend two days a month away from normal responsibilities, Fellow applications required managers to nominate candidates and acknowledge program requirements. Manage by Data placed particular demands on the administrative data office of NJDCF. To facilitate these interactions, Manage by Data included five “Resource Fellows” from that office. These strategies provided value to key constituencies and helped sustain organizational support through three administrations. Challenge 2: Balancing time demands. Manage by Data is a demanding program. Fellows reported intense struggles to balance their Manage by Data assignments with their everyday job responsibilities, with many Fellows working nights and weekends to complete Manage by Data assignments throughout the 18 months. Facilitators adjusted the curriculum to make more seminar time available for coaching, but retained the initiative’s high standards. This balance proved effective: of the 100 Fellows recruited, 93 graduated. While acknowledging the stress of participation, most described the program in glowing terms and none expressed regret in participating. Challenge 3: Managing Group Dynamics. Working in groups was essential to the learning process, as Manage by Data aimed to promote intra- and interoffice collaboration. Fellows found working in groups stressful, as making collective decisions runs counter to the top-down processes with which they were familiar. Some Fellows were frustrated by differences among group members in their levels of skill and commitment to the work, and geographical distance often made collaboration logistically challenging. Facilitators took a “hands off” approach to managing groups that forced Fellows to grapple with these dynamics. Summary of outcome findings Manage by Data had a substantial impact on the Fellows but challenges remain in transmitting the lessons Fellows learned to other staff. Fellows reported strong and sustained improvements in their skills and their use and confidence in Manage by Data techniques. Some participants described the program as the highlight of their careers and as revitalizing their professional energies. Many were promoted. Fellows received support from many colleagues, but faced some challenges in communicating the value and importance of managing by data to others, especially staff working on the front lines of practice. Outcome 1: Developing staff capacity. NJDCF aimed to develop teams in the regional and local offices that would use data to identify trends and practice issues, set priorities, and problem solve. At baseline, many Fellows reported skepticism in NJDCF’s use of data as a managerial 6
tool. By graduation, Fellows reported using a broader variety of data, greater confidence in the data they used, and a strong belief in NJDCF’s commitment to data driven management. Six months after graduation, more than half of the Fellows reported “substantial” to “tremendous” improvements in a range of skills addressed in the program. Most Fellows reported that these skills were “extremely useful” or “very useful” in their day to day work. Observations indicated dramatic improvements in making public presentations and in developing and implementing empirically-based strategies to use data to improve performance. Outcome 2: Developing a candidate pool for promotion. NJDCF hoped that Manage by Data would enhance the data skills of the candidate pool available for promotion. Manage by Data played no role in personnel decisions; instead the program aimed to provide Fellows with skills and experiences that would make them stronger candidates for promotions. While researchers did not examine the circumstances of promotions, 40 of the 93 Fellows (43%) were promoted during the program. A combination of the program recruiting talented staff, managers valuing the skills those staff developed during the program, and the program’s strong reputation appear to have contributed to promotions. Manage by Data succeeded in seeding the promotion pool with staff knowledgeable and committed to data driven management strategies. Outcome 3: Establishing a model for data-driven management. NJDCF hoped the program would help establish a common understanding of how to manage by data, both among Fellows and the staff with whom they worked. Fellows used the Manage by Data model consistently in each of 19 small group projects, several of which were implemented locally and associated with measurable improvements in outcomes for children and families. Six months after the program’s end, most Fellows reported applying Manage by Data strategies in their everyday work. Over half reported starting Manage by Data projects after the program ended and a strong majority said they were confident they could complete such projects without the help of program facilitators. While the model is firmly established within the Fellows group, Fellows reported less success in transmitting Manage by Data values and methods to managers, colleagues, and especially junior staff. Fellows cited workload pressures and in some cases a sense of isolation as contributing to this challenge. Summary of suggested options Sustaining Manage by Data in New Jersey. NJDCF has already acted on several opportunities to build upon the accomplishments of the first round of Manage by Data: Option 1: Produce a critical mass of Fellows. While Manage by Data had a dramatic impact on participants, some Fellows reported feeling isolated in their offices and had challenges transmitting the skills they learned to peers and other staff. In October 2012, NJDCF authorized a second round of 40 Fellows. Developers drew on the pilot experience to pre-plan more program activities and tighten logistics. Program developers condensed the curriculum from 18 months to nine months while retaining core elements to allow the agency to reduce cost and ease the stress of participation. Option 2: Nurture Manage by Data graduates. Each participant in Manage by Data represents a significant investment. Unless graduates practice their new skills, returns on the investment diminish. In October 2012, NJDCF initiated a Graduate Fellows program in which 25 Fellows from the first round of the program serve as mentors to new participants. While far less demanding than the original training, the program is a low cost innovation designed to nurture the investment NJDCF has already made. We recommend that additional efforts to ensure that 7
the skills the remaining Fellows developed are regularly practiced and enhanced. A more formal process of assessing and prioritizing Fellow projects developed during Manage by Data is one option. Option 3: Integrate Manage by Data into NJDCF. Developing the initiative required retaining an array of consultant expertise supported by external resources that are not available as an ongoing funding stream. In time, NJDCF should work to integrate Manage by Data into the organization. A set of Fellows could serve as future facilitators, with the need for external expertise declining as internal resources mature. In addition, we suggest that case workers receive a short refresher course on New Jersey’s SACWIS system after spending six months on the job to increase their receptiveness to Manage by Data strategies. Replicating Manage by Data. There is widespread agreement among child welfare experts that developing data-driven management capacity is critical to meeting the mission of serving families and protecting children. Manage by Data is a promising initiative for developing this capacity. We recommend that Manage by Data or similar initiatives become a core part of professional development in public and private child welfare agencies. For sites considering replicating Manage by Data, we make three options. Option 1: Agencies should make sure there is a broad base of support for developing capacity to manage by data before undertaking replication. This support includes a firm commitment from leaders and managers to provide public support and organization resources to the effort, a commitment to produce and widely share reliable data, and a commitment to make sufficient public and private funds available to launch the program. Option 2: The Manage by Data curriculum should be customized to the replication environment. The examples, exercises and projects in the curriculum are specific to NJDCF and the connection between the curriculum and the Fellows’ lived experiences contributed profoundly to the initiative’s success. Option 3: Replication facilitators should have expertise and experience in managing by data in child welfare. These qualities are rare outside of central offices of child welfare organizations and critical to providing proper advice and to establishing credibility with Fellows and leadership. Conclusion Manage by Data tested a new model for developing data driven management capacity among mid-level staff primarily located in the district offices of child welfare agencies. This evaluation provides evidence that the program had a strong and enduring impact on participants. We recommend sustaining this program in New Jersey and replicating Manage by Data or similar initiatives in other jurisdictions.
8
Introduction: The Challenge of Managing By Data in Child Welfare Despite the potential for child welfare agencies to use data to improve outcomes for children and families, the practice is uncommon outside of central offices. This state of affairs exists in spite of the billions of dollars invested by federal, state and local governments to create sophisticated data systems for child welfare agencies. These systems contain data and can produce reports on virtually every nook and cranny of the child welfare system. A report for Casey Family Programs and the National Governor’s Association, for example, concluded that “Data are an invaluable resource for understanding how effectively agencies are meeting critical safety and permanency outcomes…[but] most agencies have a limited capacity to distill these data into usable information that will contribute to policy and practice improvements..”3 Many factors explain this lack of capacity. Child welfare executives make tough choices between investing in building staff capacity and meeting the immediate needs of children and families. The education and training of the bulk of the child welfare workforce rarely emphasizes management, data analysis and organization change processes. Though agencies have more data, quality remains an issue in many systems. Finally, agencies have occasionally used data to advance public relations goals or to punish poor performance, fueling staff suspicion of data driven strategies.4 As a result, few child welfare staff regularly use data driven management techniques to improve outcomes for families and children. Management and data analysis are often separate functions both on the organizational chart and in practice. To the extent that data analysis capacity exists in public child welfare agencies, it is often concentrated in central office divisions that produce reports for senior executives. Staff closer to the day to day operations of child welfare may regularly receive some charts and tables, but they are rarely exposed to data driven management techniques that turn that data into action plans. In some systems, access to performance data is restricted to senior staff to prevent embarrassing disclosures. Several efforts have aimed to address these conditions. On the federal level, the Children’s Bureau initiated funding of national resource centers for organizational improvement (NRCOI) and for child welfare data and technology (NRCCWDT) and built data and quality improvement assessments into their Child and Family Service Reviews (CFSRs), among other initiatives.5 Many state agencies have developed quality assurance divisions that aim to use data to ensure strong practice, sometimes as part of Program Improvement Plans (PIPs).6 Settlement agreements in class action lawsuits have focused reform efforts on metrics for improvement in
3
Putting Data to Work to Improve Child Well-Being: A Post-Convening Report. Casey Family Programs and the National Governors Association for Best Practices: Washington, DC, 2006. P. 1. 4 See Mark Testa and John Poertner. 2010. Fostering Accountability: Using Evidence to Guide and Improve child Welfare Policy. New York, NY: Oxford University Press. 5 See, for example, http://www.nrcoi.org/rcpdfs/QA.pdf and https://www.childwelfare.gov/management/reform/cfsr/datause.cfm last accessed May 16, 2013. 6 Administration for Children and Families. (2012, August 27). Information Memorandum. Retrieved from http://www.acf.hhs.gov/sites/default/files/cb/im1207.pdf.
9
some states.7 Despite these and other efforts, most agencies still struggle to use data to develop, implement and assess efforts to improve practice and outcomes.8
The Manage By Data Approach This report is an evaluation of the Manage by Data program, an initiative of the New Jersey Department of Children and Families (NJDCF) funded by the Northeast and Caribbean Implementation Center (NCIC).9 First conceived in 2009, Manage by Data sought to help transform NJDCF into an organization where data are used routinely to inform practice and performance decisions and to identify, diagnose, and address practice issues. NCIC requested that the research and policy consulting firm Action Research evaluate the initiative. Most efforts to strengthen data-driven management capacity focus on training senior staff located in centralized administrative offices. Some trainings teach standard management practices such as goal and target setting, and may draw on examples from the private sector. Other training is devoted to technical data issues, such as ways to extract, manipulate and interpret large quantitative datasets. Most of these trainings last no longer than two weeks and many are just a few hours. The Manage by Data initiative used a decidedly different approach. Instead of central office personnel, Manage by Data concentrated its efforts on 100 “Data Fellows” who were recruited from NJDCF’s mid-level staff, most of whom were located in district offices throughout the state. The core of the program involved an 18 month program that used live data from NJDCF’s statewide automated child welfare information system (SACWIS), New Jersey SPIRIT, to work on specific issues impacting their catchment areas. 10 The program married data analysis skills, such as creating and interpreting charts and identifying trends, with management skills such as problem solving, process mapping, and target setting. In addition, the program required Fellows to develop presentations on their work and engage in public speaking in front of large audiences that included senior NJDCF executives and external stakeholders.
7
See For the Welfare of Children: Lessons Learned from Class Action Litigation. 2012. Center for the Study of Social Policy: Washington, DC. 8 A survey by the National Resource Center on Organizational Improvement, for example, found that 20 states had no training focused on continuous quality improvement and that among those states that did, most trainings were one-time events. See http://www.nrcoi.org/CQIproj/cqideptstructure.pdf. See also, Annie E. Casey Foundation and The Center for the Study of Social Policy (2011). Counting is not enough. Annie E. Casey Foundation, Baltimore, MD. 9 New Jersey is a state administered child welfare system. NJDCF’s largest unit is the Division of Child Protection and Permanency (formerly the Division of Youth and Family Services), which carries out traditional child welfare functions such as investigations, permanency, and adoptions. In addition NJDCF includes divisions for preventive services, behavioral health, and adolescent services. For an organizational chart, see http://www.nj.gov/dcf/documents/about/DCF_TO.pdf . NCIC is one of five implementation centers funded by the federal Children’s Bureau to support systemic improvement projects of two to three years duration. NCIC is located at the Muskie School of Public Service at the University of Southern Maine. 10 SACWIS stands for State Automated Child Welfare Information System. States that comply with federal regulations on the form and fields of their SACWIS systems are eligible for federal funds to support development of the system.
10
In essence, Manage by Data employed a “middle-out” strategy for organizational change. The initiative sought to seed NJDCF’s district offices with staff who had learned data-driven management skills.11 Program developers hypothesized that once staff above and below the Fellows on the organizational chart were exposed to data-driven management—and leadership’s commitment to that modality—demand for the skills of the Fellows would proliferate throughout the agency. Over time, Fellows and their colleagues would understand the value of empirical management techniques and have fewer suspicions of data-driven approaches. The staff who possessed these skills, moreover, would be promoted to positions of greater authority, helping to insure that an agency wide model would take hold. The program’s decision to train middle-level staff across the state was unique: we know of no other child welfare initiative focused on datadriven management capacity that has taken this approach.
Methods and Organization of the Report This study describes the strategies that Manage by Data used, outlines the challenges the initiative faced and how they were addressed, and assesses the impact of the initiative. The report includes suggestions for New Jersey and for other jurisdictions interested in replicating the model. The study used a case study design focused on the program’s logic model.12 We sought to document the strategies and activities involved in the initiative, measure the outputs the program produced, and assess how well the program met the outcomes it sought to achieve. We surveyed participants four times during the course of the initiative, conducted interviews of senior managers and program providers, observed seminars and leadership summit meetings (described below), conducted site visits and reviewed data used in a Manage by Data project, and reviewed key documents. For a full description of the methodology, see Appendix A. The report starts by explaining why New Jersey decided to implement the Manage by Data initiative, followed by a description of the program. The next section focuses on the challenges Manage by Data faced during its implementation and how NJDCF and the program’s operators sought to address those challenges. The third section reports on the outputs and outcomes of the initiative. The report concludes with lessons learned and options for refining the program. .
Background: Why New Jersey Focused on Managing By Data In 2003, New Jersey signed a settlement agreement in the class action lawsuit Charlie and Nadine H., et al vs. Whitman filed in 1999. In 2005, the independent panel monitoring the settlement found that New Jersey was not making adequate progress in its reform effort. With a pending contempt motion filed by plaintiffs against the state, recently elected Governor Jon Corzine announced the creation of a cabinet-level agency, the New Jersey Department of NJDCF “Local offices” refers to the 10 Area offices and 47 local offices that are located across the state. Area Offices oversee the work of the local offices within their jurisdictions. NJDCF’s central offices are located in the state capital, Trenton. 12 The methods used here draw on Robert Yin. 1998. “The Abridged Version of Case Study Research.” In Leonard Bickman and Debra Rog, eds. Handbook of Applied Social Research Methods. Thousand Oaks, CA: Sage Publications; Timothy Ross. “Program Evaluation in a Democratic Society: The Vera Model.” The Evaluation Exchange, Volume XI, No. 3, Fall 2005. Cambridge, MA: Harvard Family Research Project, Harvard Graduate School of Education; and Timothy Ross and Randi Rosenblum. 2013. The Action Research Approach to Studying Social Services. 11
11
Children and Families, whose primary responsibility was operating the state’s child welfare system. NJDCF’s administrators negotiated a modified settlement agreement, or MSA, that committed NJDCF to meet a schedule of increasingly rigorous performance benchmarks over the next several years.13 The benchmarks included 55 indicators involving over 200 measures, ranging from the timeliness of investigations to the frequency of visits between parents and their children in out-of-home care. New Jersey had made significant investments in database technology. In the years following the filing of the lawsuit, the state migrated from a legacy database to a SACWIS system called New Jersey SPIRIT. To enhance reporting, NJDCF uses Safe Measures, a software reporting package.14 Safe Measures enabled SPIRIT users—the majority of NJDCF staff—to generate reports on the MSA indicators and measures. Using SafeMeasures, for example, desktop users can quickly see the proportion of investigations that were completed within 60 days statewide, in each of the State’s 10 Areas and in each of the 47 local offices. In addition, a user can “drill down” to see the same information aggregated by individual supervisors, by the caseload of individual caseworkers, and by individual case. The analytic capacity of NJDCF’s staff, however, had not grown at the same rate as the agency’s information technology. In a 1999 filing, plaintiffs asserted that New Jersey had “no accurate or timely system for the measurement of case management and outcomes”.15 While New Jersey had data, it did not have a system of management that allowed a broad range of staff to make strategic use of that data. Like most state public child welfare agencies, NJDCF’s quality improvement wing worked out of the central office in the state capital, Trenton. Starting in 2006, the agency sought to push data-driven improvement efforts closer to the front line staff. NJDCF created a new position in its Area offices, “Area Quality Coordinator”, and expanded access to SPIRIT and SafeMeasures reporting.16 These efforts met with limited success. While central office staff regularly used data to drive decision making, Area and local office staff often struggled. Many staff knew how to access some standard reports, but few knew how to use the data to diagnose and address performance issues. Though the Office of Information, Technology and Reporting (ITR) generated reports for agency leadership and court monitors, staff outside the central office often strained to understand how the reports were produced, how the reports reflected on the agency’s performance, or how the reports could be used to improve outcomes. Casework staff often viewed reports with mistrust or even hostility.
The Manage by Data Initiative When NCIC asked NJDCF how it could help the agency in 2009, New Jersey leadership developed a proposal for the Manage by Data program. In brief, “managing by data” means For a history of the lawsuit and related documents, including the modified settlement agreement and monitor’s reports, see http://www.childrensrights.org/reform-campaigns/legal-cases/new-jersey. 14 See http://nccdglobal.org/analytics/safemeasures. 15 See Charlie and Nadine H. et al vs. Whitman, Amended complaint dated August 4, 1999, page 43, section 218. 16 See the monitoring report for Charlie and Nadine H. v. Corzine for the period January 1— June 30, 2007, available at www.cssp.org, last accessed November 15, 2012. 13
12
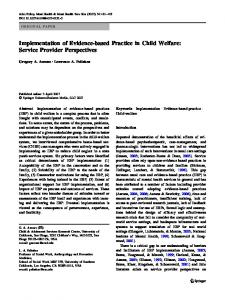
using quantitative and qualitative information to diagnose issues, develop solutions, and to use data to track and adjust implementation of those solutions. After consulting with other state child welfare agencies, NJDCF staff crafted a plan focused on middle level managers working in the field. Though central staff had often used data driven management strategies, central office efforts alone were seen as insufficient to create the type of broad-based change in organizational culture sought by leadership. While efforts to increase central office capacity continued, the Manage by Data initiative aimed to work with 100 middle-level managers from across the state, called “Data Fellows,” to diagnose performance issues, develop solutions, and track their implementation. With NCIC and other experts, the state developed a logic model for the initiative, which reflected the program’s theory of change. The logic model (Figure 1) envisioned several steps toward creating a data-driven organization. First, the program would bolster the data analysis and management skills of a cadre of mid-level staff. The group would access data more frequently to make decisions, incorporate data into their supervision and management, and learn how to use data to improve performance. This group, in turn, would be at the center of building teams of staff capable of managing by data in each of NJDCF’s 10 Area offices and in many of the 47 local offices. NJDCF faced some immediate challenges. There was no curriculum on managing by data in child welfare and no in-house coaches with hands on experience in this area. To help design and deliver the program, NJDCF contracted with Public Catalyst, a New Jersey-based firm that partners with government and non-profits to improve work with children and families. A facilitator from another organization, the Child Welfare Policy and Practice Group, also worked on the program’s development and delivery. The program development team drew on research findings from studies of adult learning; adaptive leadership and organizational change; and scholarly work focused on using data to improve performance in child welfare.17 The team had a deep understanding of child welfare practice, with staff that had worked at senior positions at NJDCF and who had consulted with other child welfare agencies. The result was an 18-month program with a curriculum that included project work analyzing live administrative data, conducting quality reviews of actual cases, and developing solutions to specific challenges faced by NJDCF. The selection process, described below, produced 100 Data Fellows who were divided into five equal sized groups based primarily on geography. Each of the five groups met monthly for daylong Manage by Data seminars. Each group was subdivided into project teams that focused on developing concrete solutions to agency issues identified by NJDCF leadership. Project work required putting the principles of Manage by Data learned in the seminars into action. The largest group of Fellows—about half—were in direct frontline supervisory positions in the child protection arm of NJDCF. About a quarter of the Fellows were Case Practice Specialists: experienced workers that consult with staff to improve practice.
17
See, for example, Chip and Dan Heath. 2010. Switch: How to Change When Change is Hard. New York, NY: Crown Business Publishers; Mark Testa and John Poertner. 2010. Fostering Accountability: Using Evidence to Guide and Improve child Welfare Policy. New York, NY: Oxford University Press.
13
Figure 1: Manage by Data Logic Model
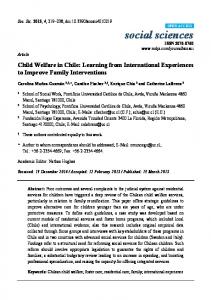
A full description of the curriculum, which is several hundred pages, is beyond the scope of this report.18 As shown in the graphic below, the seminars first focused on helping Fellows become knowledgeable consumers of data. Content focused on how to tell a story with data, understanding data “etiquette”, and diagnosing practice issues using qualitative and quantitative data. The second set of seminars focused on using data to manage change. Seminars included mapping business processes and data flow, working with “leverage metrics” (indicators that are causally linked with several other measures, so that an improvement on a leverage metric is likely to lead to improvements in several other areas of practice), and establishing baselines, targets and goals. The final set of seminars focused on improving outcomes, and included sessions on turning data diagnostics into action plans, “managing from the middle”, and evaluating practice changes. Figure 2: Manage by Data Curriculum Overview
The detailed example below describes how Fellows put the concepts of managing by data into action during the program. Other Fellow projects followed the same model.
Manage by Data in Action: Response Priority in One Area Timely responses to reports of child abuse or neglect are important to ensuring child safety. Reporters usually understand the gravity of making a report to the State Central Register and many people are reluctant to call unless they have serious concerns about a child’s well-being. Child protective investigators need to make contact quickly to assess safety concerns and address pressing needs.
18
To learn more about the curriculum, see Molly Armstrong, Cornelius Bird, Lisa Alexander-Taylor and Eileen Crummy. Managing by Data to Improve Outcomes for Children and Families; DCF Fellows Program 2011-2012 Overview. Available upon request from Public Catalyst.
Responding to reports of child maltreatment in appropriate time frames is also one of several case practice standards embedded in the modified settlement agreement (MSA) between NJDCF and plaintiffs in the class action lawsuit described above. The MSA requires that “allegations of abuse or neglect be classified as to their type and the required response time.” Required response times—the time from receipt of a report by the State Central Register to when field workers commence an investigation—fall into three categories: immediate responses that must occur within the same business day, CPS 24 hours responses that must occur within one calendar day, and CWS (Child Welfare Services) responses that must occur within three calendar days. These time ranges, which are guided by the severity of the allegations, are referred to as response priority. The MSA requires that 98 percent of investigations commence within the response priority time frame. From Last to First In January 2011, at the outset of the Manage by Data initiative, one of the ten Area Offices that we will refer to as “Area Office 1” to maintain confidentiality, ranked last in the state with just over half of all investigations commencing within the response priority time frame. One of the local offices within Area 1 ranked last of NJDCFs 47 local offices. In the first session of the Manage by Data program, the seminar included a review of New Jersey’s child safety metrics. Several Fellows who worked in Area Office 1 reported feeling embarrassed by the low ranking of the Area Office overall and the local offices in which they worked. Others found the data deeply disturbing. As one remarked, You just started the Manage by Data program, there’s all your peers from other offices [and] everybody knows that this table is your office. There’s a projection up there [with] all the bar graphs… Our Area Office in every slide was last… what made it even worse was that a lot of it was intake and I’ve done nothing but intake my entire career, so that was my grade… you have to be kidding me.
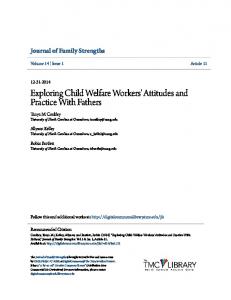
When Manage by Data facilitators divided Fellows into project groups, four of the Area Office 1 Fellows, two in one local office and two in another local office, were assigned to explore ways to improve performance on the response priority metric. Diagnosing the Problem Following the Manage by Data framework (see diagram below), the Area Office 1 Fellows set out to diagnose the problem. “Diagnostic work” in Manage by Data argot includes literature reviews, looking for “bright spots” of practice—locations where performance on a metric was much higher than average—reviewing quantitative and qualitative data, speaking with staff and sometimes clients, and other activities that provide insight into a topic. Much of the diagnostic work focuses on hypothesis testing: as in the other Manage by Data projects, staff in the Area Office 1 office had ready explanations to discredit performance issues exposed in the data. Some Area Office 1 Fellows, for example, asserted that the rankings were calculated incorrectly. Other staff thought that data were “a game” played by management and suspected that some districts were manipulating their data to make their performance look better.
16
Figure 3: Manage by Data Model
Sifting through a sample of New Jersey SPIRIT data case by case led to a sobering conclusion: the Fellows found that the aggregate numbers were calculated correctly. During this work, however, the Fellows learned much more about the definitions used in determining response priority and the method used to calculate response priority compliance rates. With this background, the Fellows then spoke to several workers about their case practice and how they entered response priority data into New Jersey SPIRIT. By comparing what the workers reported to the actual data in SPIRIT, the Fellows identified several reasons why Area Office 1 performed so poorly: 1. Case practice. Some workers triaged investigations beyond the response priority categories. They acted rapidly on immediate and CPS 24 hours reports, but let CWS cases languish. Many workers believed that CWS cases were not part of the response priority metric. 2. Weekends. Sometimes cases were assigned on Fridays to workers in the field. When the worker returned to the office on Monday, the case was already noncompliant. 3. Entering the data is complex. The SPIRIT window for a new investigation has several drop down menus. One Fellow remarked that it took an entire day to understand all of the options available to indicate response time. In some investigations, response times were entered incorrectly leading to compliant cases being deemed noncompliant. 4. Entering data in a timely manner. Many workers entered data into SPIRIT only near the end of the 60 day period allowed for completing investigations. Statistics on response priority, however, are calculated monthly—and cases with missing data are deemed noncompliant. 5. Entering the wrong date. After a supervisor approves an investigation, workers cannot change data in SPIRIT even when workers realize that incorrect data caused cases to be deemed noncompliant. 6. After hours calls. The “immediate response” category requires a response within the business day that the call is received. Calls that come in after hours are handled by the 17
Special Response Unit (SPRU). Fellows identified two problems. First, if a call came in at 11:30pm and the SPRU made contact with the family at 12:15am, the case was deemed noncompliant because contact was made the next calendar day. Second, on SPRU cases, which are assigned to regular staff the following morning, workers were entering the time they contacted the family instead of the time when SPRU contacted the family. 7. Recording “Good Faith Effort”. The MSA defines commencing an investigation as making a “good faith effort” to contact families, and knocking and leaving a note on a family’s door is considered a good faith effort. Many workers, however, understood that commencing an investigation meant actual face to face contact. In conducting their diagnostic work, Fellows noticed a deeper underlying problem. Many case workers did not see how the data reflected on their work, on their supervisors, and on NJDCF as a whole. In particular, workers did not understand that failing to enter data properly made it appear that as individuals, an office and an agency were not doing their jobs. In interviews, workers reported that entering data was “just part of a numbers game” or “done to make managers look good.” Indeed, the workers’ views were similar to those expressed by many Fellows on the baseline survey at the start of the Manage by Data program. Developing action steps Having diagnosed a set of problems, the Fellows devised a series of “action steps” to improve response priority and thereby increase child safety. In two offices, Fellows invited intake staff and supervisors to a training session. The session started with an explanation of how leadership and the MSA monitor used response priority data to assess worker, supervisor and agency performance. Putting the issue in the larger context of the mission of the agency, as opposed to blaming or shaming the workers, made workers more open to learning about solutions. The session also focused on the findings from the diagnostic work, which helped dispel the “myths” that staff often used to minimize performance issues that data revealed. Having linked the issue to the mission of the agency and debunked standard reasons staff used to explain poor performance, the stage was set for discussing solutions. Several aspects of the solution involved minor but important changes in practice and data entry. In interviews with researchers, workers reported that they appreciated the time the Fellows took to explain how to enter the data and why it mattered, as opposed to ordering improvements, and that they would welcome more sessions of this kind in the future. Workers said that entering response priority, once they understood how, was not challenging. Tracking implementation and outcomes Fellows then set out to track the impact of their efforts and to make adjustments as needed. While Fellows said they felt the sessions were well-received by staff, the Manage by Data curriculum emphasized the need to pay careful attention to the performance metrics the solution aimed to improve. Making lasting changes requires a diligent effort to celebrate successes and to support staff having difficulty adjusting their practice. To encourage accountability and healthy competition, a Fellow in one of the local offices regularly updated and displayed office response priority rates in a chart visible to the entire staff. Another Fellow regularly asked individual workers to enter missing response times. The Fellow also promised to buy workers lunch if the office met a target rate. The Fellows in a second local 18
office developed a similar plan, but focused more on daily monitoring with email and in-person reminders to workers. For workers whose performance did not improve, supervisors conducted individual sessions to review data entry procedures and to emphasize the importance of response priority. Fellows tracked response priority as they rolled out their plans in April 2011 and shared progress with local office and Area staff. In January 2011, 74 percent of the first local cases met the response time standard. By July 2011, 93 percent of first local office cases met the standard. One year after the roll out of the plan, 99 percent of first local cases met the standard—the highest rate in the state. For the full year ending in 2012, the first office tied for 5th among NJDCF’s 47 offices with 95 percent of cases complying with the response priority time frame. In January 2011, 53 percent of cases in the second local office met the response time standard. By September 2011, the rate in the second local office hit 90 percent. While staff turnover contributed to a moderate decline in performance, the second local office has not dipped below 79 percent in any month since September 2011—well above the 53 percent baseline. In interviews and focus groups, supervisors and workers in both offices credited the sessions and the daily monitoring to changes in practice that gradually reduced the need for reminders to meet response priority deadlines. While resources prevented the research team from more detailed examination of other projects, our other data collection activities indicated that the process described above was used consistently by the Fellow teams working on other topics (see “Outcome 3” below). The next section describes the challenges the program team faced in implementing the Manage by Data initiative and the solutions used to address those challenges.
Implementation Challenges and Solutions This section focuses on implementation challenges and solutions, but should be understood in the context of a program that by standard criteria, had an exceptionally strong implementation under challenging conditions: 1. Almost all activities in the program’s logic model were completed. When activities were not carried out, it was because the program team made conscious decisions cancel or postpone them. 2. NJDCF recruited experienced coaches and program developers who completed the program—the core coaching team experienced no staff turnover. 3. Program developers produced an extensive and detailed curriculum for each seminar. 4. The program met its recruitment target of 100 Fellows, of which 93 graduated from the program. 5. Virtually all Fellows attended all 18 seminar and leadership summit sessions.
19
6. To the extent our methodology allowed us to determine, the program was delivered consistently to each group by the facilitators.19 7. Fellows had access to the data needed for individual assignments and group projects and the software and hardware needed to analyze those data. 8. Each of the three planned leadership conferences were well-attended and executed as planned. 9. The vast majority of Fellows gave the curriculum, the coaches, and the initiative itself high marks and strong praise, as demonstrated in detail below. 10. The program received additional support from funders during the course of implementation. Like all organizational change efforts, however, Manage by Data faced many implementation challenges. This section of the report focuses on three critical challenges and how they were addressed: sustaining the support of agency leaders, addressing Fellow concerns about demands placed on their time, and managing group dynamics. The Manage by Data program design anticipated many of these challenges and included strategies to address them.
Challenge 1: Sustaining Support from Agency Leaders Organizational change efforts require consistent support from senior leadership and managers. As a strategy using a “middle-out” strategy for change, it was especially important that leadership signal their support for the Fellows’ efforts. Maintaining support for any initiative over an extended period is challenging, as public child welfare agencies usually have many initiatives underway, the excitement for new initiatives often peaks at launch, and commissioners and other executives often have short tenures. During the Manage by Data initiative, for example, NJDCF had three commissioners, several changes at the Area level, and none of the senior executives who developed the original proposal remained at NJDCF through the end of the period covered by this evaluation.20 In addition to regularly communicating with agency leaders, program staff used several strategies that supported organizational change goals and helped sustain leadership and management support through turbulent times. Clear expectations. During the design phase, program developers communicated to leadership and management that Fellows needed authorized “protected time” to participate in the program. This included mandatory attendance at Manage by Data seminars each month and one day a month outside of seminars to work on assignments and projects. While some Fellows reported in surveys that their managers did not take enough interest in the initiative, few Fellows reported that they were directed to miss a Fellows seminar or not to use protected time. A strategic application process: Participation in the Fellows program was voluntary, though several Fellows reported being encouraged by supervisors to apply. The Commissioner emailed an announcement that outlined the program’s goals, requirements, the application process, and 19
Resources prevented researchers from observing every seminar in every group. On the many occasions where researchers observed the same seminar presented by different facilitators to different groups, facilitators followed the curriculum guide with fidelity. 20 In the fall of 2010, Republican Christopher Christie defeated Democrat Jon Corzine in the New Jersey gubernatorial election. As expected, Corzine’s senior executives resigned. Governor Christie’s first appointee as NJDCF commissioner withdrew before confirmation after several months. Governor Christie then appointed Commissioner Allison Blake, who now leads NJDCF.
20
framed selection as a Fellow as an honor. To ensure that managers understood and supported the program, applications required that supervisors nominate candidates. Though a small number of senior managers discouraged staff from applying, the program received 143 applications for the 100 Fellows slots. In selecting the Fellows, program developers and NJDCF staff purposefully included staff from many parts of the state and from each of the agency’s ten divisions— broadening potential impact and the number of leaders with a stake in the program’s success. Projects selected by leadership. Prior to the start of the seminars, program developers met with agency leaders to identify projects that Fellows would undertake as part of the initiative. Leadership defined the projects that Fellows would undertake such as delayed permanency (children in care for three or more years), parent engagement, frequently encountered families, and patterns in institutional abuse reports.21 By having leadership select topics, Fellows had the opportunity to demonstrate the value of the initiative during the program, not after it was finished. Leadership summits. Manage by Data included three large meetings at the beginning, middle and end of the program that involved senior agency leaders and external stakeholders. The external stakeholders included staff from NCIC, the federal Children’s Bureau, foundations, the governor’s office, the MSA monitoring team, and other stakeholders. The summits served many purposes: they signaled the agency’s commitment to the initiative, provided Fellows the chance to communicate substantive information and demonstrate skills, and gave leadership a forum to communicate their vision for the agency. The summits also kept stakeholders involved in the initiative and aware of its value. NJDCF’s commissioner and senior staff actively participated in each of the summits. Connection to Management Information Systems staff. The Information, Technology and Reporting office (ITR) of NJDCF had a large stake in the program, as ITR’s Director led the internal development of the Manage by Data program. But the program also created a burden of additional work, as ITR staff would need to work with Fellows to pull data for projects. To help the Fellows and keep leadership and staff of ITR involved, each group had its own “Resource Fellow” from ITR. The Resource Fellows attended classes and supported the Fellows in making data requests and troubleshooting data issues. There is overwhelming evidence that these strategies succeeded in maintaining the support of leadership. The program received visible public praise throughout the initiative from the Commissioner (including in testimony to the state legislature), from other senior central office staff, and from many of the 10 Area Directors. With some exceptions, most managers respected the requirements outlined in the application. Budget, staff time, space, and other program needs were not cut or diverted. Perhaps the strongest evidence is NJDCF’s continued funding of additional Manage by Data classes out of its own budget, discussed in more detail below.
Challenge 2: Balancing time demands The time demands of the Fellows program were the most frequent complaint voiced by Fellows in focus groups and surveys. Manage by Data assignments often took far longer to complete 21
In New Jersey, the Institutional Abuse Investigations Unit handles all reports of maltreatment in care, as well as reports of child maltreatment in institutions such as schools, juvenile delinquency placements, and daycare centers.
21
than the time allotted and many Fellows reported working nights and weekends frequently. Some worked into the early morning hours, attended seminars during vacations or canceled vacations to meet their Fellow obligations. The Fellows found it especially difficult to balance the demands of the program with their everyday responsibilities as managers and supervisors. Many worked diligently to manage the sometimes urgent and unanticipated needs of staff while adhering to the rigorous demands of the program. As one remarked: “It’s just that the time commitment for me is the time commitment for my staff. My staff needs me to keep the wheels moving…So it’s been a real burden on my staff as well that I have been out as much as I have.” The length of the program contributed to these concerns. Over the course of 18 months, many Fellows experienced changing work conditions that created unusual demands on their time outside of the Fellows program, including promotions, transfers, and spikes in workload. Perhaps the most extreme example was a local office manager who lost half of the office’s investigative capacity due to an unfortunate coincidence of promotions, leaves, retirements and other personnel changes. Beyond the work environment, many Fellows grappled with life events such as moving, health issues, or other family crises. The program team used several strategies to retain Fellows in the program. Fellows as an opportunity: From its inception, participating in Manage by Data was framed as a voluntary opportunity, not a mandated requirement. Throughout the program, coaches and leadership emphasized that being selected as a Fellow was an honor. At public presentations, individuals were identified as Fellows, not by their NJDCF title. Facilitators relayed the interest of external stakeholders in Manage by Data to the Fellows to reinforce that participating in the program was special. In addition to boosting professional pride, this framing of Manage by Data encouraged the view among many Fellows that their participation and performance in the program was an audition for future managerial or leadership positions. A pragmatic curriculum. Developers embedded the curriculum in the NJDCF experience and the acquisition of practical skills. Fellows worked with live data from New Jersey SPIRIT that pertained to issues that NJDCF faced, not generic data typically used in undergraduate or graduate courses. Each group project delved deeply into New Jersey demographics, history, and case practice. The curriculum also included developing presentation abilities, learning how to use PowerPoint and Excel software and other skills that transferred quickly to the work environment outside seminars. As one Fellow commented, “For me it held my attention every class. It was never like, ‘Oh my gosh, when are we done?’ I wasn’t bored.” Developers sprinkled the curriculum with team-building assignments, videos and readings that focused on organization change efforts in fields other than child welfare. Videos and readings were often inspirational or humorous as well as educational. Technical data discussions were usually reserved for small group discussions or one-on-one coaching (described below). As one Fellow commented, “With no video or reading did I read and go, ‘Why did we get this? This doesn’t apply. I’m not going to use this.’ It all comes back around… I thought all the materials were wonderful.”
22
The seminar environment. During seminars, facilitators were relentlessly upbeat and structured interactions so as not to embarrass individual Fellows and praised progress. To keep the sessions connected to NJDCF’s mission, each seminar began with a facilitator asking for Fellows to relay stories of helping children and families. Facilitators also encouraged a healthy competition within and between groups and teams (though not individuals) by routinely highlighting strong Fellow performances at other sites. One facilitator commented that the Fellows are ambitious people who have done well in the agency and harnessing that competitive desire in a healthy way helped the Fellows meet the demands of the program. Coaching. Facilitators spent substantial time—far more than anticipated—in small groups and one-on-one coaching sessions. Coaches addressed specific individual weaknesses, provided substantive knowledge and strategic advice, and helped facilitate data requests and introductions. Coaches were “on-call” throughout the course, answering email and phone calls whenever needed. While labor intensive, the commitment made by coaches modeled the commitment expected of the Fellows. The Fellow below made a remark echoed by others: You really did feel that your voice was being heard and that they recognized that it was kind of a work in progress and even though the basic content didn’t change they really worked with us to understand what our strengths and weaknesses were and what areas we needed assistance in. Mid-course changes. In response to Fellow concerns, program staff allotted two hours of seminar time for group project work. Because members of most groups worked at different locations, group work in seminars alleviated the need for face-to-face meetings outside of seminars—which often took considerable time just to schedule. At program end, these strategies had a mixed record in helping Fellows balance the responsibilities of their jobs with the expectations of a demanding program. Many Fellows reported a strong camaraderie in their project teams and groups. Numerous Fellows made extra efforts to complete their work because they did not want to disappoint the facilitators or their colleagues. At the same time, others reported high levels of anxiety that caused them to consider ending their participation—though only seven did not complete the program—and others reported being angry at the “one person in every group” who they felt did not make the needed effort. While Fellows frequently described the stress of being a Fellow in focus groups, when asked, none of the approximately 50 focus group participants said they regretted their decision to apply to the program.
Challenge 3: Managing Group Dynamics A third challenge in implementing Manage by Data concerned managing group dynamics on project teams. Within each of the five groups, Fellows were divided into project teams of two to eight people that focused on the specific issues identified by leadership. Group work facilitated deeper explorations of individual topics and building teams capable of managing by data was an aspiration of the initiative and part of the program logic model. The group work created several challenges: Leadership and distribution of work. Like staff in large organizations generally, NJDCF staff are attentive to their position in the hierarchy. With an average tenure at NJDCF of ten years, most 23
Fellows were used to receiving instructions from supervisors and issuing instructions to supervisees. Manage by Data facilitators, however, explicitly treated Fellows as equals regardless of their position on the organizational chart. Project groups were not assigned leaders and the division of project work was left up to each group to decide. Many Fellows struggled through the group work process and group work created more tension among Fellows than any other aspect of the initiative. Some Fellows wanted a group leader who would assign tasks—an option that coaches rejected as antithetical to the purpose of the program. Others felt that they deserved more credit for their work. One Fellow remarked, “Everyone gets to ‘graduate’ and are all considered ‘Fellows’ at the end despite many who did not exert nearly the same effort as others.” Regarding group work, another Fellow commented that “clear direction should be given [from the facilitator] - if I ask a question, I need to know if I am on the right track. Strength based interaction is good but sometimes more direct guidance is needed.” Skill diversity. Fellows had a mix of skills. For some Fellows, this was a strength: “I think in each group you had people who were proficient in one area and less proficient in another and everyone helped one another get to the same area of proficiency.” Other Fellows, however, found the mix frustrating: “It is an excellent program and many lessons were taught, but many people still have not learned how to use Excel, create charts, or interpret data. It is a manage by data program but numerous people are still extremely weak in the data area.” Mixing supervisors and supervisees. Fellows were drawn from several levels of staff. Program logistics and mid-program promotions led to some Fellows working in groups with their direct supervisors or others with higher positions in the agency. Some Fellows found working in a group as an equal with their supervisor challenging: Sometimes the blending or mixture of people, being in a group or the classroom with your boss or your manager tapers what you’re willing to say because your boss is right there. Or if there’s a problem, just technically, just in your work environment, to report it out sometimes has consequences based on the mixture of how the groups are put together. These are common challenges in professional work groups and facilitators were aware of group tensions.22 In general, coaches urged Fellows to resolve the issues they encountered in groups on their own, as that is what they would have to do after graduating from Manage by Data. In addition, coaches sought to avoid becoming entangled in individual conflicts that could undermine their teaching efforts. Many Fellows reported benefits from struggling through a group learning experience, while some felt that the tension generated by the group work outweighed the benefit.
Implementation Summary In an environment of tight deadlines, administrative changes, and starting without a curriculum or program model, the program team implemented Manage by Data exceptionally well. The data 22
See Chapter 10 of Adrian Furman. 2012. The Psychology of Behavior at Work. (2nd edition). Routledge Press: New York, NY.
24
collected shows that the major activities envisioned in the logic model were carried out in a consistent and timely manner, producing a high degree of enthusiasm, loyalty and commitment among participants. The program team anticipated many challenges in advance and designed strategies to solve them. Strategies to ensure leadership support throughout the initiative were strikingly effective. While many Fellows struggled with balancing the demands of the program with their job responsibilities and with the stress of developing projects in groups, the vast majority overcame these challenges to graduate the program and reported a strong sense of pride in doing so. We offer the following options to build upon this strong foundation in New Jersey: 1. Shorten the training. Developers needed an 18 month time frame to allow for curriculum development and testing, but with the curriculum piloted, a shorter time frame will likely produce the same results, reduce Fellow stress, cost less, and reduce the number of Fellows who encounter life or professional circumstances that hinder performance. 2. Distribute a syllabus. With a curriculum in place, Fellows could benefit from having a syllabus at the beginning of the course that maps out readings and assignments. 3. Pre-schedule group work. Creating a schedule and locations for group work in advance of the program would reduce the stress of participation, help Fellows manage their staff and their supervisors, and increase efficiency. 4. Consider adding a group dynamics mini-lesson. Fellows could benefit from additional guidance on how to work in groups. A mini-lesson might include expectations for group work, suggestions for how to address common group challenges, and the role of coaches in settling group conflict. 5. Continue to use high level facilitators with expertise in child welfare, implementation, management, and data analysis. Implementing programs to change operations and organizational culture requires a wide range of skills. While this report focuses on three challenges, numerous other implementation issues arose. An experienced coaching staff with many types of expertise is needed to fully realize the benefits of the intervention.
Program Outcomes As represented in the program logic model (see Figure 1), the program team identified several outputs and outcomes they hoped Manage by Data would produce. Resources, programmatic considerations and the nature of the outcomes prevented the use of methods that would allow for a precise quantitative calibration of each logic model outcomes (see Appendix A for a discussion of the methods used in this study). The section below highlights three areas that cover multiple outputs and outcomes: developing staff capacity to manage by data, developing a candidate pool for promotion, and establishing a model for data-driven management. We highlight these areas because of their importance to the initiative and the strength of the evidence we collected.
Outcome 1: Developing staff capacity In examining the development of staff capacity, we focus on specific skills that Manage by Data sought to impart as well as the Fellows’ orientation toward their work. We found strong evidence that the initiative increased both these aspects of capacity.
25
On surveys administered during the program Fellows reported strong and steady improvements in the skills they use to manage by data, such as the ability to identify practice issue and trends, set priorities and solve problems (See Appendix B). Six months after graduation, Fellows were asked to reflect on how Manage by Data impacted several skills (See Table 1). In assessing changes in eight skills, on average a quarter of the Fellows reported “tremendous improvement” and 41 percent reported “substantial improvement” while less than ten percent reported no change in their skill levels. On average, almost half the Fellows reported that these skills were “extremely useful” in their day to day work and another quarter reported the skills were “very useful.” Table 1: Changes in Self-Reported Skill Levels among Fellow Graduates (n=81, response rate=87%)
Question 2. Compared to where you started before the Manage by Data training, how have these skills changed? Skill Area Data analysis Graph and chart making Business mapping Problem solving Decision-making Preparing presentation Public speaking/ presentation Working in groups Average for all skills
Tremendous Substantial Some No Missing Total improvement improvement improvement change 33% 48% 16% 3% 0% 100% 40% 40% 19% 3% 0% 100% 22% 44% 24% 10% 0% 100% 17% 40% 36% 6% 1% 100% 19% 42% 35% 3% 3% 100% 31% 40% 24% 5% 1% 100% 24% 40% 21% 15% 1% 100% 14% 37% 30% 17% 3% 100% 25% 41% 25% 8% 1% 100%
Improvements in skills were readily observed. Many Fellows began the program, for example, with obvious weaknesses in presenting information and public speaking. At baseline, many Fellows turned their backs to their audience while presenting, made limited eye contact, spoke in soft or choppy voices, read off note cards with their heads bowed and were clearly nervous in speaking in front of small groups of peers. Transitions between group members during presentations were often stilted. At the leadership summits 11 and 17 months later, Fellows made smooth, easily understood presentations to audiences of approximately two hundred people. Presentations were made in teams, with 20-40 Fellows presenting during the course of each summit. Virtually all Fellows held eye contact, presented in strong, confident voices and spoke from memory. Reflecting expressions made by many summit attendees, one senior manager commented, “I am so impressed with my staff. To see them get up and present this data so professionally and so well, I am just so impressed. [The facilitators] have… made them into presenters.”
26
Fellows reported strong gains in skills. The vast majority of survey comments at program end focused on Fellow support for and learning in the program. One Fellow reported learning more in Manage by Data than in her Master’s in Social Work program. The comments below are representative: It has been a valuable experience and I have grown professionally and personally. I have learned so much and have really pushed myself out of my comfort zone. Besides the coursework, the under layers of the knowledge such as working in groups, networking, having "working lunches" and overall leadership training has been priceless…I plan to continue to use what I learned in my career at DCF. …the program has definitely helped me think of better ways to present data and to engage the people that we’re presenting it to and just package it in a way that is more easily digestible and to find the right motivators for people and make all those numbers make sense. Orientation toward data-driven management: At the start of the program, many Fellows reported skepticism and frustration with NJDCF’s use of data as a managerial tool. Most Fellows reported using only data in SPIRIT and SafeMeasures when making decisions. By graduation, Fellows reported using a broader variety of data, greater confidence in the data they used, and a stronger belief in NJDCF’s commitment to data driven management. There were also striking changes in the way many Fellows discussed using data-driven management techniques. For many participants, the Manage by Data program provided a new way to approach their work: I learned a different way to attack issues, issues in my office and in my county, from an angle that I never even thought was possible. I never thought that it was useful looking at the issues from a statistical, from a data point of view. Going in I wasn’t interested in numbers at all. I thought that numbers came out of the sky somewhere…Now I know where they come from, how to compile them, how to analyze them, and what changes you can make taking information from the data. This program has changed my conversation with my staff, and that was a modeling and learning thing. When I conference a case with my supervisors, when I talk about our staffing issues or caseloads, my conversation is different and so they are cuing off of my conversation and looking at things differently as well. And I think that’s how people learn. Fellow attitudes toward data driven management morphed from generally skeptical at baseline to enthusiastic at graduation and remained so six months after the program finished. One Fellow, expressing a common theme, said that he did not believe in using data at the beginning of the program and rarely examined the management reports that he received. At program end, he commented, “When staff bring me a problem, the first thing I say is ‘show me the data, show me the data.’” In focus groups and seminars, Fellows described several instances of working discussions of data into their interactions with supervisees and colleagues.
27
Outcome 2: Developing a candidate pool for promotion The program team hoped that Manage by Data would enhance the managerial and data skills of the candidate pool available for promotion. NJDCF was especially interested in developing the candidate pool because a large number of senior staff were approaching retirement age. Seeding the pool with staff knowledgeable and committed to data driven management was an opportunity to re-orient the practice of a large number of future senior managers. Manage by Data played no role in personnel decisions; instead the program aimed to provide Fellows with skills and experiences that would make them stronger candidates for promotions. Forty of the 93 Fellows (43%) were promoted during the program. While researchers did not examine the circumstances of individual promotions, we believe three factors—in addition to the capacities of individual Fellows—contributed to the high rate of promotion. The confluence of leadership summits, ChildStat and the skills demonstrated by Fellows. Near the time Manage by Data launched, NJDCF instituted a “ChildStat” program. Modeled after the New York City Police Department’s vaunted CompStat process, ChildStat requires staff to make regular data-centered presentations to senior agency leaders.23 Preparing for ChildStat required local office managers, Area Directors and their staff to use data to assess their district’s performance and outline plans to address performance issues that arose in their analysis. The skillset required to prepare effectively for ChildStat overlapped with the skills practiced in the Fellows program. Many Fellows reported participating in ChildStat preparation sessions and some said that they were the primary authors of ChildStat presentations. Combined with opportunities to present to management and senior executives in leadership summits, Fellows had multiple opportunities to show their talents to those who could promote them. Though operationally and financially separate from Manage by Data, the presence of ChildStat increased the value of the skills Fellows learned to their supervisors and others in a position to promote them. Manage by Data Reputation: The program developed a strong reputation with NJDCF. Area Directors and other senior staff that did not have staff in the Fellows program started to ask about opportunities for their staff to participate. It’s reasonable to believe that the program’s high profile and strong reputation made managers feel comfortable promoting Fellows. As one Fellow commented, “I received a new position during this project and I feel that I was able to stand out from the rest due to my involvement in this project.” Selection: The selection process attracted high performers. While applications to become a Manage by Data Fellow were voluntary, many Fellows reported that their supervisors urged them to apply. Manage by Data facilitators reported that many of the staff coming into the program were seen as high performers. Thus, many Fellows may have been in contention for promotions when they entered the program and their participation further heightened chances for promotion.
Outcome 3: Establishing a model for data driven management The program team hoped Manage by Data would establish a common understanding of data driven management. To establish a model for data driven management requires developing a common understanding of the concepts and process of the practice, as well as a common 23
For a description of CompStat, see Eli B. Silverman. 1999. NYPD Battles Crime: Innovative Strategies in Policing. Northeastern Press: Boston, MA.
28
language to describe these concepts and processes. The example above of the Fellows’ work on response priority in Area Office 1 showed how the Manage by Data model was used in practice and boiled the model down to three steps—diagnosing the problem, developing solutions, and tracking and adjusting during implementation. There is strong evidence that the majority of Fellows mastered the strategies and skills taught by the program, believe they are useful in their work, and continue to practice the model six months after they graduated. There are also signs, however, that there is more work to do in transmitting the model to managers, colleagues, and front line staff across the agency. Fellows’ in-program use of the model: The research team observed a remarkable consistency in the manner in which the teams of Fellows carried out each of the 19 projects that were part of the Manage by Data initiative and the language the Fellows used in describing their work. This consistency was also reflected in the presentations the teams of Fellows produced, though not all projects reached the same stage at graduation. The evidence to support this conclusion rests primarily on our observations and review of the presentations themselves. While future research might use a “fidelity checklist” in assessing the development of the model, Manage by Data was a pilot program. A second example from the Fellows projects, however, shows some of the common steps Fellows followed in carrying out their projects. Two groups totaling 11 Fellows focused on identifying ways to improve the frequency and quality of visits between parents and their children in foster care. The Manage by Data curriculum used parent-child visitation as an illustration of a “leverage metric,” an indicator of practice that is associated with several other areas of practice.24 The curriculum also included a seminar in which Fellows mapped the business process of arranging parent-child visits—or what the Fellows renamed “family time.” The business process mapping exercise showed the numerous steps needed for a visit to take place, from individual phone calls and contacts with parents, foster parents, and the children themselves to arranging space, transportation, supervision, background checks and more. The exercise showed how a delay in any one step of the process reduced the odds that a visit would take place. That leadership selected parent-child visitation as a topic for the Manage by Data program came as no surprise: the June 2011 court monitor’s report indicated that only 34 percent of required parent-child visits took place. Diagnosing the problem: Continuing the diagnostic work started in the business mapping seminar, the family time project teams conducted interviews and focus groups with staff for arranging and monitoring visits. The Fellows also examined performance data from several offices, with some Fellows concentrating on “bright spots,” including two offices where visit rates exceeded 80 percent. The teams reviewed policy documents, contracts, and delved further into actual cases recorded in New Jersey SPIRIT. A sample of cases from an office showed that many more visits took place than were documented in ways that SafeMeasures, and thus the
24
Increases in the rate of parent-child visits, for example, are associated with higher rates of reunification, shorter stays in foster care, and more enduring reunification. See Amber Weintraub. 2008. Information Packet on ParentChild Visiting. National Resource Center for Family Centered Practice and Permanency Planning: New York, NY. Available at http://www.hunter.cuny.edu/socwork/nrcfcpp/downloads/information_packets/ParentChild_Visiting.pdf, last accessed June 5, 2013.
29
court monitor, would capture in quantitative reports. Documentation alone, however, explained only part of the low rate of visitation. The Fellows identified several additional issues. Some contracts with service providers restricted family time to standard office hours (9am to 5pm, Monday through Friday), limiting opportunities for working parents and school age children to participate in visits. Some visit sites were far away from public transit, a critical factor when serving an impoverished clientele with low rates of car ownership. Despite a written policy that promoted unsupervised visitation in the least restrictive environment, a sample of cases from one local office showed that over half of the visits were supervised and two-thirds took place in an office instead of a home. The Fellows conducted further diagnostic work on the quality of visits. Developing solutions; Drawing on their diagnostic work, Fellows developed several action steps to improve the frequency and quality of family time. One action step focused on “contracting wisely and well” by mandating weekend and evening hours at visitation centers and including accessibility by public transit as a factor in evaluating proposals for visitation centers. As in Area Office 1’s response priority work, another action step focused on teaching staff how to properly document visits—starting with why family time is important to fulfilling the mission of the agency. Other action steps focused on coaching staff to recognize and improve the quality of visits, simplifying measures of family time, and making family time a priority. Track and adjust: As part of an action step aimed at simplifying measures related to family time, Fellows developed charts that could be used as tools to help workers and supervisors “track and adjust” family time performance. Some projects reached the implementation stage during the program and showed early indications of improving performance by the end of the Fellows program while other projects, including the family time project, had defined action steps but had not yet started implementation at graduation. The family time teams presented their diagnostics and action steps to leadership at the final summit meeting. The summit included Fellows’ presentations on delayed permanency (children in care longer than 3 years), family engagement, institutional abuse investigations, and frequently encountered families. The presentations did not use a template and while some presentations were stronger than others, each demonstrated the use of a consistent set of concepts, language and processes. Fellows’ use of the model post-graduation: Many initiatives show changes that fade after the program ends. To examine the “stickiness” of the initiative—whether the approach taught in Manage by Data stayed with the Fellows after the program ended and in the absence of coaches and protected time—this evaluation included a survey of Fellows six months after graduation. Of the 93 Fellows graduates, 81 responded (87%). One measure of the program’s impact is how useful Fellows’ find the techniques they learned in their day-to-day work at follow up. On average, nine of every 10 Fellows said the techniques were at “very useful” or “extremely useful” in their work (see Table 2).
30
Another measure that a model has been established is the degree to which participants take actions consistent with the model after the program ends. For Manage by Data, this measure needs to be understood in a context. After graduation, regular meetings of Fellow teams ceased, protected time for Fellows ended, and the formal coaching and Resource Fellow supports were removed. Managers were not required to help Fellows carry out project action steps. Table 2: Fellows Assessment of Strategies at Follow-up (n=81, response rate=87%)
Question 3. How useful in your work are each of the following strategies that are taught in the Manage by Data program? Answer choices Extremely useful Very useful Useful Not useful Missing Total
Diagnosing performance issues 51%
Looking for bright spots 62%
Making action plans 43%
Setting targets 42%
Tracking and adjusting 49%
37% 11% 0% 1% 100%
32% 5% 0% 1% 100%
41% 14% 1% 1% 100%
42% 15% 0% 1% 100%
38% 9% 0% 4% 100%
Nonetheless, six months after graduation, almost 80 percent of respondents reported that at least some of their project action steps had been implemented. Nineteen percent reported that all or most of the action steps had been implemented. Thirty-six percent reported that all or most of the action steps will be implemented within the next six months. Two other measures also support the conclusion that the model is firmly established among the Fellows. The follow-up survey indicated that almost half of Fellow respondents reported starting a new project using Manage by Data techniques in the six months following graduation and another sixth reported concrete plans to start a new project in the next three months (see Table 3). In addition, eighty percent of Fellows reported feeling either confident or very confident that they could carry out a Manage by Data project without the help of program facilitators. The follow-up survey also asked Fellows to write reflections on the program. The vast majority of Fellows continued to express the strong support for the initiative that was seen in previous surveys. The comment below is typical: I believe that the Manage by Data initiative will by far be the most effective method to "change" the status quo thinking and allow for real progress and sound practices throughout the Department. Developing those employees who are striving for real change will not only want to be a part of this initiative but also will be the best poised to lead in various capacities throughout the Department.
31
In sum, the follow up survey results provide solid evidence of a sustained commitment to, and use of, the Manage by Data model among the Fellows as a group. Table 3: Fellows Starting of New Manage by Data Projects at Follow-up (n=81, response rate=87%)
Question 9. Have you started a new project using Manage by Data techniques since the end of the program? Answer choices
No. 39 26
Percent 48% 32%
Not yet, but I have a concrete plan to do so in the next three months
13
16%
Missing
3
4%
81
100%
Yes No
Total
Challenges to establishing an agency wide model: The program’s “middle out” strategy included the premise that Manage by Data would help spur the agency as a whole to embrace a datadriven management model. We did not conduct an agency-wide survey and examine a random set of offices to see how they used data before and after the initiative, so our conclusions are tentative. The follow-up survey responses from Fellows provide some information on what’s needed to sustain the momentum generated during the initiative’s first 18 months. Two challenges stand out: supporting graduates and strengthening office teams. Supporting graduates: Fellows identified needing more support in communicating the value of managing by data to supervisees and in practicing data-driven management while meeting other obligations. Many Fellows reported challenges transmitting the lessons of Manage by Data to more junior staff who had not participated in the program. The following comment is representative: “I think we need help in communicating to frontline staff how this benefits them for them to want to have anything to do with it…I’m not sure that I know when I leave here in June how I’m actually going to reach the workers on that level.” At follow-up, Fellows reported the highest levels of support from leadership and their supervisors, and less support from their office peers and the people they supervised (see Table 4). While 86% of Fellows agreed or strongly agreed that NJDCF leadership support their efforts, the number falls to 64% among peers and 62% among supervisees.
32
Table 4: Fellows Reported Level of Support by Position at Follow-up (n=81, response rate=87%)
Question 5. How much do you agree or disagree with the following statements regarding your efforts to apply the strategies taught in the Manage by Data program: Who supports my efforts? Answer choices Strongly agree Agree Neither agree nor disagree Disagree Strongly disagree Missing Total
NJDCF leadership 46% 43% 10% 1% 0% 0% 100%
My supervisor 46% 40% 10% 4% 1% 0% 100%
My peers 25% 49% 21% 3% 3% 0% 100%
The staff I supervise 25% 37% 25% 3% 3% 9% 100%
Note: Totals may not add up to 100% due to rounding.
Many Fellows reported feeling squeezed between meeting their job responsibilities and carrying out action steps or starting new manage by data projects—and this was related to their struggles with persuading front line staff to buy into the value of data. As one commented: The work we do here is very crisis oriented, so it is very difficult for case carrying staff (supervisors, casework supervisors and LOM's) to follow through with projects when there are constant demands for our attention from workers and families. And yet, without involvement and buy in from that staff, manage by data projects are less likely to be meaningful/successful because the staff actually doing the work don't have ownership/input. While leadership endorsed the general work of the Fellows, often in glowing terms, Fellows recommended that leadership make explicit decisions about their priorities in implementing action steps—and allocate the time and resources that Fellows needed to execute, track and adjust. In a few instances, Fellows expressed frustration that the projects they completed in the Fellows program had not been piloted. Others felt that after graduation they had few opportunities to use their newly acquired skills. Ironically, Fellows promotions occasionally created obstacles to executing project action steps. At NJDCF, as in many organizations, people who advance usually take up their new positions at different offices. As a result, promotions put Manage by Data projects in an office at risk. The five Fellows of one project team, for example, were all promoted and thus dispersed to different offices and locations. Promotion or transfers might interfere less with carrying out action plans when other staff can easily fill the role of the person moving to another position. In other words, if there were stronger teams of staff with the capacity to manage by data in the district offices— an ambition of the Manage by Data initiative.
Strengthening office teams: Throughout the program, Fellows rated themselves much higher on Manage by Data skills such as identifying practice issues and problem solving in comparison to the offices in which they worked. For example, only three percent of Fellows reported that their offices were “Excellent” at identifying trends at baseline and that number rose to just 11 percent by the end of the program. While the self-reported nature of this data might explain some of these results, Fellows also reported feeling isolated from other office staff in their efforts to manage by data. One Fellow remarked that “Implementation of the action steps has been left up to the individual Fellows and I feel one person cannot change the entire culture of the office without ongoing support.” Another commented, “Working independently and outside any project that is sanctioned by Central Office is a challenge. I am moving forward, but it I am doing it mostly alone.” Many Fellows recommended ways to keep the Fellows group in contact with each other. Some suggested an online newsletter for activities, others wanted quarterly meetings to discuss challenges and solutions, and some suggested regular refresher courses. The most common Fellow recommendation was that more NJDCF staff needed Manage by Data. Fellows did not agree on which staff needed the program most, with options ranging from caseworkers to mandating that all supervisory and leadership staff be required to take Manage by Data or a similar program.
Outcomes Summary and Discussion The accomplishments of the first class of Fellows are impressive. Very few child welfare management initiatives can point to overwhelming enthusiasm among participants, strong evidence of substantial skills improvement, repeated acknowledgement by senior executives and external stakeholders over long periods, and examples of measurable and sustained results in performance metrics. That child welfare evaluations are so often characterized by failure makes the positive findings from this study that much more striking. The findings from the study also raise some important questions. While Fellows recommended expanding the program to staff at all levels, child welfare agencies have limited resources for Manage by Data or similar initiatives. At what staff level should those resources be targeted? How many staff will constitute a critical mass of staff such that data-driven management becomes firmly established across an agency? What actions might help ensure that a “middle out” strategy is sustainable? Three lessons from the New Jersey experience provide insight into these challenging questions. Produce a critical mass of Fellows: Despite the success of the first round of Manage by Data, one round of Manage by Data is not enough to provoke deep and sustained changes in organizational culture. Such a change will require offices to have a “critical mass” of staff using data driven management techniques so that the model becomes fully aligned with how work is done at NJDCF. A “middle out” strategy is not a discrete event, but requires a long term commitment to staff development. Developing a better understanding of the number of trained staff needed for an office or agency culture to firmly establish new ways of managing is a topic for future research. 34
Recognizing the need to continue to build staff capacity, NJDCF authorized a second round of 40 Fellows in the fall of 2012. Building on the lessons learned in the first round and recommendation from this study, the program team condensed the program to nine months and focused the Fellows on fewer project topics. These adaptations were designed to improve the work/program balance among Fellows and to focus the efforts of coaches. In addition, the program team scheduled all project team meetings in advance and is conducting seminars in one centrally located facility instead of the five sites in the original program. These improvements in logistics are designed to improve efficiency and to formalize “protected time” for projects and assignments. NJDCF is exploring ways to provide a third round of the program. Nurture Manage by Data graduates: Even in the streamlined form used in the second round of the Fellows program, Manage by Data represents an enormous investment in each Fellow. If Fellows do not use their skills, or become disaffected, that investment is lost. Exposed to the full responsibilities of their jobs, a significant number of Fellows report struggling to find opportunities to use their newly acquired skills. While in any large group some people will develop greater capacity than others, survey results suggest that the investment in some of the first round Fellows is at risk. Ensuring that Fellows maintain and hone their skills can be challenging. Child welfare agencies face daunting workloads and staff often have multiple priorities. In addition, Fellows lose some of the privileges they previously enjoyed—such as ready access to data and channels to senior staff. Without the spotlight of the Fellows program, an organized and intentional effort needs to be developed to ensure that Fellows do not abandon the new techniques they have learned. To address this issue, NJDCF developed a “Graduate Fellows” program. The initial round of Graduate Fellows included a competitive selection process for 25 slots. Graduate Fellows face far fewer demands than Fellows and are allocated no protected time outside of their direct participation in the program. The majority of Graduate Fellow time is spent working with the new round of Fellows to develop a mentoring relationship. New Jersey leadership could build upon this effort by ensuring that those not in the Graduate Fellows program have opportunities to use their skills. Action plans could receive formal reviews with leadership that indicate whether Fellow action plans will be implemented and the reasons for those decisions. Newsletters, a list serve, and invitations to Fellow events could all nurture the investment that NJDCF has made in the first round of Fellow staff. Integrate Manage by Data into NJDCF: The Northeast and Caribbean Implementation Center provided the federal funds that paid for the facilitators, consultants, and researchers who participated in the delivery and evaluation of the pilot round. Neither NCIC nor other implementation centers are meant to serve as ongoing funding streams to support specific programs. While the streamlining of the second round of Fellows served legitimate programmatic purposes, the adaptions were also made as a conscious effort to reduce cost. Future rounds of Manage by Data will need to be supported by a combination of NJDCF dollars and private funds. Unless the program is more fully integrated into NJDCF, it will continue to be
35
approved on a round-by-round basis—making it vulnerable to budget cuts and the priorities of future administrations. Integrating the program into NJDCF is not a matter of turning over the curriculum to standard trainers. Fellows benefitted from receiving instruction and coaching from facilitators with broad expertise and deep child welfare management experience-both in the substance of the program and in building the program’s reputation. Child welfare trainers in New Jersey and other jurisdictions rarely have executive level child welfare experience. Instead, Manage by Data might be integrated into NJDCF gradually by developing Graduate Fellows as facilitators, supplemented by moderate levels of consultant coaching that might diminish as internal capacity grows. In addition, the findings from several Fellow projects suggest that NJDCF could benefit from strengthening the initial training that new caseworkers receive concerning the role that managing by data plays in the agency. While workers receive training on New Jersey SPIRIT during their orientation to NJDCF, a refresher course conducted after workers have had several months on the job—and a better understanding of what they need to know to use SPIRIT effectively—might lead to higher quality data and make new staff more receptive to data-driven management strategies.
Options to Consider for Replication As Peter Drucker notes in the quote at the beginning of this report, turning data into information is one of the key management challenges of the 21st century. There is widespread agreement among child welfare experts that developing data driven capacity is critical to meeting the child welfare field’s mission of enhancing safety, permanency and well-being. We recommend Manage by Data as a promising practice for developing this capacity. This research has many implications for sites considering replicating Manage by Data. Below we focus on three lessons that agencies take into consideration: Make a firm commitment to data-driven management. To launch Manage by Data requires support from many parts of a child welfare organization. A general consensus among leaders and management that undertaking the hard work of organizational change is essential. This commitment entails risk. Leaders and managers need to commit to making more data accessible internally and publicly, including data that may prove embarrassing. A commitment from the division responsible for administrative data is especially important, as a Manage by Data program and it’s hoped for result—more frequent and strategic use of data—will place additional burdens on that unit. A firm commitment means taking the steps necessary to produce minimally reliable data. An agency’s data needs to have a minimum level of quality before it can be used to make decisions. Indeed, suspect data will taint diagnostic work and may lead to action plans based on a distorted view of practice. Committing to reliable data does not mean that all data have to be of research quality; it does mean that leadership needs to have a solid understanding of their data’s strengths and weaknesses, and commit to making investments where necessary to improve data quality to a minimal standard. 36
Finally, commitment means that there needs to sufficient funds for the planned effort. A datadriven management initiative will likely require funds that are not normally available to child welfare agencies. Funding may come in the form of federal grants, special authorizations from state or local governments, or private foundations, but at least initially, extra funding will be needed. We list making a firm commitment first in part because dabbling in this type of initiative can hinder future efforts. Skepticism about data and data-driven strategies among child welfare staff is widespread and often well-founded. An initiative of limited duration, that does not have the resources (political and financial) to succeed, or that is criticized when negative performance is discovered may turn this skepticism into cynicism, making future efforts that much more challenging to undertake. Customize the curriculum. Manage by Data succeeded in part because of the curriculum’s direct connection to the work in which the Fellows engaged. Most of the examples and exercises and all of the projects conducted by the Fellows were specific to the challenges faced by New Jersey and used live New Jersey data as opposed to canned datasets. The connection between the curriculum and the Fellows’ lived experiences contributed profoundly to the initiative’s success. The differing history, challenges, laws and practices in other jurisdictions mean that the existing curriculum should not be used “off the shelf.” Use expert facilitators. We recommend using expert facilitators that have significant experience in managing by data in child welfare. Fellows faced numerous and varied challenges in carrying out their projects and needed experienced coaches who knew how to grapple with complex managerial and data issues. Using coaches that had faced many of these issues in their own work also provided a credibility that gave Fellows confidence and helped them stay the course. That credibility extends beyond the Fellows. Leaders undertaking an organizational change initiative need facilitators with standing: who can speak from experience and with confidence about what an agency needs to do to make an initiative successful. These options should not be construed to mean that agencies considering replication must undertake an effort the size of New Jersey’s or not at all. Progress can be made with smaller steps depending on the resources available and the stage of an organization’s development. An agency with little existing capacity might focus initially on a small number of staff, including central office staff, before expanding to district offices. Those with central office capacity might focus initially on one or two district offices as opposed to the whole state. Over the long run, however, the goal needs to be to change organizational practices.
Conclusion The Manage by Data initiative tested a new strategy for developing the capacity of mid-level district office staff to engage in data-driven management. As opposed to traditional “top down” approaches, Manage by Data used a “middle out” strategy aimed at developing capacity among managers situated much closer to the day-to-day work of child welfare. The data gathered for this report indicates that the program had a powerful impact on participants’ skill development 37
and capacity to use data-driven management techniques to test solutions to longstanding child welfare practice issues. Building ways to expand and sustain these gains will be important challenges for NJDCF and child welfare agencies that want to replicate Manage by Data. Many of the participants in Manage by Data are confident that the program will be a crucial part of the agency’s future: An increasing amount of staff will become comfortable with and knowledgeable about the data we use in our everyday work. This will in turn allow the agency to use real time date to provide better outcomes for our children and families based on what we know about them to be true. I think that Manage by Data is here to stay and I feel that it is not only going to impact New Jersey but the country. This is going to be the new way of doing business in child welfare.
38
Bibliography Administration for Children and Families. (2012, August 27). Information Memorandum. Retrieved from http://www.acf.hhs.gov/sites/default/files/cb/im1207.pdf. Allison, G. (1971). Essence of decision: Explaining the Cuban missile crisis. New York, NY: Longman. Annie E. Casey Foundation and the Center for the Study of Social Policy. (2011). Counting is not enough: Investing in qualitative case reviews for practice improvement in child welfare. Baltimore, MD and Washington, DC: Morris-Compton, S., Noonan, K., Notkin, S. Morrison, S., Raimon, M. & Torres, D. Armstrong, M., Bird, C., Alexander-Taylor, L., & Crummy, E. (2012). Managing by Data to Improve Outcomes for Children and Families; DCF Fellows Program 2011-2012 Overview. Unpublished report. Casey Family Programs. (2007). Putting Data to Work to Improve Child Well-Being: A PostConvening Report. Washington, DC. Charlie and Nadine H. v. Jon S. Corzine et al. 2006. No. 99-3678, U.S. District Court Drake, B., & Yadama, G. N. (1996). A structural equation model of burnout and job exit among child protective services workers. Social Work Research, 20(3), 179-187. Furman, A. (2005). The psychology of behavior at work. New York, NY: Routledge Press. Meltzer, J., Joseph, R. M., & Shookhoff, A. (2012). For the Welfare of Children: Lessons Learned from Class Action Litigation. Center for the Study of Social Policy. Moynihan, A., Forgey, M. A., & Harris, D. (2001). Fordham Interdisciplinary Conference-Achieving Justice: Parents and the Child Welfare System: Foreword. Fordham L. Rev., 70, 287. National Child Welfare Resource Center for Organizational Improvement. (2012, October 17). Continuous quality improvement project department structure. Retrieved from http://www.nrcoi.org/CQIproj/cqideptstructure.pdf. National Council on Crime and Delinquency. Analytics. Retrieved from http://nccdglobal.org/analytics/safemeasures. O'Brien, M., & Watson, P. (2002). A Framework for Quality Assurance in Child Welfare. National Child Welfare Resource Center for Organizational Improvement, 400 Congress Street, 5th Floor, Portland, ME.
39
Ross, T. (2005). Program Evaluation in a Democratic Society: The Vera Model. The Evaluation Exchange, 11(3), 5. Ross, T. (2013). The Action Research Approach to Evaluating Child Welfare Programs. Unpublished. Risley-Curtiss, C., McMurtry, S.L., Loren, S., Gustavsson, N., Smith, E., & Faddis, R. (1997). Developing collaborative child welfare educational programs. Public Welfare, Spring, 29-36 Samantrai, K. (1992). Factors in the decision to leave: Retaining social workers with MSWs in public child welfare. Social Work, 37(5), 454-458. Silver, P. T., Poulin, J. E., & Manning, R. C. (1997). Surviving the bureaucracy: The predictors of job satisfaction for the public agency supervisor. The Clinical Supervisor, 15(1), 1-20. Testa, M. & Poertner, J. (2010). Fostering Accountability: Using Evidence to Guide and Improve Child Welfare Policy. Oxford: Oxford University Press. Yin, R. K. (1998). The abridged version of case study research: Design and method. In L. Bickman and D. Rog (Eds.), Handbook of Applied Social Research Methods (229-260). Thousand Oaks, CA: Sage Publications.
40
Appendix A: Research Methods and Instruments Action Research drew on multiple data sources in this study. A mixed methods approach made it possible to obtain feedback from a wide array of stakeholders throughout the duration of the program and to measure change in the various outputs and outcomes identified in the program logic model. The research methodology included: a. Review of key program documents, such as summaries of research conducted by NJDCF, program proposals, the Manage by Data curriculum, public media reports, Data Fellows application materials, forwarded emails, court filings, monitors reports, and other written information. b. Review of administrative data. Action Research received instruction on NJDCF’s Safe Measures software package and reviewed NJDCF administrative data used by the Fellows. c. Observation: Action Research observed each of the 18 monthly seminar sessions at least once, including observing every seminar of one of the five groups. Several of the seminars were observed more than once as they were presented to each of the five groups at different locations. Researchers attended each of the three Manage by Data leadership forums and several program team meetings. d. Ongoing communication with key informants. Action Research was part of informal communication with NJDCF staff, Data Fellows, the program team, NCIC staff and other stakeholders that took place during observations of trainings, the leadership forums and other meetings. e. Interviews with NJDCF staff: Formal interviews were conducted with ten NJDCF senior staff. f. Focus groups with the Fellows: Eleven focus groups of Fellows were conducted. Of the five Fellows groups, focus groups were conducted at baseline and near the end of the program with three groups; at baseline, mid-point, and near the end for one group; and two focus groups near the end of the program for the fifth group. Focus groups consisted of six to ten Fellows. The timing and number of focus groups was based on location and resources. g. Site visit: To learn more about the response priority work of the Area Office 1 Fellows, researchers visited the Area Office and two local offices. As part of the site visit, researchers conducted small group interviews with approximately ten front line staff, the four Fellows involved in the work, and eight supervisors and managers. Front line staff were interviewed separately from supervisors and managers. These activities are not counted in the totals reported above of interviews and focus groups. h. Surveys: Surveys were administered to the Fellows at four time points: baseline (February 2011), midpoint (August 2011), near the end of the program (April 2012) and six months 41
after the program ended (December 2012). Appendix B presents the survey questions from all four waves as well as the results. The response rate for surveys ranged from 87% to 93%. Human Subjects Protection: The study received Institutional Review Board approval from the University of Southern Maine. Informed consent was obtained from all study participants during all research activities. Data handling procedures ensured the protection of confidentiality for all participants. Qualitative Data Analysis: Researchers generated themes from the qualitative data (focus groups and open-ended survey data) using an iterative approach: the responses were read, themes generated, and then the responses were re-read to ensure the accuracy and completeness of the list of themes. To ensure the highest analytical rigor possible, a third researcher who had not spent time in the field conducted a separate analysis for comparison. The themes that emerged from the data sources were consistent across individuals, time periods, groups and data collection methods. Protocols: The instruments used in the focus groups and interviews are presented below. The survey instruments and results are presented in Appendix B.
42
Manage by Data Focus Group Schedule for Data Fellows and Data Analysis Staff [complete informed consent process] [recorder on if consent to record obtained] Thank you for agreeing to participate in this study of the Manage by Data project. 1. Can you each tell me about your work in New Jersey Department of Children and Families? Prompts: a. What are your major responsibilities? b. What makes you satisfied with your job? c. What are your biggest challenges? 2. How did you first hear about the Manage by Data project? Prompts: a. Applied to be a fellow/Commissioner’s announcement? b. Heard about program from a peer? c. Heard about program from a supervisor? 3. What made you decide to apply to become a Data Fellow? [for Data Fellows only] Prompts: a. Improve skills? b. Help attain a better or different job within the New Jersey Department of Children and Families? c. Asked to apply by supervisor? d. Local or Area office needed more data analysis capacity? e. Any other reasons? 4. How do you think being a Data Fellow will improve your work and the work of your office or area? 5. What were your expectations of the program? Prompts: a. More or less demanding on your time than you anticipated? b. More or less demanding on your abilities than you anticipated? c. More or less useful than you anticipated? The program has several features that I would like to ask you about, including instruction, the curriculum, and the homework assignments. 6. How would you describe the topics and content of the training? a. How relevant are the topics to your work? To the work of your office? b. Which topics have been most useful to you? Least useful? Most difficult to understand? 43
c. Are there subjects that you think should be included in the curriculum? Excluded? d. What suggestions do you have for improving the curriculum? 7. How would you describe the assignments that need to be completed outside of class? a. What obstacles have you faced in completing those assignments? b. How much did you learn from the assignments? Which assignments were the most useful? The least useful? c. What suggestions do you have for improving the assignments? 8. How would you describe the quality of instruction? a. What are the aspects of the instruction you like most? The least? b. How well did the instructors communicate the ideas in the training? c. Did instructors encourage you to ask questions? d. Did instructors answer questions in a helpful way? e. What suggestions do you have to improve instruction? f. Did you enjoy the training? 9. How confident are you that you could share knowledge with other staff in the use of the techniques that you have learned? Now I would like to ask you about training going forward. 10. Are there teams of people that work with data in your office or unit? In other words, is there a group of people that routinely examines information and works together to diagnose and troubleshoot problems? a. Do Data Fellows work together on data in your office? b. Do people outside of the Data Fellows program work together on data in your office? c. How did the Manage by Data project impact the use of data in your office? 11. How likely are you to continue using what you have learned in the Data Fellows program once the program is completed? a. How often do you think you will use the skills you learned as a Data Fellow? b. What assets in your unit or office help you use these skills? c. What types of support will help you implement and sustain what you have learned? d. What barriers are there to managing by using data? 12. The Data Fellows program is ending after this series of seminars. a. Has the program on the whole been valuable? b. Do you think there is a need to continue this program or to integrate it into standard training? c. How could the lessons and skills that you are learning be best transferred to others in your local or Area office?
44
d. What opinions do you hear about the Manage by Data program from your colleagues? 13. What recommendations do you have for other child welfare agencies thinking about implementing a Manage by Data approach?
45
Manage by Data Stakeholder Interview Schedule [The structure of this schedule will be used for all stakeholders. Some questions are only appropriate for particular staff, as noted.] [complete informed consent process] [recorder on if consent to record obtained] Thank you for agreeing to participate in this study of the Manage by Data project. 1. Can you tell me about your work in children and family services? Prompts: a. What are your major responsibilities? b. What makes you satisfied with your job? c. What are your biggest challenges? 2. How did you first hear about the Manage by Data project? Prompts: a. Applied to be a fellow/Commissioner’s announcement? b. Participated in design or writing of grant? c. Participated in scan of best practices? d. Work with data analysis group? 3. What has been your role in the project? Prompts: a. Were you involved in the development of the project? b. Did you have input into the curriculum or other aspects of the program? Use of Data Now I would like to ask you a few questions about how you use data in your work. For each question, I would like you to answer for the time before the Manage by Data project and the time after the Manage by Data project. 4. What sources of information were most useful in your work? Prompts: a. Case presentations? b. Meetings with field staff? c. Chapin Hall data analysis d. Child and Family Services Review Data Profile e. Ad Hoc Reports f. Contract and license reports (see list in survey) g. Case file reviews h. Safe Measures i. Other data 5. How was this data used in the course of your work? [ask for real examples throughout] a. Did you generate or consult particular reports for yourself? 46
i. Was it effective? Why or why not? b. Were there particular reports used during staff or “as needed” meetings? i. If so, how did you use this information (to assess the group’s compliance with standards? Performance on desired outcomes? Or for some other purpose?)? ii. Was it effective? iii. Why or why not? c. Were there reports used during individual supervision meetings? i. If so, how did you use the information? Was it effective? Why or why not? Or for some other purpose? 1. Was the information used to reward or punish staff? To assess performance? To develop an improvement plan? Or for some other purpose? 6. How does your use of data vary by the phase of the case? 7. Are there particular types of groups where using data was more effective than others? Why or why not? a. Cases that involved older children? b. Cases that involved children with special needs? c. Cases that involved mental health issues? d. Cases that involved substance use or abuse? e. Cases that involved domestic violence? f. Cases that involved legally free children? g. Other types of cases? Barriers and Facilitators to Using Data The next couple questions ask about how your work environment supports you in using data in your work. 8. What factors hindered/facilitated the use of data in your unit or office’s work? a. Familiarity and comfort with the data available? b. Functioning of computers, software, or other mechanisms to accumulate data? c. Capacity to generate data (from Safe Measures or elsewhere)? d. Ability to interpret data? e. Ability of colleagues to generate and interpret data? f. Other factors? 9. What factors hindered/facilitated the use of data in your own work? a. Familiarity and comfort with the data available? b. Functioning of computers, software, or other mechanisms to accumulate data? c. Capacity to generate data (from Safe Measures or elsewhere)? d. Ability to interpret data? e. Ability of colleagues to generate and interpret data? f. Receptivity of colleagues? g. Other factors?
47
Implementation of the Manage by Data Project Now I will ask you some questions about the implementation of the Manage by Data project. 10. What aspects of the Manage by Data project were most helpful to you? [This will vary by respondent’s job and experience with the program] a. Instructors? b. Identifying trends? c. Problem solving? d. Out of class assignments? e. Development of peer networks? f. Anything else? 11. What aspects of the project were least helpful to you? a. Out of class assignments? b. Timing of sessions? c. Location? d. Content? e. Anything else? 12. What recommendations would you have for implementing this type of initiative in the future? 13. How can New Jersey improve training on the use of data after the Manage by Data project ends? Impact of the Manage by Data Project 14. How has the Manage by Data project changed the way your team uses data? [ask for actual examples] a. Respondent’s individual work? b. In supervision? c. In staff meetings? d. In problem-solving? e. In prioritizing your work? 15. Are management reports integrated into regular leadership team meetings? If so, how? If not, why not? 16. What do you think the next steps are in developing staff capacity at NJ DCF? a. Is there a team in your unit or office that will continue to use data after the project is over? b. How committed do you feel NJ DCF’s leadership is to continuing to use the data and skills emphasized in the Manage by Data project in the future? c. What skills are most likely to becoming embedded in NJ DCF’s work? Least likely? d. Will data be made more or less accessible to NJDCF staff in the future? For respondents who participated in the best practices review: 17. What were the most helpful lessons learned from the best practices review? 48
18. Knowing what you know now, would you have conducted that review differently? How? For Advisory Board members: 19. How did the Advisory Board guide development and implementation of the project? a. What was the most useful advice provided by the Advisory Board? The least useful?
49
Appendix B: Survey Results This appendix presents results of four surveys. The first three surveys used a common instrument and results are presented for each of the three surveys in one table. The fourth survey, conducted at follow up, used a different instrument and results are presented separately.
50
Note: Question 1 asked for informed consent. Question 2. In the course of your work, which of the following quantitative data sources have you used to make a decision in the last six months?
Survey 1
Survey 2
Survey 3
Answer options
Number
Percent
Number
Percent
Number
Percent
Chapin Hall data analysis
7
7.5%
42
46.7%
43
47.8%
Child and Family Services Review Data Profile
23
24.7%
30
33.3%
28
31.1%
Safe Measures
85
91.4%
83
92.2%
85
94.4%
New Jersey SPIRIT
88
94.6%
81
90.0%
89
98.9%
37
39.8%
57
63.3%
58
64.4%
36
38.7%
40
44.4%
44
48.9%
Other (please specify)
11
11.8%
13
14.4%
8
7.7%
Total
93
NA*
90
NA*
90
NA*
Data available on the NJ DCF website Ad hoc Reports distributed at management meetings
*Not applicable. Question 3. How useful is the Safe Measures application in your work? Survey 1
Survey 2
Survey 3
Answer options
Number
Percent
Number
Percent
Number
Percent
Exceptionally useful
36
38.7%
40
44.4%
35
38.9%
Very useful
36
38.7%
30
33.3%
36
40.0%
Often useful
10
10.8%
9
10.0%
9
10.0%
Somewhat useful
5
5.4%
8
8.9%
8
8.9%
Not useful at all
4
4.3%
3
3.3%
2
2.2%
Missing
2
2.2%
0
0%
0
0%
Total
93
100%
90
100%
90
100%
51
Question 4. In the course of your work, which of the following sources of information, other than statistical reports, have you used to make a decision in the last six months?
Survey 1
Survey 2
Survey 3
Answer options
Number
Percent
Number
Percent
Number
Percent
Contract reports
31
33.3%
33
36.7%
36
40.0%
Licensing reports
24
25.8%
21
23.3%
22
24.4%
Verbal reports
71
76.3%
64
71.1%
76
84.4%
Case file reviews
83
89.2%
79
87.8%
83
92.2%
Other data
16
17.2%
12
13.3%
13
14.4%
Total
93
NA*
90
NA*
90
NA*
*Not applicable. Question 5. I am answering these questions about my: Survey 1
Survey 2
Survey 3
Answer options
Number
Percent
Number
Percent
Number
Percent
Unit
37
39.8%
35
39.3%
33
36.7%
Office
43
46.2%
43
48.3%
46
51.1%
Other
12
12.9%
10
11.2%
10
11.1%
Missing
1
1.1%
1
1.1%
1
1.1%
Total
93
100%
89
100%
90
100%
52
Question 6. Describe your general ability to use data to accomplish the following tasks on 1 to 5 scale: 1(poor), 2(fair), 3(good), 4(very good), 5 (excellent) Survey 1
Survey 2
Survey 3
Survey 1
Survey 2
Survey 3
Answer options
Identifying practice issues (%)
Problem solving (%)
Poor (1)
1.1
.0
.0
2.2
.0
.0
Fair (2)
4.3
5.6
4.4
9.7
4.5
1.1
Good (3)
20.4
23.3
14.4
29.0
25.8
21.3
Very good (4)
45.2
41.1
43.3
43.0
49.4
44.9
Excellent (5)
26.9
27.8
36.7
14.0
20.2
31.5
Missing/invalid
2.2
1.1
1.1
2.2
.0
1.1
Total %
100
100
100
100
100
100
Respondents
93
89
90
93
89
89
Mean
3.95
4.00
4.08
3.58
3.85
4.02
Survey 1
Survey 2
Survey 3
Survey 1
Survey 2
Survey 3
Answer options
Setting priorities (%)
Identifying trends (%)
Poor (1)
1.1
.0
1.1
1.1
.0
.0
Fair (2)
10.8
2.2
4.5
9.7
5.6
2.2
Good (3)
19.4
22.5
13.5
30.1
38.2
12.2
Very good (4)
46.2
51.7
33.7
45.2
42.7
45.6
Excellent (5)
20.4
23.6
46.1
11.8
13.5
38.9
Missing/invalid
2.2
.0
1.1
2.2
.0
1.1
Total %
100
100
100
100
100
100
Respondents
93
89
89
93
89
90
Mean
3.76
3.97
4.15
3.58
3.64
4.17
53
Question 7. Describe your unit or office's ability to use data to accomplish the following tasks on a 1 to 5 scale: 1 (poor), 2 (fair), 3 (good), 4 (very good), 5 (excellent) Survey 1
Survey 2
Survey 3
Survey 1
Survey 2
Survey 3
Answer options
Identifying practice issues (%)
Problem solving (%)
Poor (1)
9.7
9.0
6.7
9.8
11.2
9.0
Fair (2)
25.8
28.1
18.9
34.8
31.5
21.3
Good (3)
38.7
29.2
35.6
35.9
25.8
30.3
Very good (4)
18.3
19.1
27.8
14.1
18.0
28.1
Excellent (5)
5.4
13.5
8.9
3.3
12.4
7.9
Missing/invalid
2.2
1.1
2.2
2.2
1.1
3.3
Total %
100
100
100
100
100
100
Respondents
93
89
90
93
89
89
Mean
2.91
2.98
3.17
2.66
2.86
3.16
Survey 1
Survey 2
Survey 3
Survey 1
Survey 2
Survey 3
Answer options
Setting priorities (%)
Poor (1)
7.5
7.9
Fair (2)
23.7
21.3
Good (3)
39.8
31.5
Very good (4)
18.3
23.6
Excellent (5)
8.6
13.5
Missing/invalid
2.2
Total %
Identifying trends (%) 4.5
9.7
12.4
7.8
36.6
24.7
23.3
25.8
32.6
30.0
20.4
16.9
25.6
11.2
3.2
12.4
11.1
1.1
2.2
4.3
1.1
2.2
100
100
100
100
100
100
Respondents
93
89
89
93
89
90
Mean
2.97
3.14
3.27
2.86
2.90
3.12
22.5 27.0 32.6
54
Question 8. Do you agree or disagree with the following statement: There is a team of people in my unit or office who are skilled in the use of data? Survey 1
Survey 2
Survey 3
Answer options
Number
Percent
Number
Percent
Number
Percent
Strongly agree
13
14.0%
11
12.4%
21
23.3%
Agree
39
41.9%
49
55.1%
51
56.7%
Disagree
35
37.6%
24
27.0%
15
16.7%
Strongly disagree
3
3.2%
3
3.4%
2
2.2%
Not sure
2
2.2%
2
2.2%
0
0%
Missing
1
1.1%
0
0%
1
1.1%
Total
93
100%
89
100%
90
100%
Question 9. Does your unit or office hold regular staff meetings? Survey 1
Survey 2
Survey 3
Answer Options
Number
Percent
Number
Percent
Number
Percent
Yes
87
93.5%
85
95.5%
83
92.2%
No
4
4.3%
4
4.5%
6
6.7%
Missing
2
2.2%
0
0%
1
1.1%
Total
93
100%
89
100%
90
100%
55
Question 10. If so, how often does your unit or office hold staff meetings? Survey 1
Survey 2
Survey 3
Answer Options
Number
Percent
Number
Percent
Number
Percent
Once a week
2
2.2%
3
3.4%
0
0%
Once every two weeks
7
7.5%
6
6.7%
3
3.3%
Once a month
72
77.4%
74
83.1%
76
84.4%
Once every two months
3
3.2%
2
2.2%
2
2.2%
Quarterly
6
6.5%
3
3.4%
5
5.6%
Rarely or never
2
2.2%
1
1.1%
1
1.1%
Missing
1
1.1%
0
0%
3
3.3%
Total
93
100%
89
100%
90
100%
Question 11. Over the past six months, how frequently are charts, tables, graphs, performance indicators and other types of data with numbers used in your UNIT or OFFICE staff meetings? Survey 1
Survey 2
Survey 3
Answer Options
Number
Percent
Number
Percent
Number
Percent
Once a week
29
31.2%
22
24.7%
29
32.2%
Once every two weeks
19
20.4%
26
29.2%
24
26.7%
Once a month
21
22.6%
17
19.1%
13
14.4%
Once every two months
14
15.1%
16
18.0%
13
14.4%
Quarterly
6
6.5%
6
6.7%
7
7.8%
Rarely or never
3
3.3%
1
1.1%
2
2.2%
Missing
1
1.1%
1
1.1%
1
1.1%
Total
93
100%
89
100%
90
100%
56
Question 12. Over the past six months, how frequently are case file reviews, case notes, and other types of data that do not rely on numbers used in your UNIT or OFFICE staff meetings? Survey 1
Survey 2
Survey 3
Answer Options
Number
Percent
Number
Percent
Number
Percent
Once a week
12
12.9%
9
10.1%
15
16.7%
Once every two weeks
18
19.4%
30
33.7%
23
25.6%
Once a month
25
26.9%
22
24.7%
28
31.1%
Once every two months
25
26.9%
17
19.1%
14
15.6%
Quarterly
7
7.5%
5
5.6%
4
4.4%
Rarely or never
5
5.4%
4
4.5%
3
3.3%
Missing
1
1.1%
2
2.2%
3
3.3%
Total
93
100%
89
100%
90
100%
Question 13. Over the past six months, how frequently have data been used to DIAGNOSE performance issues in your office? Survey 1
Survey 2
Survey 3
Answer Options
Number
Percent
Number
Percent
Number
Percent
Very frequently
35
37.6%
29
32.6%
32
35.6%
Somewhat frequently
30
32.3%
36
40.4%
34
37.8%
Somewhat infrequently
13
14.0%
15
16.9%
7
7.8%
Infrequently
6
6.5%
6
6.7%
12
13.3%
Never
8
8.6%
2
2.2%
3
3.3%
Missing
1
1.1%
1
1.1%
2
2.2%
Total
93
100%
89
100%
90
100%
57
Question 14. Over the past six months, how frequently have data been used to DEVELOP A STRATEGY to address performance issues in your office? Survey 1
Survey 2
Survey 3
Answer Options
Number
Percent
Number
Percent
Number
Percent
Very frequently
19
20.4%
19
21.3%
21
23.3%
Somewhat frequently
34
36.6%
38
42.7%
41
45.6%
Somewhat infrequently
25
26.9%
20
22.5%
13
14.4%
Infrequently
8
8.6%
8
9.0%
11
12.2%
Never
6
6.5%
4
4.5%
2
2.2%
Missing
1
1.1%
0
0%
2
2.2%
Total
93
100%
89
100%
90
100%
Question 15. The New Jersey Department of Children and Families is committed to using charts, graphs, tables, performance indicators and other data with numbers to manage the agency. Survey 1
Survey 2
Survey3
Answer Options
Number
Percent
Number
Percent
Number
Survey
Strongly agree
33
35.5%
41
46.1%
42
46.7%
Agree
36
38.7%
38
42.7%
36
40.0%
Neutral
22
23.7%
10
11.2%
9
10.0%
Disagree
1
1.1%
0
0%
1
1.1%
Strongly disagree
0
0%
0
0%
0
.0%
Missing
1
1.1%
1
1.1%
2
2.2%
Total
93
100%
89
100%
90
100%
58
Question 16. The New Jersey Department of Children and Families is committed to using information such as qualitative case reviews, contract and license reports, verbal reports and other data that do not rely on numbers to manage the agency. Survey 1
Survey 2
Survey 3
Answer Options
Number
Percent
Number
Percent
Number
Percent
Strongly agree
25
26.9%
28
31.5%
33
36.7%
Agree
38
40.9%
48
53.9%
48
53.3%
Neutral
23
24.7%
13
14.6%
6
6.7%
Disagree
6
6.5%
0
0%
2
2.2%
Strongly disagree
0
0%
0
0%
0
0%
Missing
1
1.1%
0
0%
1
1.1%
Total
93
100%
89
100%
90
100%
Question 17. If I need to access statistical data like reports from Safe Measures to help solve a problem, I am able to access that data myself: Survey 1
Survey 2
Survey3
Answer Options
Number
Percent
Number
Percent
Number
Percent
Very frequently
75
80.6%
75
84.3%
79
87.8%
Frequently
10
10.8%
13
14.6%
7
7.8%
Infrequently
2
2.2%
0
0%
2
2.2%
Very infrequently
2
2.2%
0
0%
1
1.1%
Never
3
3.2%
1
1.1%
0
0%
Missing
1
1.1%
0
0%
1
1.1%
Total
93
100%
89
100%
90
100%
59
Question 18. If I have a problem accessing statistical data, there is someone available that will access the data for me quickly: Survey 1
Survey 2
Survey 3
Answer Options
Number
Percent
Number
Percent
Number
Percent
Very frequently
27
29.0%
34
38.2%
37
41.1%
Frequently
36
38.7%
33
37.1%
33
36.7%
Infrequently
16
17.2%
12
13.5%
7
7.8%
Very infrequently
6
6.5%
6
6.7%
8
8.9%
Never
6
6.5%
3
3.4%
2
2.2%
Missing
2
2.2%
1
1.1%
3
3.3%
Total
93
100%
89
100%
90
100%
Question 19. If I need to access written data like license or contract reports, or case file reviews, I am able to access that data myself: Survey 1
Survey 2
Survey 3
Answer Options
Number
Percent
Number
Percent
Number
Percent
Very frequently
24
25.8%
25
28.1%
27
30.0%
Frequently
31
33.3%
34
38.2%
35
38.9%
Infrequently
23
24.7%
19
21.3%
17
18.9%
Very infrequently
6
6.5%
5
5.6%
7
7.8%
Never
7
7.5%
5
5.6%
1
1.1%
Missing
2
2.2%
1
1.1%
3
3.3%
Total
93
100%
89
100%
90
100%
60
Question 20. If I have a problem accessing data like license or contract reports, or case file reviews, there is someone available that will access the data for me quickly: Survey 1
Survey 2
Survey 3
Answer Options
Number
Percent
Number
Percent
Number
Percent
Very frequently
18
19.4%
20
22.5%
22
24.4%
Frequently
38
40.9%
42
47.2%
42
46.7%
Infrequently
23
24.7%
18
20.2%
17
18.9%
Very infrequently
7
7.5%
3
3.4%
4
4.4%
Never
5
5.4%
5
5.6%
2
2.2%
Missing
2
2.2%
1
1.1%
3
3.3%
Total
93
100%
89
100%
90
100%
61
SURVEY 4 This survey was conducted six months after the Fellows’ graduation. Eighty-one of the 93 Fellow graduates (87%) completed the survey. Question 1. How useful are the following skills taught in the Manage by Data program in your day to day work? Answer Choices
Data analysis skills
Graph and chart making skills
Business mapping skills
Problem solving skills
Extremely useful
59.3%
37.0%
18.5%
56.8%
Very useful
29.6%
32.1%
27.2%
29.6%
Useful
11.1%
29.6%
40.7%
12.3%
Not useful
0%
1.2%
13.6%
0%
Missing
0%
0%
.0%
1.2%
Total
100%
100%
100%
100%
Answer Choices
Decision-making skills
Preparing presentation skills
Public speaking/ presentation skills
Working in groups
Extremely useful
60.5%
60.5%
55.6%
38.3%
Very useful
25.9%
21.0%
27.2%
23.5%
Useful
12.3%
17.3%
11.1%
32.1%
Not useful
1.2%
1.2%
5.0%
4.9%
Missing
1.2%
0%
1.3%
1.2%
Total
100%
100%
100%
100%
62
Question 2. Compared to where you started before the Manage by Data training, how have these skills changed? Answer choices
Data analysis skills
Graph and chart making skills
Business mapping skills
Problem solving skills
Tremendous improvement
33.3%
39.5%
22.2%
17.3%
Substantial improvement
48.1%
39.5%
44.4%
39.5%
Some improvement
16.0%
18.5%
23.5%
35.8%
No change
2.5%
2.5%
10.0%
6.3%
Missing
0%
0%
0%
1.2%
Total
100%
100%
100%
100%
Answer choices
Decision-making skills
Preparing presentation skills
Public speaking/ presentation skills
Working in groups
Tremendous improvement
18.5%
30.9%
23.5%
13.6%
Substantial improvement
42.0%
39.5%
39.5%
37%
Some improvement
34.6%
23.5%
21%
29.6%
No change
2.5%
4.9%
14.8%
17.3%
Missing
2.5%
1.2%
1.2%
2.5%
Total
100%
100%
100%
100%
63
Question 3. How useful in your work are each of the following strategies that are taught in the Manage by Data program? Looking for bright spots
Making action plans
Setting targets
Tracking and adjusting
Extremely useful
Diagnosing performance issues 50.6%
61.7%
43.2%
42.0%
49.4%
Very useful
37.0%
32.1%
40.7%
42.0%
38.3%
Useful
11.1%
4.9%
13.6%
14.8%
8.6%
Not useful
0%
0%
1.2%
0%
0%
Missing
1.2%
1.2%
1.2%
1.2%
3.7%
Total
100%
100%
100%
100%
100%
Answer choices
Question 4. How much do you agree or disagree with the following statements regarding your efforts to apply the strategies taught in the Manage by Data program: Answer choices
I am able to access the data I need
The quality of the data I need is sufficient
Strongly agree
37.0%
14.8%
Agree
50.6%
53.1%
Neither agree nor disagree
4.9%
18.5%
Disagree
3.7%
11.1%
Strongly disagree
3.7%
2.5%
Total
100%
100%
64
Question 5. How much do you agree or disagree with the following statements regarding your efforts to apply the strategies taught in the Manage by Data program: Who supports my efforts? Answer choices
NJDCF leadership
My supervisor
My peers
The staff I supervise
Strongly agree
45.7%
45.7%
24.7%
24.7%
Agree
43.2%
39.5%
49.4%
37%
Neither agree nor disagree
9.9%
9.9%
21.0%
24.7%
Disagree
1.2%
3.7%
2.5%
2.5%
Strongly disagree
0%
1.2%
2.5%
2.5%
Missing
0%
0%
0%
8.6%
Total
100%
100%
100%
100%
Question 6. How effective do you feel you are in sharing what you learned in Manage by Data with the following group? Answer choices
With my supervisor
With my peers
With the people who report to me
Very effective
28.4%
32.1%
29.6%
Somewhat effective
16.5%
12.3%
18.5%
Effective
50.6%
46.9%
39.5%
Not effective
4.9%
7.4%
4.9%
Missing
0%
1.2%
7.4%
Total
100%
100%
100%
65
Question 7. In your work since the end of the Manage by Data training, how often do you contact? Answer choices
Other Fellows inside my area
Other Fellows outside my area
Resource Fellows or similar person in the central office
Every day
6.2%
0%
0%
Several times in a week
11.15
2.5%
3.7%
Once or twice a month
39.5%
27.2%
14.9%
Less than once a month
25.9%
39.5%
25.9%
Never
13.6%
27.2%
52.0%
Missing
3.7%
3.75
3.7%
Total
100%
100%
100%
Question 8. Looking ahead in the next six months, what statement best describes what you think will happen with the action steps your team developed? Answer choices
Current implementation status
Status 6 months from now
All of the action steps have been implemented
4.9%
12.3%
Most of the action steps have been implemented
13.6%
23.5%
Some of the action steps have been implemented
58.0%
38.3%
None of the action steps have been implemented
17.3%
18.5%
Not applicable
6.2%
7.4%
Total
100%
100%
66
Question 9. Have you started a new project using Manage by Data techniques since the end of the program? Answer choices
Frequency
Percent
Yes
39
48.1%
No
26
32.1%
Not yet, but I have a concrete plan to do so in the next three months
13
16.0%
Missing
3
3.7%
Total
81
100%
Question 10. How confident are you in carrying out a new project without the Manage by Data trainers? Answer choices
Frequency
Percent
Very confident
13
16.0%
Confident
52
64.2%
Not confident
12
14.8%
Missing
4
4.9%
Total
81
100%
67