Int J Software Informatics, Vol.4, No.3, September 2010, pp. 257–275 E-mail:
[email protected] International Journal of Software and Informatics, ISSN 1673-7288 http://www.ijsi.org c °2010 by Institute of Software, Chinese Academy of Sciences. All rights reserved. Tel: +86-10-62661040
Building Fuzzy Thematic Clusters and Mapping Them to Higher Ranks in a Taxonomy∗ Boris Mirkin1,2 , Susana Nascimento3 , Trevor Fenner1 , and Lu´ıs Moniz Pereira3 1 2 3
(Department of Computer Science, Birkbeck University of London, London, UK)
(School of Applied Mathematics and Informatics, Higher School of Economics, Moscow, RF)
(Department of Computer Science and Centre for Artificial Intelligence (CENTRIA), Faculdade de Ciˆ encias e Tecnologia, Universidade Nova de Lisboa, Caparica, Portugal)
Abstract We present a novel methodology for the analysis of activities engaged in an organization such as the research conducted in a University department by mapping them to a related hierarchical taxonomy such as Classification of Computer Subjects by ACM (ACM-CCS). We start by collecting data of activities of the individual components of the organization and present them as the components fuzzy membership profiles over the subjects of the taxonomy. Our method generalizes the profiles in two steps. First step finds fuzzy clusters of taxonomy subjects according to the working of the organization. Second, each cluster is mapped to higher ranks of the taxonomy in a parsimonious way. Each of the steps is formalized and solved in a novel way. We build fuzzy clusters of the taxonomy leaves according to the similarity between individual profiles by using a novel, additive spectral, fuzzy clustering method that involves a number of model-based stopping conditions, in contrast to other methods. As the found clusters are not necessarily consistent with the taxonomy, each is considered as a query set. To lift a query set to higher ranks of the taxonomy, we develop an original recursive algorithm for minimizing a penalty function that involves “head subjects” on the higher ranks of the taxonomy together with their “gaps” and “offshoots”. The method is illustrated by applying it to real-world data. Key words: additive clustering; spectral clustering; fuzzy clustering; parsimonious lift; research activity structure Mirkin B, Nascimento S, Fenner T, Pereira LM. Building fuzzy thematic clusters and mapping them to higher ranks in a taxonomy. Int J Software Informatics, 2010, 4(3): 257–275. http://www.ijsi.org/1673-7288/4/i60.htm
1
Introduction
The last decade has witnessed an unprecedented rise of the concept of ontology as a computationally feasible tool for knowledge management. For example, the usage of Gene Ontology[6] for interpretation and annotation of various gene sets and gene expression data is becoming a matter of routine in bioinformatics (see, for example, * This work has been supported by grant PTDC/EIA/69988/2006 from the Portuguese Foundation for Science & Technology. The support of the individual research project 09-01-0071 “Analysis of relations between spectral and approximation clustering” to BM by the “Science Foundation” Programme of the State University – Higher School of Economics, Moscow RF, is also acknowledged. Corresponding author: Susana Nascimento, Email:
[email protected] Received 2010-10-12; revised 2010-11-07; accepted 2010-11-10
258
International Journal of Software and Informatics, Vol.4, No.3, September 2010
[21] and references therein). Taxonomies, that is, hierarchically organized sets of concepts are an important ingredient of ontologies. The goal of this paper is to develop a framework for representation of the activities of an organization or any other system under consideration, in terms of a taxonomy of the field. We first build profiles for entities constituting the system in terms of the taxonomy topics and then thematically g eneralize them to higher ranks of the taxonomy. To represent a functioning structure over a taxonomy is to indicate those topics in the taxonomy that most fully express the structure’s working in its relation to the taxonomy. To make the representation thematically consistent and parsimonious, we have developed a two-phase generalization approach. The first phase generalizes over the system’s activities by building clusters of taxonomy topics according to the functioning of the system. The second phase takes the clusters as query sets in the taxonomy and parsimoniously maps them to higher ranks of the taxonomy. Both entity profiles and thematic clusters derived at the first phase are fuzzy in order to better reflect the real world objects, so that the mapping method applies to fuzzy clusters. It should be pointed out that both building fuzzy profiles and finding fuzzy clusters are research activities well documented in the literature; yet the issues involved in this project led us to develop original schemes of our own including an efficient method for fuzzy clustering combining the approaches of spectral and approximation clustering[15] . We apply these constructions in two areas: (i) to visualize activities of Computer Science research organizations; and (ii) to discern the complexes of mathematical ideas according to classes taught in regular teaching courses in a university department. We take the popular ACM Computing Classification System (ACM-CCS), a conceptual four-level classification of the Computer Science subject area as a prespecified taxonomy for (i), and the three-layer Mathematics Subject Classification MSC2010 developed by the Mathematical Reviews and Zentralblatt Mathematics editors (see http://www.ams.org/mathscinet/msc/msc2010.html), for (ii). In what follows the focus is mainly on the application (i) to research organizations. The paper is organized as follows. Section 2 describes an e-system we developed for getting fuzzy membership profiles of Computer Science researchers’s activities defined in terms of the leaves of the ACM-CCS taxonomy. Section 3 describes our method FADDI-S for deriving fuzzy clusters from the profiles. Section 3.3 presents an experimental comparison of FADDI-S with other fuzzy clustering methods on real and generated data. Section 4 presents our parsimonious lifting method to map a query set to higher ranks in a taxonomy tree, and Section 5 describes the application of the approach to some real world data. The conclusion and future work are in Section 6. 2 2.1
Taxonomy-Based Profiles ACM-CCS taxonomy and its usage
In the case of investigation of activities of a university department or research center, a research team’s profile can be defined as a fuzzy membership function on the set of leaf-nodes of the taxonomy under consideration so that the memberships reflect the extent of the team’s effort put into corresponding research topics.
Boris Mirkin, et al.: Building fuzzy thematic clusters and mapping them to ...
259
In this case, the ACM Computing Classification System (ACM-CCS)[1] is used as the taxonomy. ACM-CCS comprises eleven major partitions (first-level subjects) such as B. Hardware, D. Software, E. Data, G. Mathematics of Computing, H. Information Systems, etc. These are subdivided into 81 second-level subjects. For example, item I. Computing Methodologies consists of eight subjects including I.1 SYMBOLIC AND ALGEBRAIC MANIPULATION, I.2 ARTIFICIAL INTELLIGENCE, I.5 PATTERN RECOGNITION, etc. They are are further subdivided into third-layer topics as, for instance, I.5 PATTERN RECOGNITION which is represented by seven topics including I.5.3 Clustering, I.5.4 Applications, etc. Taxonomy structures such as the ACM-CCS are used, mainly, as devices for annotation and search for documents or publications in collections such as that on the ACM portal[1] . The ACM-CCS tree has been applied also as: (i) a gold standard for ontologies derived by web mining systems such as the CORDER engine[26] ; (ii) a device for determining the semantic similarity in information retrieval[12] and elearning applications[17, 5] ; and (iii) a device for matching software practitioners’ needs and software researchers’ activities[4] . Here we concentrate on a different application of ACM-CCS – a generalized representation of a Computer Science research organization that can be used for various goals such as: (i) overviewing scientific subjects that are being developed in the organization, (ii) assessing the scientific issues in which the character of activities in organizations does not fit well onto the classification – these can potentially be the growth points, and (iii) help with planning the restructuring of research and investment. 2.2
E-Screen survey tool
Fuzzy membership profiles are derived from either automatic analysis of documents posted on the web by the teams or by explicitly surveying the members of the department. The latter option is especially convenient in situations in which the web contents do not properly reflect the developments, for example, in non-English speaking countries with relatively underdeveloped internet infrastructures for the maintenance of research results. We have developed an interactive survey tool that provides two types of functionality: i) collection of data about ACM-CCS based research profiles of individual members; ii) statistical analysis and visualization of the data and results of the survey on the level of a department. The respondent is asked to select up to six topics among the leaf nodes of the ACM-CCS tree and assign each with a percentage expressing the proportion of the topic in the total of the respondent’s research activity for, say, the past four years. This describes the respondent’s activity fuzzy membership profile. Figure 1 shows a screenshot of the baseline interface for a respondent who has chosen six ACM-CCS topics during her survey session. The set of profiles supplied by respondents forms an N × M matrix F where N is the number of ACM-CCS topics involved in the profiles and M the number of respondents. Each column of F is a fuzzy membership function, rather sharply delineated because only six topics may have positive memberships in each of the columns.
260
International Journal of Software and Informatics, Vol.4, No.3, September 2010
Figure 1.
Screenshot of the interface survey tool for selection of ACM-CCS topics.
3 Representing Research Organization by Fuzzy Clusters of ACM-CCS Topics 3.1
Deriving similarity between ACM-CCS research topics
We represent a research organization by clusters of ACM-CCS topics to reflect thematic communalities between activities of members or teams working on these topics. The clusters are found by analyzing similarities between topics according to their appearances in the profiles. The more profiles contain a pair of topics i and j and the greater the memberships of these topics, the greater is the similarity score for the pair. Consider a set of V individuals (v = 1, 2, · · · , V ), engaged in research over some topics t ∈ T where T is a pre-specified set of scientific subjects. The level of research effort by individual v in developing topic t is evaluated by the membership ftv in profile fv (v = 1, 2, · · · , V ). Then the similarity wtt0 between topics t and t0 is defined as wtt0 =
V X nv ftv ft0 v , n v=1 max
(1)
where the ratios of the number of topics chosen by individual v, nv , and nmax , the maximum nv over all v = 1, 2, · · · , V , are introduced to balance the scores of individuals bearing different numbers of topics. To make the cluster structure in the similarity matrix sharper, we apply the spectral clustering approach to pre-process the similarity matrix W using the socalled Laplacian transformation[11] . First, an N × N diagonal matrix D is defined, P with (t, t) entry equal to dt = t0 ∈T wtt0 , the sum of t’s row of W. Then unnormalized Laplacian and normalized Laplacian are defined by equations L = D − W and Ln = D−1/2 LD−1/2 , respectively. Both matrices are semipositive definite and have zero as the minimum eigenvalue. The minimum non-zero eigenvalues and corresponding eigenvectors of the Laplacian matrices are utilized then as relaxations of combinatorial partition problems[23, 11] . Of comparative properties of these two normalizations, the normalized Laplacian, in general, is considered superior[11] . Since the additive clustering approach described in the next section relies on maximum rather than
Boris Mirkin, et al.: Building fuzzy thematic clusters and mapping them to ...
261
minimum eigenvalues, we use the Laplacian PseudoINverse transformation, Lapin for short, defined by ˜ ˜ −1 Z˜ 0 L+ n (W ) = Z Λ ˜ and Z˜ are defined by the spectral decomposition Ln = ZΛZ 0 of matrix where Λ Ln = D−1/2 (D − W )D−1/2 . To specify these matrices, first, set T 0 of indices of elements corresponding to non-zero elements of Λ is determined, after which the ˜ = Λ(T 0 , T 0 ) and Z˜ = Z(:, T 0 ). The choice of the Lapin matrices are taken as Λ transformation can be explained by the fact that it leaves the eigenvectors of Ln unchanged while inverting the non-zero eigenvalues λ 6= 0 to those 1/λ of L+ n . Then + the maximum eigenvalue of Ln is the inverse of the minimum non-zero eigenvalue λ1 of Ln , corresponding to the same eigenvector. 3.2
Additive-Spectral fuzzy clustering
In spite of the fact that many fuzzy clustering algorithms have been developed already[2, 10] , most of them are ad hoc and, moreover, they all involve manually specified parameters such as the number of clusters or threshold of similarity without providing any guidance for choosing them. We apply a model-based approach of additive clustering, combined with the spectral clustering approach, to develop a novel fuzzy clustering method that is both adequate and supplied with model-based parameters helping to choose the right number of clusters. Thematic similarities att0 between topics are but manifested expressions of some hidden patterns within the organization which can be represented by fuzzy clusters in exactly the same manner as the manifested scores in the definition of the similarity wtt0 (1). We propose to formalize a thematic fuzzy cluster as represented by two items: (i) a membership vector u = (ut ), t ∈ T , such that 0 6 ut 6 1 for all t ∈ T , and (ii) an intensity µ > 0 that expresses the extent of significance of the pattern corresponding to the cluster, within the organization under consideration. With the introduction of the intensity, applied as a scaling factor to u, it is the product µu that is a solution rather than its individual co-factors. Given a value of the product µut , it is impossible to tell which part of it is µ and which ut . To resolve this, we follow a conventional scheme: let us constrain the scale of the membership vector u on a P P constant level, for example, by a condition such as t ut = 1 or t u2t = 1, then the remaining factor will define the value of µ. The latter normalization better suits the criterion implied by our fuzzy clustering method and, thus, is accepted further on. Our additive fuzzy clustering model follows that of [22, 13, 20] and involves K fuzzy clusters that reproduce the pseudo-inverted Laplacian similarities att0 up to additive errors according to the following equations: att0 =
K X
µ2k ukt ukt0 + ett0 ,
(2)
k=1
where uk = (ukt ) is the membership vector of cluster k, and µk its intensity. The item µ2k ukt ukt0 is the product of µk ukt and µk ukt0 expressing participation of t and t0 , respectively, in cluster k. This value adds up to the others to form the similarity att0 between topics t and t0 . The value µ2k summarizes the contribution of the intensity and will be referred to as the cluster’s weight.
262
International Journal of Software and Informatics, Vol.4, No.3, September 2010
To fit the model in (2), we apply the least-squares approach, thus minimizing the sum of all e2tt0 . Since A is definite semi-positive, its first K eigenvalues and corresponding eigenvectors form a solution to this if no constraints on vectors uk are imposed. Additionally, we apply the one-by-one principal component analysis strategy for finding one cluster at a time this makes the computation feasible and is crucial for determining the number of clusters. Specifically, at each step, we consider the problem of minimization of a reduced to one fuzzy cluster least-squares criterion E=
X
(btt0 − ξut ut0 )2
(3)
t,t0 ∈T
with respect to unknown positive ξ weight (so that the intensity µ is the square root of ξ) and fuzzy membership vector u = (ut ), given similarity matrix B = (btt0 ). At the first step, B is taken to be equal to A. Each found cluster changes B by subtracting the contribution of the found cluster (which is additive according to model (2)), so that the residual similarity matrix for obtaining the next cluster is equal to B − µ2 uu0 where µ and u are the intensity and membership vector of the found cluster. In this way, A indeed is additively decomposed according to formula (2) and the number of clusters K can be determined in the process. Let us specify an arbitrary membership vector u and find the value of ξ minimizing criterion (3) at this u by using the first-order optimality condition: P t,t0 ∈T btt0 ut ut0 P ξ=P 2 2 , t∈T ut t0 ∈T ut0 so that the optimal ξ is ξ=
u0 Bu
(4)
2
(u0 u)
which is obviously non-negative if B is semi-positive definite. By putting this ξ in equation (3), we arrive at E=
X t,t0 ∈T
b2tt0 − ξ 2
X
u2t
X
2
u2t0 = S(B) − ξ 2 (u0 u) ,
t0 ∈T
t∈T
P
where S(B) = t,t0 ∈T b2tt0 is the similarity data scatter. Let us denote the last item by µ 2
0
2
G(u) = ξ (u u) =
u0 Bu u0 u
¶2 ,
(5)
so that the similarity data scatter is the sum: S(B) = G(u) + E
(6)
of two parts, G(u), which is explained by cluster (µ, u), and E, which remains unexplained. An optimal cluster, according to (6), is to maximize the explained part G(u) in (5) or its square root
Boris Mirkin, et al.: Building fuzzy thematic clusters and mapping them to ...
g(u) = ξu0 u =
u0 Bu , u0 u
263
(7)
which is the celebrated Rayleigh quotient: its maximum value is the maximum eigenvalue of matrix B, which is reached at its corresponding eigenvector, in the unconstrained problem. This shows that the spectral clustering approach is appropriate for our problem. According to this approach, one should find the maximum eigenvalue λ and corresponding normed eigenvector z for B, [λ, z] = Λ(B), and take its projection to the set of admissible fuzzy membership vectors. Our clustering approach involves a number of model-based criteria for halting the process of sequential extraction of fuzzy clusters. The process stops if either is true: 1. The optimal value of ξ (4) for the spectral fuzzy cluster becomes negative. 2. The contribution of a single extracted cluster to the data scatter becomes too low, less than a pre-specified τ > 0 value. 3. The residual data scatter becomes smaller than a pre-specified ² value, say less than 5% of the original similarity data scatter. The described one-by-one Fuzzy ADDItive-Spectral thematic cluster extraction algorithm is referred to as FADDI-S. It combines three different approaches: additive clustering[22, 13, 20] , spectral clustering[23, 11, 29] , and relational fuzzy clustering[2, 3] and adds an edge to each. In the context of additive clustering, fuzzy approaches were considered only by [20], yet in a very restricted setting: (a) the clusters intensities were assumed constant there, (b) the number of clusters was pre-specified, and (c) the fitting method was very local and computationally intensive - these all restrictions are overcome in FADDI-S. The spectral clustering approach is overtly heuristic, whereas FADDI-S is model-based. The criteria used in relational fuzzy clustering are ad hoc whereas that of FADDI-S is model-based, and, moreover, its combined belongingness function values µu are not constrained by the unity as is the case in relational clustering, but rather follow the scales of the similarity relation under investigation, which is in line with the original approach by L. Zadeh[28] . 3.3
Experimental comparison of FADDI-S with other methods
Fuzzy clustering affinity data The affinity data is a relational similarity data obtained from a feature based dataset using a semi-positive definite kernel, usually the Gaussian one. Specifically, given an N ×V matrix Y = (ytv ), t ∈ T and v = 1, 2, ..., V , non-diagonal elements of the similarity matrix W are defined by equation PV wtt0 = exp(−
v=1 (ytv
− yt0 v )2
2σ 2
),
with the diagonal elements made equal to zero, starting from founding papers[23, 18] . The value ss = 2σ 2 is a user-defined parameter, that is pre-specified to make the resulting similarities wtt0 spread over interval [0,1].
264
International Journal of Software and Informatics, Vol.4, No.3, September 2010
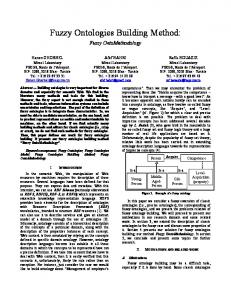
To compare our approach with other methods for fuzzy clustering of affinity data, we pick up an example from a recent paper by Brouwer[3] . This example concerns a two-dimensional data set, that we refer to as Bivariate4, comprising four clusters generated from bivariate spherical normal distributions with the same standard deviation 950 at centers (1000, 1000), (1000,4000), (4000, 1000), and (4000, 4000), respectively. The data forms a cloud presented in Fig. 2.
Figure 2.
Bivariate4: the data of four bivariate clusters generated from Gaussian distributions according to[3] .
This data was analyzed in [3] by using the matrix D of Euclidean distances between the generated points. Five different fuzzy clustering methods have been compared, three of them relational, by Roubens[19] , Windham[24] and NERFCFM[7] , and two of fuzzy c-means (FCM) with different preliminary pre-processing options of the similarity data into the entity-to-feature format, FastMap and SMACOF[3] . Of these five different fuzzy clustering methods, by far the best results have been obtained with method FCM applied to a five-feature set extracted from D with FastMap method[3] . The adjusted Rand index[9] of the correspondence between the generated clusters and those found with the FCM over FastMap method is equal on average, of 10 trials, 0.67 (no standard deviation is reported in [3]). To compare FADDI-S with these, we apply Gaussian kernel to the data generated according to the Bivariate4 scheme and pre-processed by the z-score standardization so that similarities, after z-scoring, are defined as aij = exp(−d2 (yi , yj )/0.5) where d is Euclidean distance. This matrix then is Lapin transformed to the matrix W to which FADDI-S is applied. To be able to perform the computation using a PC MatLab, we reduce the respective sizes of the clusters, 500, 1000, 2000, and 1500 totaling to 5000 entities altogether in [3], tenfold to 50, 100, 200 and 150 totaling to 500 entities. The issue is of doing a full spectral analysis of the square similarity matrices of the entity set sizes, which we fail to do with our PC MatLab versions at a 5000 strong dataset. We also experimented with fivefold and twofold size reductions. This should not much change the results because of the properties of smoothness of the spectral decompositions[8] . Indeed, one may look at a 5000 strong random sample as a combination of two
Boris Mirkin, et al.: Building fuzzy thematic clusters and mapping them to ...
265
2500 strong random samples from the same population. Consider a randomly generated N × 2 data matrix X of N bivariate rows, thus leading to Lapin transformed N × N similarity matrix W . If one doubles the data matrix by replicating X as XX = [X; X], in MatLab notation, which is just a 2N × 2 data matrix consisting of a replica of X under X, then its Lapin transformed similarity matrix will be obviously equal to · WW =
W W
W W
¸
whose eigenvectors are just doubles (z, z) of eigenvectors z of W . If the second part of the double data matrix XX slightly differs from X, due to sampling errors, then the corresponding parts of the doubled similarity matrix and eigenvectors also will slightly differ from those of W W and (z, z). Therefore, the property of stability of spectral clustering results[8] will hold for thus changed parts. This argument equally applies to the case when the original sample is supplemented by four or nine samples from the same population. In our computations, five consecutive FADDI-S clusters have been extracted for each of randomly generated ten Bivariate4 datasets. The very first cluster has been discarded as reflecting just the general connectivity information, and the remaining four were defuzzified into partitions so that every entity is assigned to its maximum membership class. The average values of the Adjusted Rand index, along with the standard deviations at Bivariate4 dataset versions of 500, 1000, and 2500 generated bivariate points are presented in Table 1 for FADDI-S. The results support our view that the data set size is not important if the proportions of the cluster structure are maintained. According to the table, FADDI-S method achieves better results than the ones obtained by the five fuzzy clustering methods reported in [3]. Table 1
Adjusted Rand index values for FADDI-S at different sizes of Bivariate4 dataset
Size
Adjusted Rand index
Standard deviation
500
0.70
0.04
1000
0.70
0.03
2500
0.73
0.01
A remark: The entity-to-feature format of the Bivariate4 data suggests that relational cluster analysis is not necessarily the best way to analyze it; a genuine data clustering method such as K-Means may bring better results. Indeed, an application of the ”intelligent” K-Means method from [12] to the original data size of N = 5000 has brought results with the average adjusted Rand index of 0.75 (the standard deviation 0.045), which is both higher and more consistent than the relational methods applied here and in [3]. Finding community structure The research in finding community structure in ordinary graphs has been a subject of intense research (see, for example, [17, 16, 25, 11]). The graph with a set of vertices T is represented by the similarity matrix A = (att0 ) between graph vertices such that att0 = 1 if t and t0 are connected
266
International Journal of Software and Informatics, Vol.4, No.3, September 2010
by an edge, and att0 = 0, otherwise. Then matrix A is symmetrized by the transformation (A + A0 )/2 after which all diagonal elements are made zero, att = 0 for all t ∈ T . We assume that the graph is connected; otherwise, its connected components are to be treated separately. The spectral relaxation involves subtraction of the “background” random interactions from similarity matrix A = (att0 ). The random interactions are defined with P the same within-row summary values dt = t0 ∈T att0 as those used in Laplace matrices. The random interaction between t and t0 is defined as the product dt dt0 divided by the total number of edges[16] . The modularity criterion is defined as a usual, nonnormalized cut, that is the summary similarity between clusters to be minimized, with thus transformed similarity data[16] . The modularity criterion has proven good in crisp clustering. This approach was extended to fuzzy clustering in the space of the first eigenvectors in [29]. Our approach allows for a straightforward application of FADDI-S algorithm to the network similarity matrix A. It also involves a transformation of the similarity data which is akin to the subtraction of background interactions in the modularity criterion[16] . Indeed we find initially the eigenvector z1 corresponding to the maximum eigenvalue λ1 of A itself. As is well known, this vector is positive because the graph is connected. Thus z1 forms a fuzzy cluster itself, because it is conventionally normed. We do not count it as part of the cluster solution, though, because it expresses just the fact that all the entities are part of the same network. Thus, we proceed to the residual matrix with elements att0 − λ1 z1t z1t0 . We expect the matrix A to be rather ”thin” with respect to the number of positive eigenvalues, which should allow for a natural halting the cluster extracting process when there are no positive eigenvalues at the residual matrix W . We apply the FADDI-S algorithm to Zachary karate club network data, which serves as a prime test bench for community finding algorithms. This ordinary graph consists of 34 vertices, corresponding to members of the club and 78 edges between them - the data and references can be found, for example, in [17, 29]. The members of the club are divided according to their loyalties toward the club’s two prominent individuals: the administrator and instructor. Thus the network is claimed to consist of two communities, with 18 and 16 differently loyal members respectively. Applied to this data, FADDI-S leads to three fuzzy clusters to be taken into account. Indeed, the fourth cluster accounts for just 2.4% of the data scatter, which is less than the inverse of the number of entities τ = 1/34, reasonably suggested as a natural threshold value. Some characteristics of the found solution are presented in Table 2. All the membership values of the first cluster are positive - as mentioned above, this is just the first eigenvector; the positivity means that the network is well connected. The second and third FADDI-S clusters match the claimed structure of the network: they have 16 and 18 positive components, respectively, corresponding to the two observed groupings. Table 2
Characteristics of Karate club clusters found with FADDI-S
Cluster
Contribution, %
λ1
Weight
Intensity
I
29.00
3.36
3.36
1.83
II
4.34
2.49
1.30
1.14
III
4.19
2.00
0.97
0.98
Boris Mirkin, et al.: Building fuzzy thematic clusters and mapping them to ...
267
Let us compare our results with those of a recent spectral fuzzy clustering method developed in [29]. The latter method finds three fuzzy clusters, two of them representing the groupings, though with a substantial overlap between them, and the third, smaller, cluster consisting of members 5,6,7,11,17 of just one of the groupings – see [29], p. 487. We think that this latter cluster may have come up from an eigenvector embracing the members with the largest numbers of connections in the network. It seems for certain that FADDI-S outperforms the method of [29] on Zachary club data. 4
Parsimonious lifting method
To generalize the contents of a thematic cluster, we propose a method for lifting it to higher ranks of the taxonomy so that if all or almost all children of a node in an upper layer belong to the cluster, then the node itself is taken to represent the cluster at this higher level of the ACM-CCS taxonomy (see Fig.3). Depending on the extent of inconsistency between the cluster and the taxonomy, such lifting can be done differently, leading to different portrayals of the cluster on ACM-CCS tree depending on the relative weights of the events taken into account. A major event is the so-called “head subject”, a taxonomy node covering (some of) leaves belonging to the cluster, so that the cluster is represented by a set of head subjects. The penalty of the representation to be minimized is proportional to the number of head subjects so that the smaller that number the better. Yet the head subjects cannot be lifted too high in the tree because of the penalties for associated events, the cluster “gaps” and “offshoots”, where their number depends on the extent of inconsistency of the cluster versus the taxonomy.
Figure 3.
Two clusters of second-layer topics, presented with checked and diagonal-lined
boxes, respectively. The checked box cluster fits within one first-level category (with one gap only), whereas the diagonal line box cluster is dispersed among two categories on the right. The former fits the classification well; the latter does not.
The gaps are head subject’s children topics that are not included in the cluster. An offshoot is a taxonomy leaf node that is a head subject (not lifted). It is not difficult to see that the gaps and offshoots are determined by the head subjects specified in an lifting (see Fig.4). The total count of head subjects, gaps and offshoots, each weighted by both the penalties and leaf memberships, is used for scoring the extent of the cluster misfit needed for lifting a grouping of research topics over the classification tree. The smaller the score, the more parsimonious the lifting and the better the fit. Depending on the relative weighting of gaps, offshoots and multiple head subjects, different liftings can minimize the total misfit, as illustrated in Fig.6 later.
268
International Journal of Software and Informatics, Vol.4, No.3, September 2010
Figure 4.
Three types of features in lifting a subject cluster within taxonomy.
Altogether, the set of topic clusters together with their optimal head subjects, offshoots and gaps constitute a parsimonious representation of the organization. Such a representation can be easily accessed and expressed. It can be further elaborated by highlighting those subjects in which members of the organization have been especially successful (i.e., publication in best journals or awards) or distinguished by a special feature (i.e., industrial use or inclusion in a teaching program). Multiple head subjects and offshoots, when they persist at subject clusters in different organizations, may show some tendencies in the development of the science, that the classification has not taken into account yet. We have proved that a parsimonious lift of a subject cluster can be achieved by recursively building a parsimonious representation for each node of the ACM-CCS tree based on parsimonious representations for its children. In this, we assume that any head subject is automatically present at each of the nodes it covers, unless they are gaps (as presented in Fig. 4). Our algorithm is set as a recursive procedure over the tree starting at leaf nodes. The procedure determines, at each node of the tree, sets of head subject gain and gap events to iteratively raise them to those of the parents, under each of two different assumptions that specify the situation at the parental node. One assumption is that the head subject has been inherited at the parental node from its own parent, and the second assumption is that it has not been inherited but gained in the node only. In the latter case the parental node is labeled as a head subject. Consider the parent-children system as shown in Fig. 5, with each node assigned with sets of gap and head subject gain events under the two inheritance of head subject assumptions.
Figure 5.
Events in a parent-children system according to a parsimonious lift scenario.
Let us denote the total penalty, to be minimized, under the inheritance and noninheritance assumptions by pi and pn , respectively. A lifting result at a given node is defined by a pair of sets (H, G), representing the tree nodes at which events of head subject gains and gaps, respectively, have occurred in the subtree rooted at the
Boris Mirkin, et al.: Building fuzzy thematic clusters and mapping them to ...
269
node. We use (Hi , Gi ) and (Hn , Gn ) to denote lifting results under the inheritance and non-inheritance assumptions, respectively. The algorithm computes parsimonious representations for parental nodes according to the topology of the tree, proceeding from the leaves to the root in the manner which is similar to that described in [14] for a mathematical problem in bioinformatics. For the sake of simplicity, we present only a version of the algorithm for crisp clusters obtained by a defuzzification step. Given a crisp topic cluster S, and penalties h, o and g for being a head subject, offshoot and gap, respectively, the algorithm is initialized as follows. At each leaf l of the tree, either Hn = {l}, if l ∈ S, or Gi = {l}, otherwise. The other three sets are empty. The penalties associated are pi = 0, pn = o if Hn is not empty, that is, if l ∈ S, and pi = g, pn = 0, otherwise. This is obviously a parsimonious arrangement at the leaf level. The recursive step applies to any node t whose children v ∈ V have been assigned with the two couples of H and G sets already (see Figure 5 at which V consists of three children): (Hi (v), Li (v); Hn (v), Ln (v)) along with associated penalties pi (v) and pn (v). (I) Deriving the pair Hi (t) and Gi (t), under the inheritance assumption, the one of the following two cases is to be chosen depending on the cost: (a) The head subject has been lost at t, so that Hi (t) = ∪v∈V Hn (v) and Gi (t) = ∪v∈V Gn (v) ∪ {t}. (Note different indexes, i and n in the latter expression.) The penalty in this case is pi = Σv∈V pn (v) + g; or (b) The head subject has not been lost at t, so that Hi (t) = ∅ (under the assumption that no gain can happen after a loss) and Gi = ∪v∈V Gi (v) with pi = Σv∈V pi (v). The case that corresponds to the minimum of the two pi values is returned then. (II) Deriving the pair Hn (t) and Gn (t), under the non-inheritance assumption, the one of the following two cases is to be chosen that minimizes the penalty pn : (a) The head subject has been gained at t, so that Hn (t) = ∪v∈V Hi (v) ∪ {t} and Gn (t) = ∪v∈V Gi (s) with pn = Σv∈V pi (v) + h; or (b) The head subject has not been gained at t, so that Hn (t) = ∪v∈V Hn (v) and Gn = ∪v∈V Gn (v) with pn = Σv∈V pn (v). After all tree nodes t have been assigned with the two pairs of sets, accept the Hn , Ln and pn at the root. This gives a full account of the events in the tree. This algorithm leads indeed to an optimal representation; its extension to a fuzzy cluster is achieved through using the cluster memberships in computing the penalty values at tree nodes. 5
An Application to a Real World Case
Let us illustrate the approach by using the data from surveys conducted in two Computer Science organizations: (A) the research Centre of Artificial Intelligence, Faculty of Science & Technology, New University of Lisboa (CENTRIA-UNL) and (B) Department of Computer Science and Information Systems, Birkbeck, University of London.
270
International Journal of Software and Informatics, Vol.4, No.3, September 2010
Because one of the organizations, A, is a research center whereas the other, B, is a university department, one should expect that the total number of research topics in A is smaller than that in B, and, similarly, the number of clusters in A should be less than that in B. Indeed, research centers are usually created for a limited set of research goals, whereas university departments must cover a wide range of topics in teaching, which necessarily affects the research efforts. These appear to be true: the number of ACM-CCS topics scored in A is 46 versus 54 in B. With the algorithm FADDI-S applied to the 46 × 46 and 54 × 54 similarity matrices, two fuzzy clusters (in case of Center A) and four fuzzy clusters (in case of Department B) have been sequentially extracted, after which the residual similarity matrix has become definite negative (stopping condition (1) of FADDI-S). To give the reader a feel of the results, the cluster membership values sorted in the descending order are given in Table 3 for the research center A. For each of the topics in the table, we present both its ACM-CCS code and the string attached to it according to ACM-CCS. The sum of clusters’ contributions total to about 50% for center A, and 60% for Department B, which is a good result for clustering. Each of the found clusters are mapped to and lifted in the ACM-CCS tree by applying the cluster lifting procedure with penalties for head subjects (h), offshoots (o) and gaps (g) of: h = 1, o = 0.8, and g = 0.15. We summarize the results for CENTRIA in Tables 4 and 5 showing the parsimonious representation of CENTRIA clusters in terms of head subjects, offshoots, and gaps. Specifically, cluster 1 is of ‘Pattern Recognition’ and ‘Information Systems’ with offshoots including ‘Learning’, ‘Natural Language Processing’, ‘Applications’, ‘Physical Sciences and Engineering’. Cluster 2 is of ‘Mathematics of Computing’ and its offshoots include ‘Mathematical Logics’, ‘General in Artificial Intelligence’, ‘Deduction and theorem proving’ as well as ‘Life and Medical Sciences’. Figure 6 shows the representation of CENTRIA’s cluster 1 in the ACM-CCS taxonomy with penalties of h = 1, o = 0.8, and g = 0.15, in terms of its head subjects, gaps and offshoots (i.e. head subjects that are leafs). The parsimonious representation of the four clusters found at the Department B over the ACM-CCS tree corresponds to head subjects of ‘Software Engineering’ (cluster 1), ‘Computer Applications’ (cluster 2), ‘Data Storage Representations’, ‘General (in Information Systems)’, ‘General (in Computing Methodologies)’ (cluster 3), and ‘Theory of Computing’, ‘Artificial Intelligence’, ‘Pattern Recognition’ (cluster 4). Overall these results are consistent with the informal assessment of the research conducted in each of the research organizations. Moreover, the sets of research topics that have been chosen by individual members at the ESSA survey follow the cluster structure rather closely, falling mostly within one of them. 6
Conclusion
We have proposed a novel method for knowledge generalization that employs a taxonomy tree. The method constructs fuzzy membership profiles of the entities constituting the system under consideration in terms of the taxonomy leaves, and then it generalizes them in two steps. These steps are: (i) fuzzy clustering research topics according to their thematic similarities, ignoring the topology of the taxonomy, and
Boris Mirkin, et al.: Building fuzzy thematic clusters and mapping them to ... Table 3
271
FADDI-S results at data of similarity of research topics in CENTRIA
Cluster 1 Eigenvalue
46.50
Contribution
35.2%
Intensity
5.57
Weight
31.04
Membership
Code
Topic
0.69911
I.5.3
Clustering
0.3512
I.5.4
Applications in I.5 PATTERN RECOGNITION
0.27438
J.2
PHYSICAL SCIENCES AND ENGINEERING (Applications in)
0.1992
I.4.9
Applications in I.4 IMAGE PROCESSING AND COMPUTER VISION
0.1992
I.4.6
Segmentation
0.19721
I.2.6
Learning
0.17478
H.5.2
User Interfaces
0.17478
I.6.4
Model Validation and Analysis in I.6 SIMULATION AND MODELING
0.16689
I.2.7
Natural Language Processing
0.16689
I.5.1
Models in I.5 PATTERN RECOGNITION
0.14453
I.5.2
Design Methodology (Classifiers)
0.13646
H.5.0
General in H.5 INFORMATION INTERFACES AND PRESENTATION
0.13646
H.0
GENERAL in H. Information Systems
0.13646
H.4.0
General in H.4 INFORMATION SYSTEMS APPLICATIONS
0.02867
I.2.11
Distributed Artificial Intelligence
Cluster 2 Contribution
15.2%
Eigenvalue
32.90
Intensity
4.52
Weight
20.41
Membership
Code
Topic
0.46756
J.3
LIFE AND MEDICAL SCIENCES (Applications in)
0.40619
I.2.8
Problem Solving, Control Methods, and Search
0.34435
F.2.1
Numerical Algorithms and Problems
0.32681
F.4.1
Mathematical Logic
0.30067
G.1.6
Optimization
0.25967
D.3.3
Language Constructs and Features
0.23748
G.2.2
Graph Theory
0.18722
G.3
PROBABILITY AND STATISTICS
0.17359
B.2.3
Reliability, Testing, and Fault-Tolerance
0.17359
B.7.3
Reliability and Testing
0.17203
I.2.0
General in I.2 ARTIFICIAL INTELLIGENCE
0.1537
G.1.0
General in G.1 NUMERICAL ANALYSIS
0.11827
I.2.3
Deduction and Theorem Proving
0.10195
G.1.7
Ordinary Differential Equations
0.06175
K.2
HISTORY OF COMPUTING
0.00726
D.1.6
Logic Programming
272
International Journal of Software and Informatics, Vol.4, No.3, September 2010 Table 4
Parsimonious representation of CENTRIA Cluster 1
HEAD SUBJECTS H.
Information Systems
I.5
PATTERN RECOGNITION
I.2.6
Learning
I.2.7
Natural Language Processing
I.4.6
Segmentation
I.4.9
Applications
OFFSHOTS
I.6.4
Model Validation and Analysis
J.2
PHYSICAL SCIENCES AND ENGINEERING
H.1
MODELS AND PRINCIPLES
H.2
DATABASE MANAGEMENT
H.3
INFORMATION STORAGE AND RETRIEVAL
GAPS
H.4.1 Office Automation H.4.2 Types of Systems H.4.3 Communications Applications H.4.m Miscellaneous in H.4 - INFORMATION SYSTEMS APPLICATIONS H.5.1 Multimedia Information Systems H.5.3 Group and Organization Interfaces H.5.4 Hypertext/Hypermedia H.5.5 Sound and Music Computing H.5.m Miscellaneous in H.5 - INFORMATION INTERFACES AND PRESENTATION (e.g., HCI) H.m
MISCELLANEOUS in H. - Information Systems
I.5.0
General in I.5 - PATTERN RECOGNITION
I.5.5
Implementation
I.5.m
Miscellaneous in I.5 - PATTERN RECOGNITION
(ii) lifting clusters mapped to the taxonomy to higher ranked categories in the tree. These generalization steps thus cover both sides of the representation process: the empirical – related to the structure under consideration – and the conceptual – related to the taxonomy hierarchy. Potentially, this approach could lead to a useful instrument for comprehensive visual representation of developments in any field of organized human activities. However, there are a number of issues remaining to be tackled. They relate to all main aspects of the project: (a) data collection, (b) thematic clustering and (c) lifting. On the data collection side, the mainly manual e-survey ESSA tool should be supported by an automated analysis and rating of relevant research documents including those on the internet. The FADDI-S method, although already experimentally proven competitive to a number of existing methods, should be further explored and more thoroughly investigated. The issue of defining right penalty weights for parsimonious cluster lifting should be addressed. Moreover, further investigation should be carried out with respect to the extension of this approach to more complex than taxonomy, ontology structures.
Boris Mirkin, et al.: Building fuzzy thematic clusters and mapping them to ... Table 5
Parsimonious representation of CENTRIA Cluster 2
HEAD SUBJECTS G.
Mathematics of Computing
B.2.3
Reliability, Testing, and Fault-Tolerance
B.7.3
Reliability and Testing
D.3.3
Language Constructs and Features
F.2.1
Numerical Algorithms and Problems
F.4.1
Mathematical Logic
I.2.0
General in I.2 - ARTIFICIAL INTELLIGENCE
I.2.3
Deduction and Theorem Proving
OFFSHOOTS
I.2.8
Problem Solving, Control Methods, and Search
J.3
LIFE AND MEDICAL SCIENCES
G.0
GENERAL in G. - Mathematics of Computing
G.1.1
Interpolation
G.1.2
Approximation
G.1.3
Numerical Linear Algebra
G.1.4
Quadrature and Numerical Differentiation
G.1.5
Roots of Nonlinear Equations
G.1.8
Partial Differential Equations
G.1.9
Integral Equations
GAPS
G.1.10 Applications G.1.m Miscellaneous in G.1 - NUMERICAL ANALYSIS G.2.0
General in G.2 - DISCRETE MATHEMATICS
G.2.1
Combinatorics
G.2.3
Applications
G.2.m Miscellaneous in G.2 - DISCRETE MATHEMATICS G.4
MATHEMATICAL SOFTWARE
G.m
MISCELLANEOUS in G. - Mathematics of Computing
Figure 6.
Parsimonious lift of CENTRIA cluster 1 within the ACM-CCS tree
273
274
International Journal of Software and Informatics, Vol.4, No.3, September 2010
Acknowledgments The authors are grateful to CENTRIA-UNL members that participated in the survey. Igor Guerreiro is acknowledged for developing software for the ESSA tool. Rui Felizardo is acknowledged for developing software for the lifting algorithm with interface shown in Fig.6. The authors also acknowledge the anonymous referees for their helpful comments. This work has been supported by grant PTDC/EIA/69988/2006 from the Portuguese Foundation for Science & Technology. The support of the individual research project 09-01-0071 “Analysis of relations between spectral and approximation clustering” to BM by the “Science Foundation” Programme of the State University – Higher School of Economics, Moscow RF, is also acknowledged. References [1] ACM Computing Classification System. 1998, http://www.acm.org/about/class/1998. Cited 9 Sep 2008. [2] Bezdek J, Keller J, Krishnapuram R, Pal T. Fuzzy Models and Algorithms for Pattern Recognition and Image Processing. Kluwer Academic Publishers, 1999. [3] Brouwer R. A method of relational fuzzy clustering based on producing feature vectors using FastMap. Information Sciences, 2009, 179: 3561–3582. [4] Feather M, Menzies T, Connelly J. Matching software practitioner needs to researcher activities. Proc. of the 10th Asia-Pacific Software Engineering Conference (APSEC’03). IEEE, 2003, 6. [5] Gaevic D, Hatala M. Ontology mappings to improve learning resource search. British Journal of Educational Technology, 2006, 37(3): 375–389. [6] The Gene Ontology Consortium: Gene Ontology: tool for the unification of biology. Nature Genetics, 2000, 25: 25–29. [7] Hathaway RJ, Bezdek JC. NERF c-means: Non-Euclidean relational fuzzy clustering. Pattern Recognition, 1994, 27: 429-437. [8] Huang L, Yan D, Jordan MI, Taft N. Spectral clustering with perturbed data. In: Koller D, Schuurmans D, Bengio Y, Bottou L, eds. Advances in Neural Information Processing Systems 21, Proceedings of the Twenty-Second Annual Conference on Neural Information Processing Systems (Vancouver), MIT Press, 2009. 705–712. [9] Hubert LJ, Arabie P. Comparing partitions. Journal of Classification, 1985, 2: 193–218. [10] Liu J, Wang W, Yang J. Gene ontology friendly biclustering of expression profiles. Proc. of the IEEE Computational Systems Bioinformatics Conference. IEEE, 2004, 436–447. [11] von Luxburg U. A tutorial on spectral clustering. Statistics and Computing, 2007, 17: 395–416. [12] Miralaei S, Ghorbani A. Category-based similarity algorithm for semantic similarity in multiagent information sharing systems. IEEE/WIC/ACM Int. Conf. on Intelligent Agent Technology, 2005, 242–245. [13] Mirkin B. Additive clustering and qualitative factor analysis methods for similarity matrices. Journal of Classification, 1987, 4(1): 7–31. [14] Mirkin B, Fenner T, Galperin M, Koonin E. Algorithms for computing parsimonious evolutionary scenarios for genome evolution, the last universal common ancestor and dominance of horizontal gene transfer in the evolution of prokaryotes. BMC Evolutionary Biology, 2003, 3: 2. [15] Mirkin B, Nascimento S. Analysis of Community Structure, Affinity Data and Research Activities using Additive Fuzzy Spectral Clustering. Technical Report 6, School of Computer Science, Birkbeck University of London (2009). [16] Newman M. Finding community structure in networks using the eigenvectors of matrices. Phys. Rev. E, 2006, 74 036104. [17] Newman M, Girvan M. Finding and evaluating community structure in networks. Phys. Rev. E, 2004, 69 026113. [18] Ng A, Jordan M, Weiss Y. On spectral clustering: analysis and an algorithm. In: Ditterich TG, Becker S, Ghahramani Z, eds. Advances in Neural Information Processing Systems, 14, MIT
Boris Mirkin, et al.: Building fuzzy thematic clusters and mapping them to ...
275
Press, Cambridge Ma., 2002. 849–856. [19] Roubens M. Pattern classification problems and fuzzy sets. Fuzzy Sets and Systems 1, 1978, 239–253. [20] Sato M, Sato Y, Jain LC. Fuzzy Clustering Models and Applications, Physica-Verlag, Heidelberg, 1997. [21] Skarman A, Jiang L, Hornshoj H, Buitenhuis B, Hedegaard J, Conley L, Sorensen P. Gene set analysis methods applied to chicken microarray expression data. BMC Proceedings, 2009, 3(Suppl 4). [22] Shepard RN, Arabie P. Additive clustering: representation of similarities as combinations of overlapping properties. Psychological Review 86, 1979, 87–123. [23] Shi J, Malik J. Normalized cuts and image segmentation. IEEE Trans. on Pattern Analysis and Machine Intelligence, 2000, 22(8): 888–905. [24] Windham MP. Numerical classification of proximity data with assignment measures. Journal of Classification, 1985, 2: 157–172. [25] White S, Smyth P. A spectral clustering approach to finding communities in graphs. SIAM International Conference on Data Mining, 2005. [26] Thorne C, Zhu J, Uren V. Extracting domain ontologies with CORDER. Tech. Reportkmi-0514. Open University, 2005. 1–15. [27] Yang L, Ball M, Bhavsar V, Boley H. Weighted partonomy-taxonomy trees with local similarity measures for semantic buyer-seller match-making. Journal of Business and Technology, Atlantic Academic Press, 2005, 1(1): 42–52. [28] Zadeh LA. Fuzzy sets. Information and Control 8, 1968, 338–353. [29] Zhang S, Wang RS, Zhang XS. Identification of overlapping community structure in complex networks using fuzzy c-means clustering. Physica A 374, 2007, 483–490.