The International Archives of the Photogrammetry, Remote Sensing and Spatial Information Sciences, Volume XLII-2, 2018 ISPRS TC II Mid-term Symposium “Towards Photogrammetry 2020”, 4–7 June 2018, Riva del Garda, Italy
BUILDING INFORMATION MODELS FOR MONITORING AND SIMULATION DATA IN HERITAGE BUILDINGS D. Ph. Pocobelli 1,*, J. Boehm 1, P. Bryan 2, J. Still 3, J. Grau-Bové 1 1
University College London, Gower Street WC1E 6BT London, UK (danae.pocobelli.15, j.boehm, josep.grau.bove)@ucl.ac.uk 2 Historic England, 37 Tanner Row YO1 6WP York, UK (
[email protected]) 3 Point 2 Surveyors, 17 Slingsby Pl, WC2E 9AB London, UK (
[email protected]) Commission II, WG II/8
KEY WORDS: HBIM, Dynamo, weathering, heritage buildings, environmental modelling, environmental monitoring ABSTRACT: This paper analyses the use of BIM in heritage buildings, assessing the state-of-the-art and finding paths for further development. Specifically, this work is part of a broader project, which final aim is to support stakeholders through BIM. Given that humidity is one of the major causes of weathering, being able to detect, depict and forecast it, is a key task. A BIM model of a heritage building – enhanced with the integration of a weathering forecasting model – will be able to give detailed information on possible degradation patterns, and when they will happen. This information can be effectively used to plan both ordinary and extraordinary maintenance. The Jewel Tower in London, our case study, is digitised using combined laser scanning and photogrammetry, and a virtual model is produced. The point cloud derived from combined laser scanning & photogrammetry is traced out in with Autodesk Revit, where the main volumetry (gross walls and floors) is created with parametric objects. Surface characterisation of the façade is given through renderings. Specifically, new rendering materials have been created for this purpose, based on rectified photos of the Tower. The model is then integrated with moisture data, organised in spreadsheets and linked to it via parametric objects representing the points where measurements had been previously taken. The spatial distribution of moisture is then depicted using Dynamo. This simple exercise demonstrates the potential Dynamo has for condition reporting, and future work will concentrate on the creation of a complex forecasting model to be linked through it. 1. INTRODUCTION The last decades have been characterised by the spreading of Building Information Modelling (BIM) in the Architecture, Engineering and Construction (AEC) field (Azhar et al., 2012). BIM is a development and an improvement upon Computer Aided Design (CAD) (Azhar et al., 2012; Logothetis et al., 2015) that was traditionally used by AEC professionals. BIM software generates 3D virtual models of buildings, that are embedded with data and metadata (Logothetis et al., 2015; Mehdi K, Javadpour L, 2012). Specifically, a BIM model is a virtual simulation where building elements, such as walls, windows, etc., are not just volumes, but are “smart objects” (Arayici, 2008; Azhar et al., 2012; Logothetis et al., 2015; Mehdi K, Javadpour L, 2012; Murphy et al., 2009). These objects are “smart” (or “semantic”, as some authors prefer to call them) because are they parametric (Chenaux et al., 2011; Saygi et al., 2013; Tang et al., 2010), i.e. they are defined by numerical parameters, such as dimensions, and contain building material information (Ma et al., 2015; Murphy et al., 2013; Oreni et al., 2013). “Smart objects” can be linked to BIM schedules containing additional data and metadata (Baik et al., 2014; Columbu and Verdiani, 2014; Dore and Murphy, 2012; Mehdi K, Javadpour L, 2012; Oreni, 2013; Worrell, 2015), such as cost, manufacturer, etc. BIM models are theoretically able to contain all the information needed for a building project (Arayici, 2008; Azhar et al., 2012; Gaiani, 2012; Logothetis et al., 2015; Yen et al., 2013). BIM is currently used for new buildings (Fai and Sydor, 2013; Garagnani, 2012; Worrell, 2015), as it features standardised planning procedures that allow to speed up the whole designing process (Fai and Sydor, 2013) and to increase collaboration between different professionals involved in the same construction project (Azhar et al., 2012).
Concerning the heritage field, BIM has just started to be used and researched (Angulo Fornos, 2013; Arayici, 2008; Fai et al., 2011; Logothetis et al., 2015; Volk et al., 2014). Indeed, many gaps had been identified by different researchers (Angulo Fornos, 2013; Arayici, 2008; Azhar et al., 2012; Barazzetti et al., 2015; Gaiani, 2012; Garagnani and Manferdini, 2013; Tang et al., 2010; Volk et al., 2014), such as automation deficiency in conversions into semantic objects, automation limitations in the survey phase, etc. (Tang et al., 2010; Volk et al., 2014). The pivotal issue that BIM has, and about which the majority of researchers agree, is that it is still time-consuming and complicated when used for built heritage (Dore and Murphy, 2013; Mehdi K, Javadpour L, 2012; Tang et al., 2010; Volk et al., 2014; Worrell, 2015). In fact, heritage buildings are characterised by different historical layers, complex geometries, and non-homogeneous architectural elements (Baik et al., 2015, 2014; Barazzetti et al., 2015; Brumana et al., 2014, 2013; Tang et al., 2010). Evidently, these features clash with BIM standardised procedures (Fai and Sydor, 2013; Worrell, 2015). Moreover, the digitisation of a heritage building requires specific tools that allow surface degradation description and data analysis (Pocobelli et al., 2018). BIM for heritage is a heritage science matter. The conservation project of a heritage building is a complex procedure that needs cross-disciplinary knowledge (Arayici, 2008; Arias et al., 2007; Baik et al., 2013; Brumana et al., 2014). A BIM model of a heritage building will allow both professionals and curators/stakeholders to be able to access all related information (Azhar et al., 2012; Baik et al., 2013; Logothetis et al., 2015; Worrell, 2015) and will help in decision-making (Mehdi K, Javadpour L, 2012; Volk et al., 2014; Worrell, 2015) and maintenance planning (Arayici, 2008; Brumana et al., 2013;
__________________________ * Corresponding author
This contribution has been peer-reviewed. https://doi.org/10.5194/isprs-archives-XLII-2-909-2018 | © Authors 2018. CC BY 4.0 License.
909
The International Archives of the Photogrammetry, Remote Sensing and Spatial Information Sciences, Volume XLII-2, 2018 ISPRS TC II Mid-term Symposium “Towards Photogrammetry 2020”, 4–7 June 2018, Riva del Garda, Italy
Mehdi K, Javadpour L, 2012; Worrell, 2015). A BIM model is, therefore, a building documentation tool. 1.1 Research questions and objectives The brief literature introduction above identifies a few areas that require further research. In conjunction with a preliminary case study on the Jewel Tower, it is possible to detail the following observations, which define the research questions and the aims of this project: To date, BIM models for heritage buildings are unable to visually detail façade weathering processes; Given that humidity is a major factor in the weathering of façades, being able to forecast and monitor humidity presence is one of the main ways in which predictions of weathering/degradation can be introduced in BIM; These predictions can be made by using damage functions already validated, available in the literature, and produce a predictive model – damage functions are defined as equations that express a specific change over time, given some variable parameters; The BIM model will be implemented with a heritage specific tool, coded with Dynamo. This tool will use both building data, such as dimensions and material properties, and external inputs, such as weather/environmental parameters, to solve the above-mentioned damage functions to produce a weathering forecast; Façade weathering and humidity data have specific properties that make them ideal candidates as a case study for this project. Humidity data are time- and spatially-resolved. Moisture’s relationship with stone weathering is well-studied mathematically, and the statistical models have been validated experimentally. The results can be expressed as heat-maps over surfaces, in a GIS-like environment that could be facilitated by BIM. In short, if a BIM model can store humidity data and use them for weathering forecasts, it must also be able to store and post-process many other types of scientific data of interest and similar properties. The overall aim of this research could be expressed very succinctly: to make BIM more heritage science-friendly. In other words, the main objective is to scientifically support and endorse interventions & maintenance management through a user-friendly computational tool, which will enable stakeholders to make informed decisions. The research questions are, consequently, the following: Can current BIM hold and visualise heritage-specific information/data? Given a building geometry, material properties, orientation and environmental and climate parameters, is it possible to forecast façade weathering in heritage buildings? If yes, how can we insert these predictions into a heritage building BIM model? How can BIM support stakeholders with informed decision-making during interventions & maintenance management? 1.2 The Jewel Tower The Jewel Tower (Figure 1) is a ragstone medieval building erected in 1365 as part of the Royal Residence (Ashbee, 2013; English Heritage, n.d.). It has experienced a variegated history, firstly being used to host and protect the royal treasuries,
afterwards being used as the “Parliament Office”, where the records were kept, and eventually hosting the testing laboratory of the Board of Trade Standards Department (Ashbee, 2013; English Heritage, n.d.). These three different functions resulted in many different renovations throughout the centuries, such as additions, demolitions, new openings, replacements and reparations (AA. VV., 1976; Ashbee, 2013; English Heritage, n.d.). The Jewel Tower has experienced different events that have led up to its current complex morphology and shape. Indeed, it features common characteristics of heritage buildings, such as material variety, different historical layers, additions and demolitions, humidity, surface degradation etc. Therefore, it is representative of heritage buildings, and the related conclusions can be applied to other buildings as well.
Figure 1. The Jewel Tower in 2016, south-east view.
2. MATERIAL AND METHODS 2.1 Laser Scanning The Jewel Tower was laser scanned in the morning of the 13th of April of 2016, in collaboration with ScanLab. A FARO Focus 3D (FARO Europe GmbH & Co. KG, Stuttgart, Germany) scanner was used for shape detection, whilst colour and texture were captured using a Nikon D5500 (Nikon Corporation, Tokyo, Japan). Both the scanner and the camera were put on a tripod in the same position. Every scanning session was conducted in medium-high quality (4) for 8 minutes. Each scanning session was followed by a photographic one, where the camera was put in the same position and the target was the same. The building was divided into two portions for the photographic shoot, a lower one and an upper one. For the lower series, the camera took pictures every 60° horizontally, whilst for the upper one, the same process was followed, but starting with a delay of 30°. Each shot included three different photos: overexposed, normally exposed and underexposed. For each scanning session, 36 pictures were taken, following the methodology explained above. The Jewel Tower was laser scanned in 4 h approximately, and the shape of the whole building was obtained by capturing from 7 different positions (Figure 2).
This contribution has been peer-reviewed. https://doi.org/10.5194/isprs-archives-XLII-2-909-2018 | © Authors 2018. CC BY 4.0 License.
910
The International Archives of the Photogrammetry, Remote Sensing and Spatial Information Sciences, Volume XLII-2, 2018 ISPRS TC II Mid-term Symposium “Towards Photogrammetry 2020”, 4–7 June 2018, Riva del Garda, Italy
2.2 Modelling 2.2.1
Figure 2. Point cloud with raw data, before cleaning up. The spheres visible at the front of the image represent the positions from which the tower has been scanned. 2.1.1
Point cloud post-processing
BIM Model
The Jewel Tower digitisation took place using Autodesk Revit, one of the most known and ordinarily used BIM modelling software. The external walls and the floors were modelled following the point cloud previously processed. To 3D model the building, a preliminary planning phase was necessary, to speed up the whole process later on, as it follows. The building was divided into levels, starting from the bottom one (moat level, -1.797 m) to the top one (turret level, +16.150 m). The entrance door, situated on the ground floor, was designed as the altitude of 0.00 m. The modelling took place chiefly with plane views, following the shape derived from the point cloud, and with prospects and 3D views to control the output. Objects, such as walls, floor, etc. were modelled using existing Revit families (i.e. smart objects). The walls were created first, using a wall type of 30 cm of thickness with no materials applied (Basic Wall, Generic – 300 mm). Even if the width is not constant around the whole perimeter, it was considered acceptable in order to approximate and homogenise all the walls. Then the floors were modelled, again standardising them to the constant thickness of 40 cm (Floor, Generic Floor – 400 mm). The frames could not be modelled through Revit because they could not be standardised. Afterwards, the model was textured with aligned photos, and a few renderings were produced. 2.2.2
Photographic survey
On the 26th of May of 2016, a photographic survey session was conducted. The purpose of this task was to both have a highquality record of the surfaces and also to document the wall degradation in order to analyse it later through BIM. The photographic survey was carried out using a Sony Cyber-shot DSC-W210 (Sony Europe Limited, Weybridge, U.K.) camera, with automatic settings. This operation was accomplished adopting the following methodology): 1. The whole building was divided into façades; 2. Each façade was further divided into levels; 3. Each level was photographed horizontally, with multiple photos that slightly overlapped; 4. Crucial points, i.e. casings, were additionally zoomed and shot. Figure 3. Top – Light error due to too sunny weather conditions and reflection of people on the walls. Bottom – Window geometry error in the point cloud. The alignment and the scan registration took place using FARO Scene Laser Scanner software. Before texturing the point cloud with the photos taken, the photos were processed to correct chromatic aberration using Adobe Photoshop Lightroom. This software features a command that automatically removes chromatic aberration, due to too sunny weather conditions (Figure 3, Top). The point cloud was then textured on Scene using a TIFF format file of the processed photos. Eventually, it was then manually cleaned up using Autodesk ReCap, the free version. Specifically, the window reflections were manually deleted, as they were geometrically inconsistent (Figure 3, Bottom), as well as the people (Figure 3, Top) and the surrounding buildings. The paid version would have allowed us to automatically clean up and optimise the point cloud.
2.2.3
Image rectification
To properly texture the model, i.e. to put realistic photos on its surface to show its building materials, a previous rectification of the photos was needed. A first attempt to use the same photos that were taken during the laser scanning phase was made, but it was unsuccessful, as the quality was inadequate to describe the details of the façades and the degradation processes. Consequently, a new photographic degradation detection was scheduled. These new photos were processed using both AutoCAD (Figure 4, a) and Photoshop (Figure 4, b) to correct the perspective aberration, following the procedure described by Carpiceci (Carpiceci, 2000). The corrected photos were then merged and shaped (Figure 4, c) to precisely fit the façades of the Jewel Tower.
This contribution has been peer-reviewed. https://doi.org/10.5194/isprs-archives-XLII-2-909-2018 | © Authors 2018. CC BY 4.0 License.
911
The International Archives of the Photogrammetry, Remote Sensing and Spatial Information Sciences, Volume XLII-2, 2018 ISPRS TC II Mid-term Symposium “Towards Photogrammetry 2020”, 4–7 June 2018, Riva del Garda, Italy
Quality: high; Resolution: printer, 300 DPI; Lighting: o Scheme: exterior, sun only; o Sun setting: in session; Background style: very few clouds.
Figure 4. a – AutoCAD: Geometric construction for photographic rectification. b – Photoshop: Distortion of the perspective photo to align it. c – Photoshop: Crop of the rectified photo(s) to be merged and to create an aligned façade. 2.2.4
Textures and Renderings
Model façades were textured with the photos taken during the photographic survey session. Unfortunately, Revit does not provide a specific tool for this task, so different options were explored. A first attempt was made by pasting the photographs on the 3D model façades, using the “Decal” command. Decals are used to stick to the model real photos showing details, such as street signs or paintings1. However, this approach was discarded almost immediately as it would have produced appreciable results only after the model had been rendered. It was instantly clear that the decals would not have been different from a standard rendering procedure. Therefore, it was decided to texture the model by creating virtual materials based on the aligned photos. For every façade, a new material based on the corresponding rectified photo was created (Figure 5, Top). The new materials were shaped to fit the 3D façades, trying to avoid overlaps. To obtain that, the image ratio was modified to have the same dimensions as the corresponding façade (Figure 5, Bottom). During rendering procedure, the following parameter values were adopted: Image fade: 100; Glossiness: 37; Highlights: non-metallic; Bump: 500; Link texture transforms: checked. The parameters were set visually, after multiple endeavours. Each rendering took Revit approximately 2 h to be computed with a laptop Acer Aspire E5-573G (Acer Italy Srl, Lainate, Italy), with the following settings applied: 1
https://knowledge.autodesk.com/support/revit-products/learnexplore/caas/CloudHelp/cloudhelp/2014/ENU/Revit/files/G UID-969930D8-16D9-49CB-9E7E-5D8DF10C3C2Bhtm.html
Figure 5. Top – Draft rendering of the south façade after putting new Revit material (“Facciata 4”). Bottom – Creation of new Revit material based on rectified photos. 2.2.5
The frames
Investigating a building for conservation purpose requires a detailed drawing of the casings, to identify the typologies and possible deterioration. A satisfactory BIM software would allow this process to be promptly accomplished; nevertheless, Revit was not able to quickly model the building frames, as no component families were found to be modified in order to properly represent them. After an extensive research of Revit parametric families of the casings, it was decided to use AutoCAD to draw 2D frames, tracing out the photos taken during the photographic survey above. 2.3 Alteration detection 2.3.1
Moisture Measurements
Presence of moisture is an ordinary property in building materials, but it can cause degradation, if combined with other factors (Torraca, 1981). Moisture measurements were conducted on the 06th of July of 2016, using a TROTEC T660 (Trotec GmbH &Co, Heisenberg, Germany). Readings were taken along the whole perimeter of the building at +0.40 m and +1.40 m from the ground, in correspondence of the corners (Figure 6, Top). TROTEC T660 gives as an output a number between 0 and 200, where 200 indicates complete saturation. Readings were taken at 44 different points; for each point, the measurement was repeated 3 times and the average was calculated. Furthermore, as the points have vertical correspondence in pairs (Figure 6, Top), the vertical average
This contribution has been peer-reviewed. https://doi.org/10.5194/isprs-archives-XLII-2-909-2018 | © Authors 2018. CC BY 4.0 License.
912
The International Archives of the Photogrammetry, Remote Sensing and Spatial Information Sciences, Volume XLII-2, 2018 ISPRS TC II Mid-term Symposium “Towards Photogrammetry 2020”, 4–7 June 2018, Riva del Garda, Italy
was calculated as well. These calculations allowed setting if the humidity is rising or descending. All the above gathered data were put into Revit through the “Schedule” command, where every row corresponds to a specific point of the model. These reading points had to be modelled as family masses “spheres” because Revit can create schedules only for families (Figure 6, Bottom).
3. RESULTS AND DISCUSSION 3.1 BIM Model
Figure 7. Rendering of the south-east prospect.
Figure 6. Top – Moisture readings positions on the BIM model. Bottom – Revit schedule with moisture readings, sorting strategy. 2.3.2
Dynamo
Dynamo was initially developed as a Revit add-on, and today has become a standalone platform (Jezyk, 2017). Dynamo is defined as “A visual programming tool that aims to be accessible to both non-programmers and programmers alike. It gives users the ability to visually script behaviour, define custom pieces of logic, and script using various textual programming languages” (Jezyk, 2017). As different programming languages are supported, we decided to use Python, rather than DesignScript (the visual programming language that is usually used with Dynamo (Jezyk, 2017)), since: 1. The algorithm to produce the forecasting model is presumably going to be complex, and it is very likely that advanced concepts will be needed. Python is an advanced coding language that can support these complexities; 2. Python has been researched and improved for decades. It is a mature programming language, and support or advice can be easily found2. Dynamo is composed of nodes and wires. Nodes represent numbers, functions, strings, code blocks, etc., whilst wires define relationships between nodes. Note that it is possible to import elements of the Revit model – or even the whole model – to be further modified by Dynamo’s functions.
2
https://forum.dynamobim.com/t/design-script-or-pythonwhich-one/4252/6
The modelling task took overall 21 days, considering an average of 8 h per day (168 h). Please note that the modelling task was performed whilst learning to use Revit, so the time spent is not representative of expert users. Worrel (Worrell, 2015) spent 304 h on the Revit model of the Nathaniel Russel House (Charleston, South Carolina, U.S.A.). She managed to model parametric frames and architectural details as well. Concerning the Jewel Tower, although the volumetry creation (i.e. walls and floors) was quick and intuitive, the detail shaping revealed to be harder than expected. Indeed, Revit is an excellent tool for modelling standardised objects, as it features many families that can be customised and used. Nevertheless, the creation of unique elements – the frames, in the specific case of the Jewel Tower – was not prompt. It could have been possible to create new parametric families ad hoc, as Historic Building Information Modelling HBIM (Murphy et al., 2009), but the procedure is time-consuming and laborious. It was therefore decided to leave the 3D model with its volumetry only, whilst the details were modelled using AutoCAD and then integrated into Revit through rendering process. Figure 7 shows one of the Jewel Tower’s renders, with its volumetry and texture information. BIM for heritage conservation would need a 3D model where the applied materials are always visible; however, Revit stores the renderings as images or as locked views. This means that the 3D model is blank, as the materials can be seen only in the dedicated locked views, and it is not possible to work on the model while visualising the materials. This issue has a pivotal consequence, both practical and conceptual: the model embedded with materials is not modifiable; hence, information (i.e. materials) is not truly integrated into the model, but just pictured. Another crucial issue that was noticed is that Revit does not allow sketching in 2 dimensions, i.e. working on surfaces. 2D drawings are only permitted as aid drafts for the creation of the 3D model. Hence, façade weathering patterns had to be designed via AutoCAD, and then integrated as rendering materials.
This contribution has been peer-reviewed. https://doi.org/10.5194/isprs-archives-XLII-2-909-2018 | © Authors 2018. CC BY 4.0 License.
913
The International Archives of the Photogrammetry, Remote Sensing and Spatial Information Sciences, Volume XLII-2, 2018 ISPRS TC II Mid-term Symposium “Towards Photogrammetry 2020”, 4–7 June 2018, Riva del Garda, Italy
According to the AEC (UK) Committee definition (AEC (UK) Committee, 2015; CIC, 2013; Historic England, 2017), the produced model has a Level of Detail (LOD) of 3 – “generic” – as components are identifiable and different scales of detailing have been used according to the specific requirements. The Jewel Tower Level of Information (LOI) is composed of the point cloud presence, walls & floors materials, photographs attached as render materials, and the spreadsheet containing the moisture measurements. 3.2 Alteration detection 3.2.1
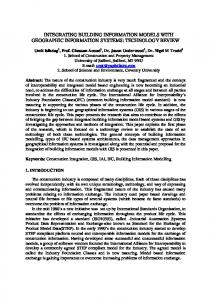
Here is briefly described the procedure we used (Figure 9): Importation of the Revit elements that we needed through the node Revit-Select Model Elements; Creation of green, yellow and red colours through RGB parametrisation; Merging of previously created RGB colours into a range colour palette to depict moisture variation; Assignment of values to RGB colours through Revit’s moisture measurements schedule; Depiction of moisture variation through the node Display.BySurfaceColours.
Façade weathering
Figure 9. Creation of Dynamo workflow to depict moisture – focus on colour creation and model importation.
4. CONCLUSIONS AND FUTURE WORK
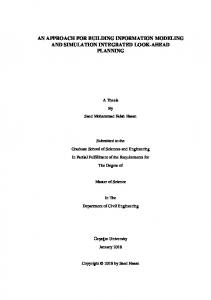
Figure 8. Rendering of the south-east prospect. Classification was made following the ICOMOS-ISCS guidelines (ICOMOS and ISCS, 2008). We identified: Biologic colonisation under the drainpipe; Black crusts on the top, under the overhangs; Crumbling on the boundary walls and on the cornice; Cracks on the cornice and the ground floor window; Few missing parts across the whole façade; Erosion concentrated on top of the south-east side; Deposit on north-east and on the south-east, bottom. The produced output (Figure 8) was produced using AutoCAD. It can be inserted into Revit creating a new rendering material, following the method above explained. Interventions can be suggested using the same procedure previously detailed. 3.2.2
Dynamo
Through Dynamo, we managed to depict moisture measurements directly on the BIM model. This short experiment shows that intelligent embedding of data in the BIM model is possible, and it is no longer required to use “stratagems” such as renderings – as we did with material characterisation and façade weathering patterns.
The Jewel Tower experiment allowed to analyse the usage of BIM in heritage buildings by a non-expert user, and – consequently – to identify deficiencies and areas to be further researched. As shown in this venture, Revit – and in general BIM software – has severe lacks when a condition report is required. Specifically, façade weathering had to be detected through photogrammetry, outlined with AutoCAD and inserted into the BIM model as renderings. In addition, the frames had to be modelled using AutoCAD and, again, inserted through renderings. Generally, we noticed that surface modelling is one of the big issues in Revit, and tactics are needed to overcome it. Indeed, moisture data had to be stored as information attached to Revit masses “spheres” through a spreadsheet; however, these spheres do not actually exist, but they represent the points where measurements were taken. Nonetheless, BIM can be surely improved. Especially since Dynamo was introduced, it is now possible to extend the model and to insert features of IT programming, such as small programmes that perform data analysis, data depiction, simulations, etc. We demonstrate in this paper a very brief paradigm that clearly exemplifies the power and the potential that Dynamo has in condition reporting. We created a small algorithm to depict moisture variation in walls, using the data that are stored in Revit through spreadsheets linked to smart masses (the “spheres” above mentioned). Future work will follow the path trodden by this experiment. We will, therefore, focus on the creation of a weathering forecasting model exploiting Dynamo’s capabilities to link it into the Revit model. Specifically, geometric parameters and building material properties will be derived directly from the BIM model, whilst weather parameters will be either userinputted or taken from the damage functions. Forecasts will be produced through the solution of damage functions (already validated, available in the literature), and moisture ingress theories (wind-driven rain runoff and the sharp front theory).
This contribution has been peer-reviewed. https://doi.org/10.5194/isprs-archives-XLII-2-909-2018 | © Authors 2018. CC BY 4.0 License.
914
The International Archives of the Photogrammetry, Remote Sensing and Spatial Information Sciences, Volume XLII-2, 2018 ISPRS TC II Mid-term Symposium “Towards Photogrammetry 2020”, 4–7 June 2018, Riva del Garda, Italy
The output should be a surface distribution of degradation; the Jewel Tower experiment has demonstrated – even if on a much smaller scale – that Dynamo can be used for this scope. ACKNOWLEDGEMENTS The authors would like to thank English Heritage for offering the case study. We would like to thank Julia Schütz from ScanLab, for laser scanning and post-processing the point cloud. Thanks also to David Thickett, for suggesting the Jewel Tower as a case study, and to Jeremy Ashbee, for providing precious historical material. Thanks to the Jewel Tower Management Team and to James Parkes for allowing us analysing the building. REFERENCES AA. VV., 1976. The history of the King’s works, Volume 5: ed. H.M.S.O. AEC (UK) Committee, 2015. AEC (UK) BIM Technology Protocol, Practical implementation of BIM for the UK Architectural, Engineering and Construction (AEC) industry 1– 47. Angulo Fornos, R., 2013. Construcción de la base gráfica para un sistema de información y gestión del patrimonio arquitectónico: Casa de Hylas. Arqueol. la Arquit. 0, 11–25. https://doi.org/10.3989/arqarqt.2012.10005 Arayici, Y., 2008. Towards building information modelling for existing structures. Struct. Surv. 26, 210–222. https://doi.org/10.1108/02630800810887108 Arias, P., Armesto, J., Di-Capua, D., González-Drigo, R., Lorenzo, H., Pérez-Gracia, V., 2007. Digital photogrammetry, GPR and computational analysis of structural damages in a mediaeval bridge. Eng. Fail. Anal. 14, 1444–1457. https://doi.org/10.1016/j.engfailanal.2007.02.001 Ashbee, J., 2013. The Jewel Tower. English Heritage Guidebooks, London. Azhar, S., Khalfan, M., Maqsood, T., 2012. Building information modelling (BIM): now and beyond. Australas. J. Constr. Econ. Build. 12, 15. https://doi.org/10.5130/ajceb.v12i4.3032 Baik, A., Alitany, A., Boehm, J., Robson, S., 2014. Jeddah Historical Building Information Modelling “JHBIM” Object Library. ISPRS Ann. Photogramm. Remote Sens. Spat. Inf. Sci. Vol. II-5, 2014 ISPRS Tech. Comm. V Symp. 23 – 25 June 2014, Riva del Garda, Italy II-5, 41–47. https://doi.org/10.5194/isprsannals-II-5-41-2014 Baik, A., Boehm, J., Robson, S., 2013. Jeddah historical building information modeling “JHBIM” Old Jeddah - Saudi Arabia. Int. Arch. Photogramm. Remote Sens. Spat. Inf. Sci. ISPRS Arch. 40, 73–78. https://doi.org/10.5194/isprsarchivesXL-5-W2-73-2013 Baik, A., Yaagoubi, R., Boehm, J., 2015. Integration of Jeddah Historical BIM and 3D GIS for Documentation and Restoration of Historical Monument. ISPRS - Int. Arch. Photogramm. Remote Sens. Spat. Inf. Sci. XL-5/W7, 29–34.
https://doi.org/10.5194/isprsarchives-XL-5-W7-29-2015 Barazzetti, L., Banfi, F., Brumana, R., Gusmeroli, G., Previtali, M., Schiantarelli, G., 2015. Cloud-to-BIM-to-FEM: Structural simulation with accurate historic BIM from laser scans. Simul. Model. Pract. Theory 57, 71–87. https://doi.org/10.1016/j.simpat.2015.06.004 Brumana, R., Oreni, D., Cuca, B., Binda, L., Condoleo, P., Triggiani, M., 2014. Strategy for Integrated Surveying Techniques Finalized to Interpretive Models in a Byzantine Church, Mesopotam, Albania. Int. J. Archit. Herit. 8, 886–924. https://doi.org/10.1080/15583058.2012.756077 Brumana, R., Oreni, D., Raimondi, A., Georgopoulos, A., Bregianni, A., 2013. From survey to HBIM for documentation, dissemination and management of built heritage: The case study of St. Maria in Scaria d’Intelvi, in: Proceedings of the DigitalHeritage 2013 - Federating the 19th Int’l VSMM, 10th Eurographics GCH, and 2nd UNESCO Memory of the World Conferences, Plus Special Sessions fromCAA, Arqueologica 2.0 et Al. IEEE, pp. 497–504. https://doi.org/10.1109/DigitalHeritage.2013.6743789 Carpiceci, M., 2000. Il rilievo dello spazio architettonico. Principi geometrici e grafici, Edizioni d. ed. Kappa, Roma. Chenaux, A., Murphy, M., Keenaghan, G., Jenkins, J., McGovern, E., Pavia, S., 2011. Combining a Virtual Learning Tool and Onsite Study Visits of Four Conservation Sites in Europe. Geoinformatics FCE CTU 6, 157–169. https://doi.org/10.14311/gi.6.21 CIC, 2013. Building Information Model (Bim) Protocol. Constr. Ind. Counc. Columbu, S., Verdiani, G., 2014. Digital Survey and Material Analysis Strategies for Documenting, Monitoring and Study the Romanesque Churches in Sardinia, Italy, Cultural Heritage: Documentation, Preservation, and Protection: 5th International Conference, EuroMed 2014, Limassol, Cyprus, November 3-8, 2014, Lecture Notes in Computer Science. Springer International Publishing, Cham. https://doi.org/10.1007/978-3319-13695-0 Dore, C., Murphy, M., 2013. Semi-Automatic Modelling of Building Façades with Shape Grammars Using Historic Building Information Modelling. Proc. Int. Arch. Photogramm. Remote Sens. Spat. Inf. Sci. - 3D Virtual Reconstr. Vis. Complex Archit. XL, 57–64. https://doi.org/10.5194/isprsarchives-XL-5-W1-57-2013 Dore, C., Murphy, M., 2012. Integration of Historic Building Information Modeling (HBIM) and 3D GIS for recording and managing cultural heritage sites, in: 2012 18th International Conference on Virtual Systems and Multimedia. IEEE, pp. 369– 376. https://doi.org/10.1109/VSMM.2012.6365947 English Heritage, n.d. The Jewel Tower [WWW Document]. URL http://www.english-heritage.org.uk/visit/places/jeweltower/history/ (accessed 5.16.16). Fai, S., Graham, K., Duckworth, T., Wood, N., Attar, R., 2011. Building Information Modelling and Heritage Documentation, in: Proceedings of the 23rd International Symposium, International Scientific Committee for Documentation of Cultural Heritage (CIPA). pp. 12–16.
This contribution has been peer-reviewed. https://doi.org/10.5194/isprs-archives-XLII-2-909-2018 | © Authors 2018. CC BY 4.0 License.
915
The International Archives of the Photogrammetry, Remote Sensing and Spatial Information Sciences, Volume XLII-2, 2018 ISPRS TC II Mid-term Symposium “Towards Photogrammetry 2020”, 4–7 June 2018, Riva del Garda, Italy
Fai, S., Sydor, M., 2013. Building Information Modelling and the documentation of architectural heritage: Between the “typical” and the “specific,” in: 2013 Digital Heritage International Congress (DigitalHeritage). IEEE, pp. 731–734. https://doi.org/10.1109/DigitalHeritage.2013.6743828 Gaiani, M., 2012. Creare Sistemi informativi per studiare, conservare, gestire e comunicare sistemi architettonici e archeologici complessi. DisegnareCon 5, 9–20. https://doi.org/10.6092/issn.1828-5961/3277
Pocobelli, D.P., Boehm, J., Bryan, P., Still, J., Grau-Bové, J., 2018. BIM for Heritage Science: A Review. Herit. Sci. accepted for publication. Saygi, G., Agugiaro, G., Hamamcıoğlu-Turan, M., Remondino, F., 2013. Evaluation of GIS and BIM Roles for the Information Management of Historical Buildings. ISPRS Ann. Photogramm. Remote Sens. Spat. Inf. Sci. II, 283–288. https://doi.org/10.5194/isprsannals-II-5W1-283-2013
Garagnani, S., 2012. Building Information Modeling semantico e rilievi ad alta risoluzione di siti appartenenti al Patrimonio Culturale. DISEGNARECON 5, 297–302. https://doi.org/10.6092/issn.1828-5961/3359
Tang, P., Huber, D., Akinci, B., Lipman, R., Lytle, A., 2010. Automatic reconstruction of as-built building information models from laser-scanned point clouds: A review of related techniques. Autom. Constr. 19, 829–843. https://doi.org/10.1016/j.autcon.2010.06.007
Garagnani, S., Manferdini, A.M., 2013. Parametric accuracy : building information modeling process applied to the cultural heritage preservation. ISPRS - Int. Arch. Photogramm. Remote Sens. Spat. Inf. Sci. XL-5/W1, 87–92. https://doi.org/10.5194/isprsarchives-XL-5-W1-87-2013
Torraca, G., 1981. Lezioni di scienza e tecnologia dei materiali per il restauro dei monumenti [Porous building materias: Material science for architectural conservation]. International Centre for the Study of the Preservation and the Restoration of Cultural Property, Rome.
Historic England, 2017. BIM for Heritage.
Volk, R., Stengel, J., Schultmann, F., 2014. Building Information Modelling (BIM) for existing buildings — Literature review and future needs. Autom. Constr. 38, 109– 127. https://doi.org/10.1016/j.autcon.2013.10.023
ICOMOS, ISCS, 2008. deterioration patterns.
Illustrated
glossary
on
stone
Jezyk, M., 2017. The Dynamo Primer [WWW Document]. URL http://dynamoprimer.com/en/ (accessed 11.18.17). Logothetis, S., Delinasiou, A., Stylianidis, E., 2015. Building Information Modelling for Cultural Heritage: A review. ISPRS Ann. Photogramm. Remote Sens. Spat. Inf. Sci. II-5/W3, 177– 183. https://doi.org/10.5194/isprsannals-II-5-W3-177-2015 Ma, Y.-P., Hsu, C.C., Lin, M.-C., Tsai, Z.-W., Chen, J.-Y., 2015. Parametric Workflow (BIM) for the Repair Construction of Traditional Historic Architecture in Taiwan. ISPRS - Int. Arch. Photogramm. Remote Sens. Spat. Inf. Sci. XL-5/W7, 315–322. https://doi.org/10.5194/isprsarchives-XL-5-W7-3152015
Worrell, L.L., 2015. Building Information Modeling (BIM): The untapped potential for preservation documentation and management. Clemson University. Yen, Y.N., Weng, K.H., Huang, H.Y., 2013. Study on Information Management for the Conservation of Traditional Chinese Architectural Heritage — 3D Modelling and Metadata Representation. ISPRS Ann. Photogramm. Remote Sens. Spat. Inf. Sci. II-5/W1, 331–336. https://doi.org/10.5194/isprsannalsII-5-W1-331-2013
Mehdi K, Javadpour L, K.G., 2012. Semantic Object Recognition for BIM Reverse Engineering, in: IIE Annual Conference. pp. 1–6. Murphy, M., McGovern, E., Pavia, S., 2013. Historic Building Information Modelling – Adding intelligence to laser and image based surveys of European classical architecture. ISPRS J. Photogramm. Remote Sens. 76, 89–102. https://doi.org/10.1016/j.isprsjprs.2012.11.006 Murphy, M., McGovern, E., Pavia, S., 2009. Historic building information modelling (HBIM). Struct. Surv. 27, 311–327. https://doi.org/10.1108/02630800910985108 Oreni, D., 2013. From 3D Content Models to HBIM for Conservation and Management of Built Heritage, in: The 13th International Conference on Computational Science and Its Applications. pp. 344–357. https://doi.org/10.1007/978-3-64239649-6_25 Oreni, D., Brumana, R., Georgopoulos, A., Cuca, B., 2013. HBIM for Conservation and Management of Built Heritage : Towards a Library of Vaults and Wooden Bean Floors. ISPRS Ann. Photogramm. Remote Sens. Spat. Inf. Sci. II-5/W1, 215– 221. https://doi.org/10.5194/isprsannals-II-5-W1-215-2013
This contribution has been peer-reviewed. https://doi.org/10.5194/isprs-archives-XLII-2-909-2018 | © Authors 2018. CC BY 4.0 License.
916