network. The performance of practical experiments shows that our system is applicable and robustness for the purpose of energy waste monitoring. Usage ...
The First International Workshop on Cyber-Physical Networking Systems
Building Surface Mounted Wireless Sensor Network for Air Conditioner Energy Auditing Peng Liu∗ , Song Zhang, Jian Qiu∗ , and Guojun Dai Institute of Computer Application Technology Hangzhou Dianzi University Hangzhou China 310018 ∗ {perryliu,qiujian}@hdu.edu.cn Abstract—Air conditioners possess a large proportion of the energy consumption in a building for both heating and cooling functions. The purpose of this paper is to present the work in progress which uses simple and cheap sensor nodes mounting on the external unit of air conditioners to automatically sense the usage pattern. This work is part of the project called Cyber IVY, which provides means of building surveillance using Surface Mounted and Energy-harvesting Wireless Sensor Networks. By this implementation, the precise working status of air conditioners can be monitored. The paper describes the hardware design, node deployment, and networking issues of this wireless sensor network. The performance of practical experiments shows that our system is applicable and robustness for the purpose of energy waste monitoring. Usage pattern, unusual behavior and other issues can be detected.
I. I NTRODUCTION Many researches [1][2][3][4][5] have mentioned that the major electricity consumption occurs in residential and commercial buildings is the air conditioners, while heating and cooling are both major contributors of the electricity bill. A solution is to control (turn on/off) those electrical and electronic equipment intelligently according to the environmental conditions and human requirements. However, the energy consumption situation has to be extensively studied before implementing such a remote control system. From the literatures, the best fine-grained way to obtain energy usage statistics is to measure electricity consumption using meters and aggregate data after a time period. However, if the real-time result is required, all the meters have to be connected with wired or wireless transceivers. Such Wireless AC plug-load meter is proposed in Ref [4]. They create models of the behavior of each type of appliance by using measured data of similar devices. Our research group has also developed such a system to measure electricity consumption of single appliance by means of smart socket. There are some other ways been proposed to reveal the nature of electricity load and the usage of AC. A.G. Ruzzelli et al use a single wireless energy monitoring sensor which is easy to implement. Clipped to the main electrical unit to carried out RealTime Recognition and Profiling of Appliances which is called RECAP[2] (Recognition of electrical Appliances and Profiling). The energy monitoring unit transmits energy information data to a local machine for process and storage via wireless network. Some work focusses on user behavior profiling such
978-1-4244-9920-5/11/$26.00 ©2011 IEEE
as ref [3] and ref [1] by motion, temperature or light sensors. Other methods tend to using simple sensor technology to fulfill the requirement of complex functions, which avoids complex IC or circuit design. Ref [6] adopts vibration sensors for fan monitoring instead of using Hall Elements or other means because the fan speed of an AC is stable and vibration is regular as well. To compute and predicate aerial pollutant emissions the authors only need know the operation duration of fans. Regarding the application of air conditioner monitoring, although socket-level meters can provide the full coverage of electrical power usage, by which we can compute air conditioner energy consumption accurately, they are difficult to be installed and get valid connection with each other. Wired connection method is not feasible because it will significantly affect the layout and appearance of the building. Furthermore, when new item is added to this network, it is difficult to deploy. Using wireless connection also has some problems as the indoor wireless connectivity is a miserable task for low power transceivers. Relay may solve the problem but it is difficult to infrastructure from the beginning. The socket is also very expensive and generates large amount of data. In most applications, the pattern of usage and energy consumption only needs rough monitoring. For example, examining the usage and consumption of individual air conditioner with simple scheme will be enough for generating manager adequate detail in mind to save the energy budget. Therefore, in this paper we also propose such a simple solution by building surface mounted sensor network, BSMSN, mounted on the external unit of the air conditioners. By measuring the electrical fan Rotational Speed, the system is able to automatically sense air conditioners’ usage pattern and predicate energy consumption. We also evaluate the networking issue for the BSMSN and other interesting phenomena. This work is part of the project Building Surface Mounted Smart Sense, BUMSS, also known as Cyber IVY which provides means of building surveillance using Surface Mounted and Energy-harvesting Wireless Sensor Networks. The remainder of this paper is organized as follows. In Section II, the related work is introduced. In Section III, the system design is described in detail. Then, the networking issues are discussed including coverage and connectivity in section IV. Then, in Section V, experimental evaluations are
749
carried out, an application scenario is introduced and examined as well. Finally, a conclusion is provided in Section VI. II. R ELATED WORKS Experiences tell people that more detailed information and precise control requires significantly increasing of the difficulty and complexity. In fact, some of these accurate information will never be used as it is out of the requirement. Nowadays, many researches have returned to match the special requirements by simple technologies for cost control, which is easy to implement and the cost can be significantly reduced. Gabe Cohn et al proposed single-point sensing solution for automatically identifying gas usage (e.g., water heater, furnace, fireplace) down to its source called GasSense [7]. GasSense analyzes the acoustic response of a government mandated gas regulator, which provides the unique capability of sensing both the individual appliance at which gas is currently being consumed and an estimation of the amount of gas flow. GasSense is the first project using acoustic sensing for appliance-level identification and gas flow estimation. The authors announced that GasSense has an average accuracy of 95.2% in identifying individual appliance usage. Similar work can be found in the system called Hydrosense [8] and another system called Electrisense [9]. In the former case, researches from University of Washington implies a single sensor installed in house water infrastructure, e.g., an exterior hose bib, utility sink spigot, or water heater drain valve so as to support both identification of activity at individual water fixtures within a house as well as estimate the amount of water being used at each fixture. In the latter case, Gupta S. et al tell us how to obtain a new solution for automatically detecting and classifying the use of electronic devices in a house from a single point of sensing. Experiments show that ElectriSense can identify and classify the usage of individual devices with a mean accuracy as much as 93.82%. Ref. [4][6][10][11][12] use similar methods to monitor electricity usage and fan operation. Besides observing physical parameters, many other researches concern how to reveal human activity indoor to automatically control electrical equipment. Finally, by switching off the unnecessary electrical equipment, the total energy consumption can be significantly reduced. These researches also pay close attention to simple sensor technology which prefer using motion, temperature or pressure sensors. In [1], J. Lu brought forward smart thermostat that uses occupancy sensors to save energy by automatically turning off the HVAC when occupants are sleeping or away. Patel S.N. also proposed a method to detect human movement by differential air pressure sensors in HVAC system [13]. Researchers from Italy presented an integrated system for profiling and reducing house energy consumption [3]. The work focused, in particular, on the key role played by wireless sensor networks to automatically control home appliances according to users’ habits. All these work employ simple sensor technology which demands less cost, less sensing requests and easy installation. However, most expecting result will be generated from simple
observation which differ greatly in different setting, location and so on, thus it is difficult to popularize as it has to design specified systems. Furthermore, the accuracy and robustness of these methods are still doubtable which is another barrier difficult to break through. In this paper, we present a work in progress which uses simple and cheap sensor nodes to mount on the external unit and automatically sense air conditioners usage pattern. Differed from existing work, only a few parameter need to be adjust before shifting to another location. III. S YSTEM DESIGN
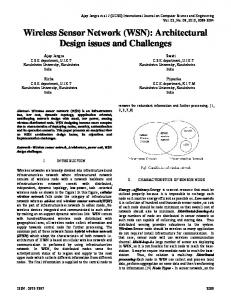
(a) Original Image Fig. 1.
(b) Connected together
A building with external units installed in the wall
Most buildings in China, especially in the south part, are equipped with air conditioners due to hot weather in summer. For some buildings, external units of air conditioners exist on the wall outside every single room as shown in Fig. 1(a). These external units are very likely to be regularly distributed with equal distance between neighbors so that if wireless sensor nodes can be mounted on them, it will naturally form a network as seen in Fig.1(b). This is also the original idea of Cyber IVY project, which will provide more sensing services and organize larger sensor networks. In the current state, the recent network is called BSMSN for short, which represents Building Surface Mounted Sensor Networks. A. Motivation of using BSMSN In this paper, as a basic step of Cyber IVY system, the BSMSN is mainly used for two purposes. First of all, to test and evaluate the existing network performances. The reason for using wireless sensor nodes to form a network outside rooms is that in the field we can get a very good transition range using IEEE802.15.4 which is around 100-200 meters. Hence, different wings of a building, even adjacent buildings can be connected together so that adding and removing nodes becomes an easy job which bring flexibility to the system. Also, multi-hop factors and constant data generation speed will bring significant challenges when using BSMSN networks. In section IV, we will analyze topology of the network as well as dataflow and the packet loss. B. simple rotational speed sensor Another main reason for us to use BSMSN is to achieve energy saving on air conditioner by using simple equipment. The architecture of this auditing system is shown as in Fig. 2. The main body of the sensor node is based on a telosB
750
For example, the annual cost of electric power consumed by a x BTU/h air conditioning unit operating for y hours per year with a SEER rating of z can be calculated as follows: 𝑢𝑛𝑖𝑡 𝑠𝑖𝑧𝑒(𝐵𝑇 𝑈/ℎ) × ℎ𝑜𝑢𝑟𝑠 𝑝𝑒𝑟 𝑦𝑒𝑎𝑟(ℎ) (𝑆𝐸𝐸𝑅(𝐵𝑇 𝑈/𝑊 ℎ) × 1000𝑊/𝑘𝑊 )
Fig. 2. A set of sensor node including a telosB node, a fan, infrared correlation sensor and batteries
node which use MSP430 as its processor and a cc2420 as its communication device. A Fan is connected to the sensor node through additional circuit which is mainly used to measure the rotational speed. There are many ways to measure the speed. Here we use Infrared Correlation Sensor to implement. A send and receive combined infrared correlation sensor faces the leaf of the fan. A small piece of white paper as a reflexes is stickled to the leaf. As a result, in each round, the infrared correlation sensor will get a signal which causes an interrupt in MSP430. We need only count the number of interrupts to compute the rough fan speed so that to predict the rough energy consumption. We also used HULL unit to get a more precise result but it will possess more room. Other ways will be discussed to measure the fan speed without Infrared correlation sensor or Hull and it is a part of the energy harvesting system. We will present it in future work. Sensor node composed of fan, fan speed computation and communication unit is mounted on the surface of the external unit of air conditioners. When the air conditioner is switched on, wind will be generated to the sensor node from the external unit to make the fan of the sensor rotate. The sensor measures the rotational speed and reports it to the sink node in a multihop manner. The sink will compute the energy consumption and report abnormal usage of air conditioners. C. Theoretical analysis The best way to measure energy consumption is to use the equation 𝑊 = 𝑈 × 𝐼. In most cases voltage 𝑈 is known so that only measure the currency 𝐼 is enough. As mentioned in the previous section, the method is economically efficient and flexible. Their are some assumptions and definitions. Definition 1: BTU: British Thermal Unit. It is a unit of measurement of thermal energy. Definition 2: SEER: Seasonal Energy Efficiency Ratio. The higher the SEER rating, the higher energy efficiency can be achieved in the air conditioner. The SEER rating is the BTU of cooling output during its normal annual usage divided by the total electric energy input in watt hours (Wh) during the same period.
(1)
In this equation, SEER and unit BTU are constant to a specified air conditioner so that as long as we know how long in total an air conditioner operating, we can calculate the rough energy consumption rate. From another angle, the power of the air conditioner can be calculated from four parts: outer air conditioner fan, inner air conditioner fan, compressor, and heater. Let: 𝑂𝑒 = outer air conditioner fan 𝐼𝑒 = inner air conditioner fan 𝑌𝑒 = Compressor 𝐻𝑒 = heater 𝐸𝑒 = total energy consumption in this equation. only one of 𝑌𝑒 and 𝐻𝑒 will appear depends on the working mode of the air conditioner. The summation of conserved system energy 𝐸𝑒 can be formulated as: 𝐸𝑒 = 𝛼𝑂𝑒 + 𝛿𝐼𝑒 + 𝛾𝑌𝑒 + 𝜖𝐻𝑒 where 𝛼, 𝛿, 𝛾, 𝜖 are constants in a specified system. 𝑂𝑒 can be measured directly by our system. 𝐼𝑒 can use an average value because it is relatively small compared with 𝑌𝑒 or 𝐻𝑒 . 𝑌𝑒 can be regarded as a constant value because most air conditioners have fixed power input. Inverter air conditioner will be discussed in future work. Even it is not constance, we can analyze it by checking outdoor and indoor temperature changing rate. 𝐻𝑒 is the same to 𝑌𝑒 . Therefore, assuming the fan operation of external unit for time interval 𝑡0 has been monitored, the total energy consumption can be computed as: 𝐸𝑒𝑡0 = {𝑂𝑒 + 𝐼𝑒 + 𝑌𝑒 + 𝐻𝑒 } × 𝑡0 IV. N ETWORKING ISSUES As shown in Fig. 1(b), the deployment of our BSMSN system is based on the outdoor machines of the air conditioners. In the example system of our experiment, the network topology is shown by connectivity Fig. 3. In such a connection tree, node 0 represents the sink node, which is placed near the window of the first floor. This node is plugged into the PC by USB, and all the sensed data will be forwarded to it via nodes 1 or 2 in the first hop. Every outdoor sensor node has sensor board embedded for the measurement of the revolving speed of the air conditioner. It also has radio transceiver to transmit and receive data packets. In this example network, the total number of hops is five; each node has its own routing table which tells the possible data sources of it (the neighbor nodes in the further hop from the sink). The node sends the data packets in a broadcast manner which allows all the neighbors in any direction to receive. Once a node receives a packet, it will check whether
751
The x axis represents the identity of the nodes, while the y axis represents the number of packets received from each node. It shows that the node with a larger hop count suffers higher risk of packet drop. It is natural as there are more packet deliveries taking place in the route, and this packet loss ratio does not affect the experiment results. V. E XPERIMENTAL EVALUATION AND S CENARIO OVERVIEW
Fig. 3.
A snapshot of the network topology
it comes from the possible source nodes. If the sender of the packet belongs to the source node set, it will store the packet and deliver it after a random back-off between 0 to 1 second. The data packet will be forwarded to the sink node hop by hop with a very fast speed as all the packets are sent immediately once it is generated or completely received. As there are five hops in total, the entire packet delay is less then 5 seconds, with a main value of 2 seconds. 3200 3000 2800 2600 2400 2200 2000 0
1
2
5
Fig. 4.
11
14
10
18
22
23
20
21
Package lost rate
This scheme is very simple to be implemented and also enables fast data forwarding which guarantees the received data information still valid. However, it suffers from several drawbacks, especially the traditional WSNs’ problem, energy waste, and also the packet drop problem. For the former case, every node keeps active all the time that results in highest energy consumption of the sensor node. However, as this is a trail system and faces building monitoring, neither the network is inaccessible nor the battery is unrechargeable. Therefore, node energy waste is not a big issue in our demonstration system. In the future work, solar powered or wind powered energy supply will be implemented in this system to improve energy efficiency. For the latter case, as there is only a simple back-off scheme which cannot prevent packet collisions, packet loss is unavoidable. However, compared with the measurement frequency, which is in the order of seconds, the duration of packet transmission is relatively short in the order of milliseconds. The probability of packet transmission is relatively low. In our experiment result data, the percentages of packet reception of all the nodes are shown below in Fig. 4.
Fig. 5.
A sensor node near a working external unit
To demonstrate the system and evaluate the performance of air conditioner monitoring, experiments have been carried out by doing real measurement. In our demonstration, the parameters measured are the room temperature, the outdoor temperature, and the rotating speed of the air conditioner outdoor machine, which indicates whether the air conditioners are working. These parameters are measured every ten seconds, which allows the sensed data to be forwarded to the sink node before the next measurement takes place. The instant data are sent to the sink node (a node with USB plugged in the PC) via multi-hop network as described above. The received data is stored in the PC, and the missed data can be tracked and reproduced by the algorithm discussed. Three different experiments are represented as follows with the result figures and the corresponding analysis. In the first experiment, one of the air conditioner with setting temperature 20∘ C is switched on. After 15 minutes, the second air conditioner is turn on with 22∘ C set. The measurement lasts 40 minutes. Fig. 6 represents the relationship between room temperature and the air conditioners serving in the room. At the beginning, only air conditioner 1 is working, which helps to increase the temperature from 18 to 20∘ C . When 20∘ C is matched, the air conditioner starts to take short breaks but still maintain relatively stable room temperature. Once the second air conditioner is switched on, the room temperature keeps increasing until 22 ∘ C. However, air conditioner 1 no longer works as the room temperature exceeds its setting. Thus this experiment 1 proves that our sensor network has been successfully deployed and works in a good condition. Although some data may be missed due to network congestion or link loss, the reproduced data can still help to accurately reflect the real performance.
752
Fig. 6. Relationship between room temperature and the air conditioners serving in the room
Fig. 7.
In the second experiment, there are two different application scenarios compared. In scenario 1, the doors and windows are firmly closed, which can help accurately examine the time period between the air conditioner powered on until the temperature setting is met. In scenario 2, the aim is to measure this time duration with windows or doors open. As a common sense, if this happens, the energy consumption of air conditioner is predicted to be increased. The results of this experiment in Fig. 7 show that the room temperature can be increased by 15∘ C within only approximately half an hour in scenario 1. However, as the doors and the windows are widely open in scenario 2, the room temperature can never be increased to the setting value. Thus it results that the air conditioners keep working with full power all the time. From this figure, it can also be obtained that if the setting temperature is reached, the air conditioner can switch the outdoor machine off to save power until the temperature drops with 1 or even 2 degrees. These application scenarios prove that by using sensor network, unusual events such as windows or doors unclosed can be detected and reported, which helps to achieve remote monitoring and control the room heating service and achieve energy saving. For further test of the system, such as the capability of long time unattended monitoring, Fig. 8 records the on/off working status of the air conditioner for an entire working day from 6am to 21pm. The room and outdoor environment temperatures and the on/off state of the air conditioner are both shown in the same figure. It is obvious that the air conditioner working continuously for half an hour to one hour and then stop for a while if the setting room temperature has been reached. The duration of an ’off’ state depends on how fast the room temperature drops and whether the air conditioner is manually switched off. It shows that in such case of big difference between room and outdoor temperature (20∘ C), the room heat is lost very rapidly. The air conditioner has to keep an approximately 90% duty cycle to maintain the room temperature. Between 400 minutes to 500 minutes,
Experimental result of two different scenarios
and also between 800 to 900 minutes, there are two long ’temperature drop period’ occur. The reason for this is either the door/window is open (the former case) when the outdoor machine of the air conditioner still works, or the power of the air conditioner is turned off (the latter case).
Fig. 8. the on/off working status of the air conditioner for an entire working day from 6am to 21pm
Through the above three experiments, it can be clarified that the air conditioner monitoring can be successfully achieved by wireless sensor network with simple node design and multihop self-organized network. The advantages include: unattended monitoring and stable long time performance, cheap device and simple installation, instant result display and data storage, remote unusual usage detection for the entire building. Finally, the energy consumption record has the potential to be used for room heating system unmanned scheduling, or to detect the energy waste mechanisms by the help of human location and movement tracking system, which points out the empty but
753
heated rooms. Further benefits will be explored by our future work on Cyber IVY system. VI. C ONCLUSIONS This paper has discussed an ongoing work of building surface mounted smart sense which uses surface mounted sensor network to monitor air conditioner usage pattern as well as energy consumption. These observing results can help us to learn and discover non-energy-efficient behavior and support decision making of energy saving methods. The main contribution of this work is to move sensors from inside the building to the outside facade. Besides monitoring air conditioners, they can also play an important role in the field of building structure health monitoring, abnormal event detection and many other aspects. Future research may include exploiting of rich solar power and wind power which will allow the network sustainable so as to be more cost-effective.
[13] S. N. Patel, M. S. Reynolds, and G. D. Abowd, “Detecting human movement by differential air pressure sensing in HVAC system ductwork: An exploration in infrastructure mediated sensing,” in Pervasive, vol. 5013. Springer, 2008, pp. 1–18. [14] X. Jiang, S. Dawson-Haggerty, J. Taneja, P. Dutta, and D. E. Culler, “Creating greener homes with IP-based wireless ac energy monitors,” in SenSys. ACM, 2008, pp. 355–356. [15] L. Farinaccio and R. Zmeureanu, “Using a pattern recognition approach to disaggregate the total electricity consumption in a house into the major end-uses,” Energy and Buildings, vol. 30, no. 3, pp. 245–259, 1999. [16] Y. Kim, Z. Charbiwala, A. Singhania, T. Schmid, and M. B. Srivastava, “Spotlight: Personal natural resource consumption profiler,” in HotEmNets. ACM, 2008, pp. 1–5. [17] E. M. Tapia, S. S. Intille, and K. Larson, “Activity recognition in the home using simple and ubiquitous sensors,” Pervasive Computing, vol. 3001, pp. 158–175, 2004. [18] “Annual energy review (aer): Primary energy production by source,” U.S. Energy Information Administration, 2010, http://www.eia.doe.gov/aer/pdf/pages/sec1 7.pdf/.
ACKNOWLEDGMENT This work is supported by the Doctoral Scientific Research Foundation of Hangzhou Dianzi University(Grant No. KYS055608107), the National Natural Science Foundation of China (Grant No. 60903167), the Pre-research Scheme of National Basic Research Program of China (973 Program) under Grant No. 2010CB334700, and the Natural Science Foundation of Zhejiang Province (Y1111063). R EFERENCES [1] J. Lu, T. I. Sookoor, V. Srinivasan, G. Gao, B. Holben, J. A. Stankovic, E. Field, and K. Whitehouse, “The smart thermostat: using occupancy sensors to save energy in homes,” in SenSys. ACM, 2010, pp. 211–224. [2] A. Ruzzelli, C. Nicolas, A. Schoofs, and G. O’Hare, “Real-time recognition and profiling of appliances through a single electricity sensor,” in SECON. IEEE, 2010, pp. 1–9. [3] A. Barbato, L. Borsani, and A. Capone, “A wireless sensor network based system for reducing home energy consumption,” in SECON. IEEE, 2010, pp. 1–3. [4] X. Jiang, M. V. Ly, J. Taneja, P. Dutta, and D. E. Culler, “Experiences with a high-fidelity wireless building energy auditing network,” in SenSys. ACM, 2009, pp. 113–126. [5] “Buildings energy data book,” U.S. DOE Energy Information Administration, 2008, http://buildingsdatabook.eere.energy.gov/. [6] Y. Chen, J.-Q. Ni, C. A. Diehl, A. J. Heber, B. W. Bogan, and L.-L. Chai, “Large scale application of vibration sensors for fan monitoring at commercial layer hen houses,” sensors, vol. 10, no. 12, pp. 11 590– 11 604, 2010. [7] G. Cohn, S. Gupta, J. Froehlich, E. Larson, and S. N. Patel, “Gassense: Appliance-level, single-point sensing of gas activity in the home,” in Pervasive, vol. 6030. Springer, 2010, pp. 265–282. [8] J. Froehlich, E. Larson, T. Campbell, C. Haggerty, J. Fogarty, and S. N. Patel, “Hydrosense: infrastructure-mediated single-point sensing of whole-home water activity,” in UbiComp. ACM, 2009, pp. 235– 244. [9] S. Gupta, M. S. Reynolds, and S. N. Patel, “Electrisense: single-point sensing using EMI for electrical event detection and classification in the home,” in UbiComp. ACM, 2010, pp. 139–148. [10] S. N. Patel, T. Robertson, J. A. Kientz, M. S. Reynolds, and G. D. Abowd, “At the flick of a switch: Detecting and classifying unique electrical events on the residential power line (nominated for the best paper award),” in UbiComp, vol. 4717. Springer, 2007, pp. 271–288. [11] Y. Kim, T. Schmid, Z. Charbiwala, and M. B. Srivastava, “Viridiscope: design and implementation of a fine grained power monitoring system for homes,” in UbiComp. ACM, 2009, pp. 245–254. [12] X. Jiang, S. Dawson-Haggerty, P. Dutta, and D. E. Culler, “Design and implementation of a high-fidelity AC metering network,” in IPSN. ACM, 2009, pp. 253–264.
754