Jun 14, 2016 - Built-Environment Wind Turbines (BEWTs). ⢠Benefits o Clean and renewable o Visible o Distributed gener
Built-Environment Report Summary Ian Baring-Gould, Jason Fields, Robert Preus, & Frank Oteri June 14, 2016 PR-5000-66652
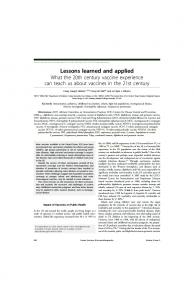
What Is the Built Environment? • Wind turbines installed in the urban environment can be: o Building mounted o Building integrated o Surface mounted near buildings.
• Unique considerations: o Existing design standards are not intended for urban environments. o Existing test protocols are not designed for urban environments.
Built-environment deployments. Illustration from Joe Smith
2
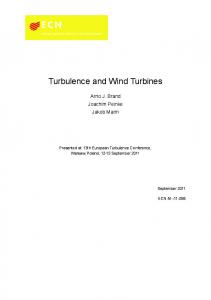
Built-Environment Wind Turbines (BEWTs) • Benefits o Clean and renewable o Visible o Distributed generation.
• Challenges o Safety o Reliability o Performance and economics.
Reliable information on wind turbines in the urban environment is needed!
Bahrain World Trade Center. Photo from iStock 6924031
3
BEWTs Recommended Practice • Report targeted to end users and decision makers • Key components: o o o o
Case studies Lessons learned Recommended practice Overview of BEWT standards.
• Includes contributions from: o
IEA Task 27 and BEWT studies (Blackamore, Mertens, Tabrizi, Toja, etc.)
• Specific to United States but applicable to other markets • Does not focus on buildingintegrated/flow-augmented turbines, but many of the principles apply. 4
Case Studies
Twelve West (OR) Photo from Flickr 4852149002
Pearson Square Court (NY) Photo from UGE
Boston Museum of Science (MA) Photo from Boston Museum of Science, NREL 18006
NASA Building 12 (TX) Photo by Dave Jager, NREL
Detroit Metro Airport (OH) Photo from Wayne County Airport Authority
Brooklyn Navy Yard (NY) Photo from Flickr 2874788682 NATIONAL RENEWABLE ENERGY LABORATORY
5
Case Studies Project Name
Twelve West
Detroit Metro Museum of Airport Science
Brooklyn Navy Pearson Yard Court Square
NASA Building 12
Location
Portland, OR
Romulus, MI
Boston, MA
Brooklyn, NY
Long Island City, NY
Houston, TX
Turbine Type
Skystream 3.7 (4)
Windspire (6)
Windspire (1) Skystream
AeroVironment AVX 1000 (6)
VisionAIR5 (3)
Eddy GT (4)
3.7 (1) Swift (1) Proven 6 (1) AeroVironment AVX1000 (5) Capacity
9.6 kW
7.2 kW
15.6 kW
6 kW
9.6 kW
4 kW
Year Installed
2009
2010
2009
2008
2014
2014
Operational
Operating
Operating at reduced capacity
Not operating
Operating
Operating
Roof Mounted? Owner View
Yes
Operating at reduced capacity No
Yes
Yes
Yes
Yes
Success
Underperform
Success
Underperform
Success
Underperform
NATIONAL RENEWABLE ENERGY LABORATORY
6
Lessons Learned – Overview • •
•
Planning Costs Performance and Reliability.
NASA Building 12, Phase 2. Photo from Mike Van Bavel 7
Lessons Learned: Project Planning •
•
•
•
•
Project feasibility and planning processes are insufficient and not well defined. Multi-objective projects tend to be perceived as more successful. The order in which objectives are prioritized can influence project outcomes. Potential liability and safety issues should be understood and addressed during the planning process. Concerns regarding a project’s impact on local aviation procedures can add unanticipated steps to the permitting process. BEWT installation in Japan. Photo from Breton Barker, U.S. Department of Energy 8
Lessons Learned: Project Costs Additional expenses from: Development / engineering o Installation o Maintenance o
tend to result in higher project costs. NASA Building 12 turbine installation. Photo from Dave Jager, National Renewable Energy Laboratory 9
Twelve West: Estimated vs. Actual Energy Estimated production: • ~9,000 kWh/year • 11% CF • LCOE: $2.846/kWh Actual production: • ~5,500 kWh/year • 7% CF • LCOE: $4.657/kWh
Twelve West wind turbine installation in Portland, OR. Photo from Flickr 4852149002
Average Portland retail rate: $0.1256/kWh. BEWT power is 37 times more expensive. 10
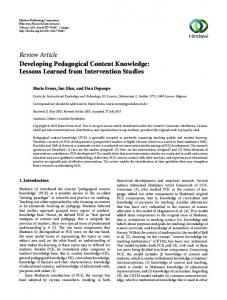
Lessons Learned: Project Performance •
•
•
When compared with actual production, BEWT project performance is often over-estimated. None of the case study projects met their energy production estimates. Consolidation of small turbine manufacturers has been common and can lead to loss of warranty and difficulty in service parts availability. Current national and international standards do not reflect wind conditions often seen in the built environment.
CFD simulation of flow around building. Image from Francisco Toja 11
NASA B12: Estimated vs. Actual Energy NASA Building 12 Predicted vs. Actual Energy (March 2015)
Turbine
Energy (Wh)
Capacity Factor (%)
60-W Light Bulb Duration (Hours)
1
16.54
0.0022%
0.28
2
59.10 33.12 8.16 7810.0
0.0079% 0.0045% 0.0011% 1.05%
0.99 0.55 0.14 130.17
3
4 UGE PWR*
*predicted energy from concurrent wind speed measurements and UGE power curve
NATIONAL RENEWABLE ENERGY LABORATORY
12
Key Conclusions - Outcomes/Risks • The team could not find an example of a BEWT project for which the energy production met pre-construction estimates. Measured CF range:


![Deployment of Wind Turbines in the Built Environment: Risks ... - NREL [PDF]](https://m.moam.info/img/260x300/deployment-of-wind-turbines-in-the-built-environme_64a2521e098a9eb96d8b468d.jpg)