Epidemiologic Reviews Advance Access published July 9, 2009 Epidemiologic Reviews Published by the Johns Hopkins Bloomberg School of Public Health 2009.
DOI: 10.1093/epirev/mxp005
Built Environments and Obesity in Disadvantaged Populations
Gina S. Lovasi, Malo A. Hutson, Monica Guerra, and Kathryn M. Neckerman Accepted for publication May 9, 2009.
In the United States, health disparities in obesity and obesity-related illnesses have been the subject of growing concern. To better understand how obesity-related health disparities might relate to obesogenic built environments, the authors conducted a systematic review of the published scientific literature, screening for studies with relevance to disadvantaged individuals or areas, identified by low socioeconomic status, black race, or Hispanic ethnicity. A search for related terms in publication databases and topically related resources yielded 45 studies published between January 1995 and January 2009 with at least 100 participants or area residents that provided information on 1) the built environment correlates of obesity or related health behaviors within one or more disadvantaged groups or 2) the relative exposure these groups had to potentially obesogenic built environment characteristics. Upon consideration of the obesity and behavioral correlates of built environment characteristics, research provided the strongest support for food stores (supermarkets instead of smaller grocery/convenience stores), places to exercise, and safety as potentially influential for disadvantaged groups. There is also evidence that disadvantaged groups were living in worse environments with respect to food stores, places to exercise, aesthetic problems, and traffic or crime-related safety. One strategy to reduce obesity would involve changing the built environment to be more supportive of physical activity and a healthy diet. Based on the authors’ review, increasing supermarket access, places to exercise, and neighborhood safety may also be promising strategies to reduce obesity-related health disparities. ethnic groups; health status disparities; obesity; residence characteristics; social class
Abbreviation: SES, socioeconomic status.
Americans or individuals reporting their race as black; and 3) individuals reporting their ethnicity as Hispanic or Latino. Built environment characteristics were evaluated for their relevance to obesity-related health disparities by considering whether they are correlated with body mass index or related behaviors within the target groups and also whether they are distributed in ways that differentially expose the target groups to obesogenic built environments.
INTRODUCTION
In the United States, health disparities in obesity and obesity-related illnesses have been the subject of growing concern (1–3). Obesity rates are higher among persons of low socioeconomic status (SES), black race, or Hispanic ethnicity (4–6). One possible explanation for these patterns involves differential exposure to ‘‘obesogenic’’ environments (7–10). With the goal of identifying promising approaches for reducing obesity-related health disparities, we have reviewed the published literature on how obesogenic built environment characteristics correlate with obesity and related health behaviors (i.e., dietary intake and physical activity). Although previous studies have reviewed research on this topic in general (11–24), our review is distinctive because of its focus on US studies with direct relevance to 3 target groups: 1) poor or low-SES individuals; 2) African
BACKGROUND
Persons of black race or Hispanic ethnicity are at higher risk of overweight or obesity, but this generalization obscures a more complex reality. Non-Hispanic black girls and women are more likely to be overweight or obese than non-Hispanic white girls and women (4). Mexican-American boys, girls, and women are more likely to be overweight than
Correspondence to Dr. Gina S. Lovasi, Robert Wood Johnson Foundation Health and Society Scholars Program, Institute of Social and Economic Research and Policy, Columbia University, 420 West 118th Street, Floor 8, Mail Code 3355, New York, NY 10027 (e-mail:
[email protected]).
1
2
Lovasi et al.
their non-Hispanic white counterparts (4). Among men in the United States, however, obesity prevalence is not consistently different across these racial and ethnic groups. (To simplify, we will drop ‘‘non-Hispanic’’ from the labels black and white for the remainder of this report.) There is also a strong socioeconomic gradient in overweight and obesity; again, the patterns are complex (5, 6, 25, 26). Race and ethnicity have both historic and contemporary influence on access to education, occupational status, income, and wealth; thus, socioeconomic characteristics might in part explain racial and ethnic differences in adiposity and health. Both neighborhood poverty and racial/ethnic composition may be associated with obesity, net of the effects of individual characteristics (27, 28). Residential segregation has played a key role in maintaining differences in socioeconomic status by race (29, 30). Thus, neighborhood disadvantage may play a dual role by both limiting economic opportunity and promoting obesity in already disadvantaged populations (31). In this context, however, our focus is on the built environment, including food sources, physical activity venues, and other physical features likely to affect obesity. The built environment includes aspects of one’s surroundings that are human made or modifiable, such as residential or commercial buildings, transportation infrastructure, and parks or other open spaces (22). Although evidence relating the built environment to obesity has recently been reviewed (22), we know little about whether these associations are consistent across population groups. The purpose of this review is to evaluate whether built environments might explain racial, ethnic, and socioeconomic disparities in obesity and to derive implications from this evidence about which built environment changes might reduce obesity-related health disparities. The complex patterns noted above suggest that a single answer will not serve to explain obesity disparities. An ecology of obesity that includes disparities for women but not men is particularly difficult to explain, given that residential segregation by gender is minimal. As such, understanding interactions by gender may be crucial, as we mention at several points in this review. Our primary intent, however, is to investigate whether built environment characteristics have consistent behavioral or health effects regardless of poverty, race, or ethnicity and whether disadvantaged socioeconomic, racial, or ethnic groups with high obesity rates are more likely to live in obesogenic environments. METHODS
We searched public health and transportation research databases (PubMed, an archive of over 18 million biomedical and life sciences journals; TRIS, Transportation Research Information Services; ISI Web of Knowledge, an online academic database provided by Thomson Scientific’s Institute for Scientific Information; and U-M Medsearch, a collection of databases provided by Ovid Technologies), screening a total of 817 abstracts from these sources. We also searched references from topical resources (23) and websites (www. activelivingresearch.org, www.ipenproject.org). Search terms were designed to identify studies with environmental measures related to one of the following:
A. Obesity—(neighborhood, physical environment, built environment, urban form, or urban design) and (obesity, overweight, or weight gain); B. Access to healthy foods—supermarket, grocery, food stores, fast food, or restaurants and neighborhood or access; or C. Physical activity—urban sprawl, walkability, land use mix, residential density, sidewalks, green space, recreational facilities, public transit, public transportation, block size, and street connectivity. These environment terms (A or B or C) were required to occur in combination with one or more relevant target population terms (poverty, race, black, ethnicity, Hispanic, inequality, or disparities). We included studies presenting original research articles with measures of the built environment, with a minimum of 100 study participants or area residents, in the setting of the United States, published in print or online between January 1, 1995, and January 27, 2009. On the basis of the experience of a previous review of the literature on the built environment and obesity, which found 0 relevant studies between 1966 and 2001, we decided not to search for earlier studies (22). We screened for studies that would answer at least 1 of the following 2 questions: 1) Which built environment characteristics are associated with dietary intake, physical activity, or obesity for individuals characterized by low SES, black race, or Hispanic ethnicity? and 2) Is the exposure to obesogenic environments more common for these same target groups? Data describing the design and results of each study were abstracted by a member of our research team using structured forms (M. A. H. or M. G.) and independently verified by a second team member (G. S. L.), who compared the information on the forms with the text and tables of the published paper. Discrepancies were resolved through further discussion or through reference to additional publications. Because study designs and operational definitions varied greatly among the studies included, we did not combine the study results using quantitative meta-analysis methods. Instead, we have described our findings in narrative form, with the results classified as related to the food environment, urban form or sprawl, places to exercise, aesthetics or physical disorder, and traffic or crime safety. In our discussion of urban form, we supplemented the published evidence with county-level population from the 2000 Census and sprawl index (32) data. The sprawl index was created by using county-level data on residential density and connectivity (small block size) as indicators of compact urban form, such that the scale has a mean of approximately 100 and a standard deviation of approximately 25. For each US county with a sprawl index (n ¼ 951), the percentage of individuals below the federal poverty line, percentage reporting black race, and percentage reporting Hispanic ethnicity were calculated using Summary File 3 data. Data were graphically represented by a scatterplot created in Stata, version 9.2, software (StataCorp LP, College Station, Texas) with circles scaled to represent county population size; a best-fitting line was drawn by using population size values as analytical weights.
Built Environment, Disadvantage, and Obesity
RESULTS
A total of 45 studies (2 of which are ancillary to others) met our inclusion criteria: 20 provided information on the effects of the built environment for our target groups, and 37 provided information on the exposure to the built environment (Table 1). Of these, 22 studies assessed the food environment, 10 assessed walkability or related measures of urban form, 18 assessed places to exercise ranging from sidewalks to gyms, and 15 assessed aesthetics or safety (Table 2). Eleven studies were national, 10 of the studies included between 2 and 20 noncontiguous sites, and the remainder were based in a single location. Only 12 studies relied entirely on self-report for their assessment of the environment, with the rest incorporating geographic information system data, field observations, or ratings provided by an independent sample of area residents. Environmental characteristics were used to predict dietary intake (n ¼ 5), physical activity (n ¼ 15), or body mass index (n ¼ 15). Stratification or comparisons by SES (n ¼ 35) or race (n ¼ 34) were more common than by Hispanic ethnicity (n ¼ 22). For each section below, we first discuss the effects on behavior or weight and then whether these effects are consistent, stronger, or weaker for our target groups (Table 2). Next, we discuss whether target groups seem to be differentially exposed to obesogenic built environment characteristics (Table 2). Food environment Effects of a healthy food environment. The local food environment has been identified as an important component of strategies to promote healthier dietary choices (33, 34). Studies of the food environment have commonly distinguished between large supermarkets and smaller grocery or convenience stores. For example, data from a multisite cohort study (35) indicate that proximity to a supermarket is associated with less overweight, obesity, and hypertension, whereas proximity to grocery or convenience stores was associated with more overweight, obesity, hypertension, and diabetes (36). In an interesting example of a genderenvironment interaction, proximity to ethnic markets and supermarkets was associated with higher body mass index among women but not men, suggesting that individual characteristics as well as store type may be important effect modifiers in the relation between proximity to food stores and dietary choices (37). Food prices, which have also been associated with weight change (38), may be important in explaining the different effect of food stores by type or by neighborhood composition (39). Yet, several studies have not found the expected correlation of local food environment characteristics with dietary intake or weight (37, 40, 41). The proximity of food stores, but not restaurants, appears to be correlated with dietary intake and weight for our target groups. Powell et al. (42) looked at a large, nationally representative sample of adolescents and found that having more convenience stores and fewer supermarkets was associated with higher body mass index, and that these associations were relatively stronger for black and Hispanic teenagers. Proximity to supermarkets was positively associ-
3
ated with fruit and vegetable consumption for black participants of the Atherosclerotic Risk in Communities (ARIC) Study (35) and for Food Stamp participants (43). Yet, no association was reported between density of food stores or restaurants among young children from low-income families (44). Inconsistent findings may reflect confounding of food store access with residence in denser urban environments, as discussed below. Although food stores and restaurants may be thought to affect obesity mainly through dietary intake, these have also gained limited attention as walking amenities or destinations (45, 46) and may be captured in land use measures. Access to a healthy food environment. Two national studies by Powell et al. (47) and Small and McDermott (48) analyzed national zip code-level data and reported that poorer neighborhoods had less access to supermarkets but more access to small grocery stores and convenience stores. Compared with supermarkets, small grocery stores and convenience stores may have produce that is poorer in quality (49, 50) and more expensive (51). Even when the distribution of food stores is uniform, food stores in poor areas may offer fewer opportunities to meet dietary guidelines (7). Additional studies with more limited geographic scope are consistent with the national studies, with most finding that poorer areas or predominately black neighborhoods had fewer supermarkets but more small grocery and convenience stores (35, 47–49, 51–54); as one exception, in their analysis of metropolitan areas, Small and McDermott (48) found that black neighborhoods had less access to both supermarkets and grocery stores. Latino neighborhoods may have the same disadvantage with respect to food stores (47, 53), but fewer studies have presented data on food store access by Hispanic ethnicity. A study in California reported that relatively poor individuals, African Americans, and Latinos were less likely than others to shop in their own census tract (55), a trend that may reflect the low availability or undesirability of closer food stores. Finer classifications of food stores based on detailed local environment data seem to corroborate the disadvantage experienced by our target populations with respect to food stores (37, 50, 51, 53, 56). However, some studies have reported that access to healthy foods was higher for predominately Hispanic areas (57, 58). Restaurants appear to be more concentrated in poor neighborhoods (48, 54) but less common in neighborhoods with a high proportion of black residents (48). These patterns may be specific to small- and medium-sized restaurants, with more equal access to large restaurants (48). Fast food restaurants, which have drawn much attention as potentially contributing to the obesity epidemic, may offer more healthful options in low-poverty and predominately white neighborhoods (7). The evidence for whether fast food restaurants are more common in disadvantaged neighborhoods is mixed, with some studies reporting more fast food in poor or minority neighborhoods (7, 37, 44, 59), while others do not (35, 54); there are also studies that find that area poverty predicts more fast food restaurants while predominately black race predicts less (60). Although many of the preceding studies have focused on the residential neighborhood, the abundance of food stores and restaurants near urban schools (58, 60, 61) suggests that both home and
Geographic Location
Population Included
Environment Assessment
Outcome Assessment
Behavior or Health Effects by Subgroup
Powell (47)
United States
28,050 zip codes
GIS: zip codes
Gordon-Larsen (8)
United States
17,950 adolescents; 42,187 block groups
GIS: block groups and 8-km buffers
Physical activity, body mass indexa
McDonald (77)
United States
14,553 children
GIS: block group
Physical activity (walking/biking to school)
By individual race, ethnicity
Sturm (38)
United States
6,918 children
GIS: zip codes
Body mass index change
By individual poverty, race, ethnicity
Sturm (58)
United States
31,622 secondary schools
GIS: 400-m and 800-m buffers
Zenk (60)
United States
King (87)
United States
31,243 secondary schools 2,912 women
GIS: census tracts and 0.5-mile buffersb Self-report
Brownson (79) Rose (43)
United States United States
1,818 adults 963 low-income adults
Powell (42)
Coterminous United States
Small (48)
Spatial Accessibility by Subgroup
By area poverty, race, ethnicity By area education, minority population
School-level free-meal eligibility, race, ethnicity Area race, ethnicity, income Physical activity
By individual race, ethnicity
By individual race, ethnicity
Self-report Self-report
Physical activity Nutrition (fruit and vegetable intake)
By household income Sample restricted to low-income adults
By household income
73,079 adolescents
GIS: zip codes
Body mass indexa
By individual race, ethnicity
US metropolitan areas
13,736 zip codes
GIS: zip codes
Burdette (105)
20 US cities
3,141 children
Self-report
Body mass index
By individual income, race, ethnicity
Lumeng (106)
10 US urban areas
768 children
Self-report
Body mass index
By maternal education, race
Eyler (82), Wilbur (127, 128), Evenson (129), Young (130), Ainsworth (131), Voorhees (132)
Multisite (Alabama, Illinois, Maryland, Missouri, North Carolina, New Mexico, South Carolina)
4,122 women
Self-report
Physical activity
By individual race, ethnicity
Morland (35)
Multisite (Mississippi, North Carolina, Maryland, Minnesota)
10,763 adults
GIS: census tracts
Nutrition (fruit and vegetable intake)
By individual race
Morland (54)
Multisite (Mississippi, North Carolina, Maryland, Minnesota)
216 census tracts
GIS: census tracts
Wang (37, 133)
Monterey, Salinas, Modesto, and San Luis Obispo, California
7,595 adults
GIS: census-based neighborhoods, with city planner input
Body mass index, nutrition (intake by food type)
By individual income, race, ethnicity
By area socioeconomic status
Mujahid (56, 57), Moore (134)
Multisite (North Carolina, Maryland, New York)
2,865 adults
Aggregated informant ratings; GIS: kernel smoothing
Body mass index, nutrition index
By individual race, ethnicity, education, and income
By individual socioeconomic status, race, and ethnicity and by area poverty
By area poverty, race, foreign born
By individual race
By area socioeconomic status, area race
Lovasi et al.
First Author (Reference(s))
4
Table 1. Characteristics of Studies of Potential Obesogenic Environmental Factors in Disadvantaged Populations or Areas in the United States, January 1995–January 2009
Franco (50), Moore (53, 96)
Multisite (North Carolina, Maryland, New York)
685 census tracts
GIS: census tracts, observer ratings
Boehmer (90)
Multisite (Missouri, Tennessee, Arkansas)
2,210 adults
Self-report
Body mass indexa
By income
Boehmer (86)
Savannah, Georgia, and St. Louis, Missouri
1,032 adults
GIS: 0.4-km buffers and self-report
Physical activity, body mass indexa
By individual income
Oakes (78)
Minneapolis-St. Paul, Minnesota, metropolitan area
702 adults
GIS: 805- 3 805-m neighborhoods
Physical activity (overall and walking)
By individual education, income, race, ethnicity
By individual income
Lovasi (70), Rundle (135)
New York, New York
13,102 adults
GIS: 1-km buffer and zip code
Body mass index
By individual education, income, race, ethnicity
By individual education, income, race, ethnicity
Weir (101)
New York, New York, and suburbs
307 parent-child pairs
Parent-report
Physical activity
By area poverty
By individual race, ethnicity
Galvez (136)
East Harlem, New York
165 census blocks
Field observation
By area race, ethnicity
Block (59)
New Orleans, Louisiana
156 census tracts
GIS: buffered census tracts
By area socioeconomic status, race
Estabrooks (94)
A small midwestern city
32 census tracts
GIS: census tracts
By area socioeconomic status
Kerr (73)
King County, Washington
259 children
Self-report and GIS: buffers
Physical activity (walking/biking to school)
By area income
Frank (71, 75), Kerr (72)
Atlanta, Georgia
13,065 adults and 3,161 children
GIS: 1-km buffers
By individual education, income, race
Wilson (89)
Southeast, rural
1,194 adults
Self-report and GIS: buffers
Physical activity (walking), body mass indexa Physical activity
Huston (92)
North Carolina
1,796 adults
Self-report
Physical activity
Felton (95)
South Carolina
1,668 girls
Self-report
Sharpe (91)
2 adjacent counties in South Carolina
1,176 women
Self-report
Physical activity, body mass index Physical activity
Wilcox (93)
Fairfield County, South Carolina Cincinnati, Ohio
102 women
Self-report
Physical activity
7,020 children
Body mass index
Zenk (52)
Detroit metropolitan area (3 counties), Michigan
869 census tracts
GIS: governmentdefined neighborhoods GIS: census tracts
Zenk (49)
Detroit, Michigan
4 communities
GIS: communities, field observation
By area socioeconomic status, race
Sharkey (137)
6-county rural region of Texas
101 census block groups
GIS: census block groups, field observation
By area deprivation, race, ethnicity
By individual education, income, race By area socioeconomic status By individual education, race
By individual race
By individual race
By individual race
By individual race By individual education, race By individual income
By area poverty, race
Table continues
Built Environment, Disadvantage, and Obesity
Burdette (44)
By area poverty, race, ethnicity
5
By individual race, ethnicity; by area poverty
Urban form: density, connectivity, and land use mix
a
Abbreviation: GIS, geographic information system, which is followed by the area definition used. Based on self-reported height and weight. b Metric equivalent ¼ 804 m.
Body mass index z score GIS: buffers and townships, satellite images Marion County, Indiana Liu (40), Bell (140)
7,334 children and adolescents
GIS: communities
Self-report and GIS: census tracts 883 adults Balfour (103)
2 communities Chicago, Illinois
Alameda County, California
Block (51)
Rater and GIS: census tract St. Louis and eastern St. Louis County, Missouri Baker (7)
220 census tracts
GIS: block group, field observation St. Louis, Missouri, and surrounding metropolitan area Kelly (139)
1,780 street segments within 210 block groups
GIS: school attendance areas, street audits Austin, Texas Zhu (104)
73 public elementary schools
El Paso, Texas Rutt (74, 138)
452 adults
GIS: buffers
Walking, physical activity, body mass index,a nutrition
Behavior or Health Effects by Subgroup Outcome Assessment Environment Assessment Population Included Geographic Location First Author (Reference(s))
Table 1. Continued
school neighborhoods should be measured for more complete assessment of children’s exposure.
Individual race, ethnicity, and socioeconomic status (insurance status)
By area race
By area poverty race
By area poverty, race
By area poverty, race
By area poverty, ethnicity
By individual socioeconomic status, ethnicity
Lovasi et al.
Spatial Accessibility by Subgroup
6
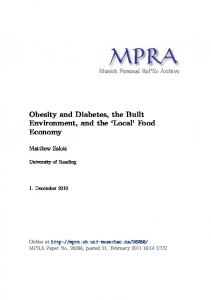
Effects of walkable urban form. A large number of studies have examined the relation between urban form and travel behavior, physical activity, or obesity. More specifically, commonly measured urban form characteristics thought to be conducive to walking for transportation include higher residential density, higher connectivity, and land use mix (62). ‘‘Walkable’’ neighborhoods with these characteristics have been reported to support physical activity and a lower body mass index (27, 45, 63–67). Grocery stores and restaurants may be particularly attractive walking destinations (45, 46), suggesting that these may influence both diet and physical activity. Sprawl, in contrast with walkability, has been characterized by low density, poor connectivity, and segregated land uses. Residence in a high-sprawl county may hinder physical activity and promote obesity (41, 68, 69). Although several authors have proposed that a walkable or compact built environment may be more important for disadvantaged than advantaged groups (22, 28), the evidence currently available points in the opposite direction. A few studies have reported results stratified by income, race, or ethnicity, permitting an assessment of the relevance of walkable or sprawling environments for our target groups. A large study in New York City found that walkability indicators were not associated with body mass index among individuals with lower SES, black race, or Hispanic ethnicity (70). Likewise, measures of sprawl or related characteristics were less associated with walking among black men in a survey of adults in Atlanta, Georgia (71), or among nonwhite and low-income youth (72). Urban form characteristics had stronger effects on youth in households with higher levels of car ownership (72), suggesting that ‘‘captive walkers’’ without access to a vehicle are less responsive to the built environment. Similarly, interactions have been observed in other studies, suggesting that walkability or sprawl may be less correlated with walking or body mass index for our target groups (73–75) or for individuals facing a different array of personal barriers to physical activity participation (76). In contrast to this general trend, a national study of walking and biking to school found that children in denser areas were more likely to have an active commute regardless of individual race or ethnicity (77). One study suggested that associations of density and connectivity with physical activity were stronger within disadvantaged groups in the Twin Cities area, but results were not shown and were only marginally significant (78). Access to walkable urban form. There is little evidence that our target groups are disadvantaged with respect to walkable urban form. Low-income, black, and Hispanic populations disproportionately reside in areas with higher population density and a more compact, low sprawl (32) urban form (Figure 1). Data in Figure 1 are based on the 2000 US Census data for 951 counties, and the positively sloped lines indicate a trend toward more density and more compact urban forms in the US counties where a greater
Built Environment, Disadvantage, and Obesity
7
Table 2. Evidence on Obesogenic Environmental Characteristics That Could Explain Obesity Risk Among Disadvantaged Populations or Areas in the United States, January 1995–January 2009 Whether Target Groups Were Adversely Affected by This Obesogenic Environmental Characteristic (Reference(s))
Whether Target Groups Were Disproportionately Exposed to This Obesogenic Environmental Characteristic (Reference(s))
Food environment Lack of supermarkets/inexpensive produce sources
Yes (35, 42, 43, 134); mixed (38); no (40, 90)
Yes (35, 47–54, 56); mixed (37, 57, 136); no (134, 137)
Presence of small grocery or convenience stores
Yes (42); no (35)
Yes (35, 37, 47, 50, 53, 54, 137); mixed (48, 58, 136)
Restaurants of all types
No (35, 38)
Mixed (48, 54, 58, 60, 136); no (35)
Fast food outlets
No (35, 37, 38, 40, 44)
Yes (7, 35, 37, 44, 59); mixed (60); no (37, 54)
Yes (77); mixed (71, 72, 78); no (70, 73–75, 140)
Mixed (48, 75); no (40, 54, 70, 71, 74, 78, 104) (Figure 1, this report)
Mixed (82); no (87)
Yes (139); mixed (82, 87, 93, 104); no (79, 89, 91, 92)
Urban form Low walkability, car-oriented sprawl (low density, low connectivity, separation of land uses) Places to exercise Lacking sidewalks/sidewalks in poor condition Lacking nearby parks and trails
Mixed (89); no (44)
Yes (8, 44, 92, 94); mixed (79); no (93, 95, 96)
Lacking exercise facilities or places to be active
Yes (72, 86, 90)
Yes (8, 79, 89, 91, 94, 96); no (74, 95)
Aesthetic problems or physical disorder
Yes (79); no (87)
Yes (56, 79, 89, 95, 103, 104); mixed (57, 87); no (82)
Lack of safety because of crime or traffic
Yes (44, 82, 101); no (87)
Yes (56, 79, 89, 92, 95, 101, 104–106); mixed (57, 87, 93); no (91)
Safety and aesthetics
proportion of residents are from our target groups. Regional studies also indicate that our target groups commonly reside in areas with compact urban form (40, 70, 71, 74). National evidence further indicates that the availability of potential walking destinations is high for predominately Hispanic areas but low for predominately black areas (48). Sidewalks, parks, and exercise facilities Effects of places to be physically active. Physical activity outside the home may take place along neighborhood streets, on walking or biking trails, in parks, or in exercise facilities such as gymnasiums or pools (79, 80). Lacking access to such places may discourage physical activity (81, 82) and promote obesity (83). Walking, the most common physical activity in the United States (84), frequently occurs along neighborhood streets (80), making streets and sidewalks a key venue for physical activity (18). The importance of neighborhood exercise facilities for supporting physical activity has been documented (8, 79, 81), but not all studies have replicated this finding or demonstrated its relevance for weight change (85). Further, proximity to exercise facilities may not be sufficient to affect behavior for all populations, especially if additional barriers such as cost, restricted operating hours, or poor maintenance are present. Interestingly, locations commonly used for exercise differ by income level and gender, with low-income individuals more likely to use shopping malls and high-income individuals more likely to use treadmills (79).
We have some evidence that well-maintained sidewalks, trails, and exercise facilities may support physical activity behavior for our target populations. In one study, poor sidewalk condition was associated with obesity among lowerincome participants, while a lack of sidewalks was more important among high-income participants (86). Studies failing to find an association between the presence of sidewalks and activity (82, 87, 88) may therefore offer an incomplete picture if they do not incorporate sidewalk condition. On the other hand, trails and physical activity facilities were associated with activity in a diverse sample of adolescent girls (88), and proximity to trails was associated with more regular activity for adults living in low-SES areas (89). In one study of rural residents, the perception of a lack of places to be physically active was associated with being obese and inactive, and this association was stronger among lower-income participants (90). However, other studies have not found the expected associations of places for exercise with physical activity or weight among individuals in our target groups (44, 82, 89, 91). Access to places to be physically active. The evidence was mixed on whether our target groups had more or less access to sidewalks or streetlights. One study found sidewalks, streetlights, and trails to be more common in AfricanAmerican neighborhoods (92), while others found that African-American participants were less likely to report streetlights (93) or sidewalks in their neighborhoods (87, 89, 93). In a national study, African-American participants reported fewer neighborhood sidewalks compared with
8
Lovasi et al.
D)
A)
6
Log(sprawl index)
Log(housing units/km2)
10
5
5
0 4 0
10
20
30
0
40
Percent Below Federal Poverty Line
E)
10
Log(sprawl index)
Log(housing units/km2)
B)
10
20
30
40
Percent Below Federal Poverty Line
5
6
5
0 4 0
20
40
60
80
0
Percent Reporting Black Race
F)
10
Log(sprawl index)
Log(housing units/km2)
C)
20
40
60
80
Percent Reporting Black Race
5
6
5
0 4 0
20
40
60
80
100
Percent Reporting Hispanic Ethnicity
0
20
40
60
80
100
Percent Reporting Hispanic Ethnicity
Figure 1. Residential density and sprawl in 951 US counties and population characteristics from the year 2000 Census. Residential density, as shown in panels A, B, and C, is measured as the number of housing units per square kilometer; the sprawl index, as shown in panels D, E, and F, is based on both residential density and block size, with higher values indicating less sprawl. Circle size is proportional to population size; the bestfitting line is shown, weighting counties by population size; positive slopes indicate that target groups are more likely to live in dense and/or compact counties.
white participants, but Hispanic participants were the group most likely to report sidewalks as well as streetlights in their neighborhoods (87). Although sidewalks and streetlights appear to be more common in low-SES areas (79, 89, 92), perhaps because low-income and minority neighborhoods tend to be more highly urbanized, this finding has not been uniform (74); trails, on the other hand, appear to be more common in high-SES areas (92). Brownson et al. (79) reported that low-income groups perceived less access to indoor and outdoor places to exercise. This perception was corroborated by findings from a national study that a comprehensive set of physical activity facilities (including both public and private, indoor and
outdoor facilities) was less common in low-SES or AfricanAmerican neighborhoods (8). This pattern has been supported by the findings of several smaller studies (44, 89, 93, 94), although others report no difference (74, 93, 95) or that the target groups are only at a disadvantage in terms of access to indoor physical activity facilities (91, 96). Aesthetics and safety Effects of an attractive and safe environment. Aesthetic features are discussed alongside safety indicators, because both may contribute to a feeling of safety and comfort. Here, we consider aesthetic features discussed in the literature,
Built Environment, Disadvantage, and Obesity
which include both positive features such as architectural details or green space and negative features such as physical disorder. Physical disorder and social disorder have been associated with lower physical activity (97), higher body mass index (56, 85, 86), and higher mortality (98). Pleasant aesthetics or green space have also been linked to reduced health disparities (99) and to lower obesity risk, with some suggestion that this association may be stronger for children in urban areas (40) or for women (90). There are only a few studies that have considered the associations of aesthetics and safety with physical activity or body mass index within our target groups. One national study, however, reported that enjoyable scenery was a particularly important determinant of physical activity among lower-income participants (79). Another study found the opposite, that unattractive or unsafe neighborhoods were more strongly associated with obesity among higher-income groups (86). Unattended dogs, while a potential barrier to physical activity (100), have not been associated with physical activity among Latina or African-American women (82, 87). In interpreting results from these and other studies of aesthetics or pedestrian comfort, we should keep in mind that interpretation of the environment plays a key role in determining aesthetic appeal. An interest in safe environments, however, may be a more universal concern, especially when it comes to the environments experienced by children. In fact, one study found that parental anxiety about safety was more negatively correlated with activity for children from a low-income urban neighborhood than for their suburban counterparts (101). In a study of children from low-income families, the 9-1-1 call rate, but not arrest rate, was associated with obesity; however, the association was nonlinear, and there was no significant interaction with race (44). Perceived safety from crime has been associated with physical activity for AfricanAmerican women in Chicago, Illinois (102), but other studies of African-American or Latina women have not found similar patterns (82). A national survey found that AfricanAmerican women ranked lacking a safe place to exercise as their number 1 barrier to physical activity (87) but did not find a significant association between perceived safety and physical activity, calling into question standard methods for assessing the level of safety and its relevance for physical activity. Access to an attractive and safe environment. Lowincome and minority populations tend to live in neighborhoods that are perceived as less attractive and less safe. For example, black respondents have reported ease of walking in their neighborhoods to be lower (87, 95), and individuals living in low-SES or predominantly black neighborhoods have been more likely to report problems such as noise or disorder (103) or the presence of strangers’ dogs (87, 89, 92, 93). Compared with high-SES respondents, low-SES individuals report perceptions of their neighborhoods as more unpleasant, with worse neighborhood crime, heavier traffic, and less trustworthy neighbors (89). Other studies corroborate these patterns, with low-SES respondents reporting more aesthetic and safety problems (79, 104). Finally, hills may be less common in low-SES areas (74, 79), limiting the opportunities for scenic lookouts.
9
Perceptions of worse neighborhood safety by low-SES, black, or Hispanic individuals have been reported by several studies (87, 95, 101, 105, 106). Yet, a study based near New York City reported no racial difference in perceived safety (101), and blacks and Hispanics in a multisite study both reported higher safety and better aesthetics than did their white counterparts after controlling for individual SES (57); however, higher SES remained positively associated with both aesthetic and safety measures in the multisite study (57) and others (93). Heavy traffic and crime may both contribute to the perception that low-SES or black neighborhoods are less safe (92, 101), although heavy traffic may be less common in some African-American neighborhoods (93).
DISCUSSION
Although the built environmental characteristics discussed above may vary in their consequences and meaning depending on regional or local context, a few patterns appear to be consistent across the United States (Table 2). When considering the obesity-related effects of built environment characteristics, we found the strongest support for the importance of food stores, exercise facilities, and safety as potentially influential for our target groups (low-SES, black, and Hispanic individuals). We also found evidence that the target groups were at a disadvantage with respect to food stores, fast food outlets, places to exercise, and problems related to aesthetic and safety perceptions. We can reject low walkability or sprawling urban form as a candidate explanation of obesity-related health disparities; these measures seemed relatively less correlated with physical activity and obesity for individuals within our target groups, while at the same time the target groups were not at a disadvantage with regard to the walkability as commonly measured. The specific characteristics that seem most relevant to obesity-related health disparities in the United States are supermarket access, exercise facilities, and safety; each of these has been reported to be correlated with body mass index or related behaviors within our target groups, while at the same time being distributed to their disadvantage. Previous reviews have also noted that built environment effects are less consistently associated with obesity (22) or physical activity (20) for low-income or minority individuals. The weaker associations may reflect life circumstances in which more basic needs eclipse the influence of the built environment (107, 108). A few evaluations of built environment changes have considered who benefits the most from new resources such as exercise trails (109). The pattern that emerges from these and other types of investigations (110) suggests that advantaged subgroups benefit the most from new resources when they are provided at the same level to all. Thus, a built environment improvement may increase health disparities unless disadvantaged groups are specifically targeted. Targeted approaches to improve the built environment may be appropriate given findings in this and previous reviews that disadvantaged groups live in environments that may be more obesogenic with regard to the availability of opportunities to purchase healthy food (111) and to participate in physical activity (112).
10
Lovasi et al.
Of course, built environment and policy interventions should be considered in the context of other strategies for behavior change, including health promotion efforts (113) and marketing strategies (2, 114). Economic incentives may particularly affect behavior among lower-income groups (38), potentially decreasing health disparities. Other important considerations and historic trends should be considered when evaluating the findings of this review. Disparities in access to transportation (115) may raise concerns beyond the immediate health effects, because of the effects on access to employment and wellbeing. Over the long term, one’s neighborhood may affect not only the inclination to be physically active but also one’s ability to walk and live independently (103). In addition, although this review focused on the ways that neighborhoods can affect behavior, stress may be another important element for explaining health disparities (116). Social environmental characteristics such as collective efficacy are correlated with built environment characteristics (117), potentially representing a cause or a consequence of these. The risk factor approach to epidemiology has been criticized because of concern that it fails to ask how exposures come into being and are distributed within populations (118, 119). This review begins to synthesize the epidemiologic literature in order to promote investigations of these broader questions. It will be important to understand the historical context in which the current patterns arose and the way built environment characteristics vary in their importance for shaping behavior and health. A better understanding of the status quo and who benefits from it may help us to anticipate the effects of changing or even studying the built environment. Preferences with regard to place are complex, such that changes made in the name of public health or health equity may not be welcomed by everyone (29, 120). The process of change may be crucial in efforts to eliminate health disparities (120, 121). The potential for mistrust of built environment interventions is rooted in the history of such interventions, including racial segregation, use of eminent domain for urban renewal, and housing projects (29, 122). Populations that may deserve special consideration include public housing residents (123) and homeless individuals (124), but these groups have been excluded from much of the research on the built environment. The patterns documented in this review are specific to the contemporary United States and have not been constant over time (125, 126) or across different types of places. Rural communities and cities do not provide the same opportunities or barriers (90), and health promotion efforts will likely have to be tailored to the local environment. For example, produce availability and quality may be less correlated with obesity in rural settings (90), suggesting that promoting supermarkets or farmers’ markets may not be the right approach to reducing obesity in rural areas. Limitations of our study and the current literature include the lack of agreement on methods for assessing built environment characteristics and their consequences. In addition, some resources may have been omitted despite our extensive search: Books and unpublished reports were not included in this review, and the exclusion of unpublished findings could lead to publication bias such that null results
are underrepresented. Further, the quality of environmental measurement may differ across studies in a nonrandom way; for example, urban form indicators such as land use mix have been more readily available as geographic information system data, while measures of availability and quality of exercise venues and aesthetic features were more often based on participants’ perceptions. In conclusion, targeted increases in supermarket access, places to exercise, and safety may be especially promising strategies to reduce obesity-related health disparities.
ACKNOWLEDGMENTS
Author affiliations: Robert Wood Johnson Foundation Health and Society Scholars Program, Columbia University, New York, New York (Gina S. Lovasi); Department of City and Regional Planning, University of California, Berkeley, California (Malo A. Hutson); Department of Urban Planning, University of Michigan, Ann Arbor, Michigan (Monica Guerra); and Center for Health and the Social Sciences, University of Chicago, Chicago, Illinois (Kathryn M. Neckerman). This work was supported by the Robert Wood Johnson Foundation Health and Society Scholars Program. The authors would like to thank John Antos for assistance in the design of their abstraction forms. Conflict of interest: none declared.
REFERENCES 1. Mensah GA. Eliminating disparities in cardiovascular health: six strategic imperatives and a framework for action. Circulation. 2005;111(10):1332–1336. 2. Kumanyika S, Grier S. Targeting interventions for ethnic minority and low-income populations. Future Child. 2006; 16(1):187–207. 3. Eyre H, Kahn R, Robertson RM, et al. Preventing cancer, cardiovascular disease, and diabetes: a common agenda for the American Cancer Society, the American Diabetes Association, and the American Heart Association. Circulation. 2004;109(25):3244–3255. 4. Ogden CL, Carroll MD, Curtin LR, et al. Prevalence of overweight and obesity in the United States, 1999–2004. JAMA. 2006;295(13):1549–1555. 5. Mujahid MS, Diez Roux AV, Borrell LN, et al. Crosssectional and longitudinal associations of BMI with socioeconomic characteristics. Obes Res. 2005;13(8):1412–1421. 6. Wang Y, Zhang Q. Are American children and adolescents of low socioeconomic status at increased risk of obesity? Changes in the association between overweight and family income between 1971 and 2002. Am J Clin Nutr. 2006; 84(4):707–716. 7. Baker EA, Schootman M, Barnidge E, et al. The role of race and poverty in access to foods that enable individuals to adhere to dietary guidelines [electronic article]. Prev Chronic Dis. 2006;3(3):A76. 8. Gordon-Larsen P, Nelson MC, Page P, et al. Inequality in the built environment underlies key health disparities in physical activity and obesity. Pediatrics. 2006;117(2):417–424.
Built Environment, Disadvantage, and Obesity
9. Reidpath DD, Burns C, Garrard J, et al. An ecological study of the relationship between social and environmental determinants of obesity. Health Place. 2002;8(2): 141–145. 10. Ravussin E, Bouchard C. Human genomics and obesity: finding appropriate drug targets. Eur J Pharmacol. 2000; 410(2-3):131–145. 11. Frank LD, Engelke PO. The built environment and human activity patterns: exploring the impacts of urban form on public health. J Plann Lit. 2001;16(2):202–218. 12. French SA, Story M, Jeffery RW. Environmental influences on eating and physical activity. Annu Rev Public Health. 2001;22:309–335. 13. Handy SL, Boarnet MG, Ewing R, et al. How the built environment affects physical activity: views from urban planning. Am J Prev Med. 2002;23(2 suppl):64–73. 14. Humpel N, Owen N, Leslie E. Environmental factors associated with adults’ participation in physical activity: a review. Am J Prev Med. 2002;22(3):188–199. 15. Hoehner CM, Brennan LK, Brownson RC, et al. Opportunities for integrating public health and urban planning approaches to promote active community environments. Am J Health Promot. 2003;18(1):14–20. 16. Saelens BE, Sallis JF, Frank LD. Environmental correlates of walking and cycling: findings from the transportation, urban design, and planning literatures. Ann Behav Med. 2003;25(2): 80–91. 17. Lee C, Moudon AV. Physical activity and environment research in the health field: implications for urban and transportation planning practice and research. J Plann Lit. 2004; 19(2):147–181. 18. Owen N, Humpel N, Leslie E, et al. Understanding environmental influences on walking; review and research agenda. Am J Prev Med. 2004;27(1):67–76. 19. Ewing R. Can the physical environment determine physical activity levels? Exerc Sport Sci Rev. 2005;33(2): 69–75. 20. Davison KK, Lawson CT. Do attributes in the physical environment influence children’s physical activity? A review of the literature [electronic article]. Int J Behav Nutr Phys Act. 2006;3:19. 21. McNeill LH, Kreuter MW, Subramanian SV. Social environment and physical activity: a review of concepts and evidence. Soc Sci Med. 2006;63(4):1011–1022. 22. Papas MA, Alberg AJ, Ewing R, et al. The built environment and obesity. Epidemiol Rev. 2007;29(1):129–143. 23. Transportation Research Board. Does the Built Environment Influence Physical Activity? Examining the Evidence. (TRB Special Report 282). Washington, DC: Transportation Research Board, Institute of Medicine, The National Academies; 2005. 24. Booth SL, Sallis JF, Ritenbaugh C, et al. Environmental and societal factors affect food choice and physical activity: rationale, influences, and leverage points. Nutr Rev. 2001;59(3 pt 2):S21–S39; discussion S57–S65. 25. Kim S, Symons M, Popkin BM. Contrasting socioeconomic profiles related to healthier lifestyles in China and the United States. Am J Epidemiol. 2004;159(2):184–191. 26. McLaren L. Socioeconomic status and obesity. Epidemiol Rev. 2007;29(1):29–48. 27. Rundle A, Diez Roux AV, Freeman LM, et al. The urban built environment and obesity in New York City: a multilevel analysis. Am J Health Promot. 2007;21(4 suppl):326–334. 28. Black JL, Macinko J. Neighborhoods and obesity. Nutr Rev. 2008;66(1):2–20.
11
29. Fullilove MT. Root Shock. How Tearing Up City Neighborhoods Hurts America, and What We Can Do About It. New York, NY: Balantine Books; 2004. 30. Williams DR, Collins C. Racial residential segregation: a fundamental cause of racial disparities in health. Public Health Rep. 2001;116(5):404–416. 31. Macintyre S. Deprivation amplification revisited; or, is it always true that poorer places have poorer access to resources for healthy diets and physical activity? [electronic article]. Int J Behav Nutr Phys Act. 2007;4:32. 32. Ewing R, Brownson RC, Berrigan D. Relationship between urban sprawl and weight of United States youth. Am J Prev Med. 2006;31(6):464–474. 33. American Heart Association Nutrition Committee Lichtenstein AH, Appel LJ, et al. Diet and lifestyle recommendations revision 2006: a scientific statement from the American Heart Association Nutrition Committee. Circulation. 2006;114(1):82–96. 34. Wing RR, Goldstein MG, Acton KJ, et al. Behavioral science research in diabetes: lifestyle changes related to obesity, eating behavior, and physical activity. Diabetes Care. 2001; 24(1):117–123. 35. Morland K, Wing S, Diez Roux A. The contextual effect of the local food environment on residents’ diets: the Atherosclerosis Risk in Communities Study. Am J Public Health. 2002;92(11):1761–1767. 36. Morland K, Diez Roux AV, Wing S. Supermarkets, other food stores, and obesity: the Atherosclerosis Risk in Communities Study. Am J Prev Med. 2006;30(4):333–339. 37. Wang MC, Kim S, Gonzalez AA, et al. Socioeconomic and food-related physical characteristics of the neighbourhood environment are associated with body mass index. J Epidemiol Community Health. 2007;61(6):491–498. 38. Sturm R, Datar A. Body mass index in elementary school children, metropolitan area food prices and food outlet density. Public Health. 2005;119(12):1059–1068. 39. Ford PB, Dzewaltowski DA. Disparities in obesity prevalence due to variation in the retail food environment: three testable hypotheses. Nutr Rev. 2008;66(4):216–228. 40. Liu GC, Wilson JS, Qi R, et al. Green neighborhoods, food retail and childhood overweight: differences by population density. Am J Health Promot. 2007;21(4 suppl):317–325. 41. Lopez RP. Neighborhood risk factors for obesity. Obesity (Silver Spring). 2007;15(8):2111–2119. 42. Powell LM, Auld MC, Chaloupka FJ, et al. Associations between access to food stores and adolescent body mass index. Am J Prev Med. 2007;33(4 suppl):S301–S307. 43. Rose D, Richards R. Food store access and household fruit and vegetable use among participants in the US Food Stamp Program. Public Health Nutr. 2004;7(8):1081–1088. 44. Burdette HL, Whitaker RC. Neighborhood playgrounds, fast food restaurants, and crime: relationships to overweight in low-income preschool children. Prev Med. 2004;38(1): 57–63. 45. Moudon AV, Lee C, Cheadle AD, et al. Operational definitions of walkable neighborhood: theoretical and empirical insights. J Phys Act Health. 2006;3(suppl 1):S99–S117. 46. Cerin E, Leslie E, du Toit L, et al. Destinations that matter: associations with walking for transport. Health Place. 2007; 13(3):713–724. 47. Powell LM, Slater S, Mirtcheva D, et al. Food store availability and neighborhood characteristics in the United States. Prev Med. 2007;44(3):189–195. 48. Small ML, McDermott M. The presence of organizational resources in poor urban neighborhoods: an analysis of
12
49.
50. 51. 52.
53. 54. 55. 56.
57.
58. 59. 60. 61.
62. 63. 64.
65. 66.
67.
Lovasi et al.
average and contextual effects. Soc Forces. 2006;84(3): 1697–1724. Zenk SN, Schulz AJ, Israel BA, et al. Fruit and vegetable access differs by community racial composition and socioeconomic position in Detroit, Michigan. Ethn Dis. 2006; 16(1):275–280. Franco M, Diez Roux AV, Glass TA, et al. Neighborhood characteristics and availability of healthy foods in Baltimore. Am J Prev Med. 2008;35(6):561–567. Block D, Kouba J. A comparison of the availability and affordability of a market basket in two communities in the Chicago area. Public Health Nutr. 2006;9(7):837–845. Zenk SN, Schulz AJ, Israel BA, et al. Neighborhood racial composition, neighborhood poverty, and the spatial accessibility of supermarkets in metropolitan Detroit. Am J Public Health. 2005;95(4):660–667. Moore LV, Diez Roux AV. Associations of neighborhood characteristics with the location and type of food stores. Am J Public Health. 2006;96(2):325–331. Morland K, Wing S, Diez Roux A, et al. Neighborhood characteristics associated with the location of food stores and food service places. Am J Prev Med. 2002;22(1):23–29. Inagami S, Cohen DA, Finch BK, et al. You are where you shop: grocery store locations, weight, and neighborhoods. Am J Prev Med. 2006;31(1):10–17. Mujahid MS, Roux AV, Shen M, et al. Relation between neighborhood environments and obesity in the Multi-Ethnic Study of Atherosclerosis. Am J Epidemiol. 2008;167(11): 1349–1357. Mujahid MS, Diez Roux AV, Morenoff JD, et al. Assessing the measurement properties of neighborhood scales: from psychometrics to ecometrics. Am J Epidemiol. 2007;165(8): 858–867. Sturm R. Disparities in the food environment surrounding US middle and high schools. Public Health. 2008;122(7): 681–690. Block JP, Scribner RA, DeSalvo KB. Fast food, race/ethnicity, and income: a geographic analysis. Am J Prev Med. 2004; 27(3):211–217. Zenk SN, Powell LM. US secondary schools and food outlets. Health Place. 2008;14(2):336–346. Austin SB, Melly SJ, Sanchez BN, et al. Clustering of fastfood restaurants around schools: a novel application of spatial statistics to the study of food environments. Am J Public Health. 2005;95(9):1575–1581. Cervero R, Kockelman K. Travel demand and the 3Ds: density, diversity, and design. Transp Res D. 1997;2(3):199–219. Saelens BE, Sallis JF, Black JB, et al. Neighborhood-based differences in physical activity: an environment scale evaluation. Am J Public Health. 2003;93(9):1552–1558. Frank LD, Schmid TL, Sallis JF, et al. Linking objectively measured physical activity with objectively measured urban form: findings from SMARTRAQ. Am J Prev Med. 2005; 28(2 suppl 2):117–125. Leslie E, Saelens B, Frank L, et al. Residents’ perceptions of walkability attributes in objectively different neighbourhoods: a pilot study. Health Place. 2005;11(3):227–236. Hoehner CM, Brennan Ramirez LK, Elliott MB, et al. Perceived and objective environmental measures and physical activity among urban adults. Am J Prev Med. 2005; 28(2 suppl 2):105–116. Berke EM, Koepsell TD, Moudon AV, et al. Association of the built environment with physical activity and obesity in older persons. Am J Public Health. 2007;97(3): 486–492.
68. Ewing R, Schmid T, Killingsworth R, et al. Relationship between urban sprawl and physical activity, obesity, and morbidity. Am J Health Promot. 2003;18(1):47–57. 69. McCann BA, Ewing R. Measuring the Health Effects of Sprawl. A National Analysis of Physical Activity, Obesity and Chronic Disease. Washington, DC: Smart Growth America; 2003. 70. Lovasi GS, Neckerman KM, Quinn JW, et al. Effect of individual or neighborhood disadvantage on the association between neighborhood walkability and body mass index. Am J Public Health. 2009;99(2):279–284. 71. Frank LD, Andresen MA, Schmid TL. Obesity relationships with community design, physical activity, and time spent in cars. Am J Prev Med. 2004;27(2):87–96. 72. Kerr J, Frank L, Sallis JF, et al. Urban form correlates of pedestrian travel in youth: differences by gender, raceethnicity and household attributes. Transp Res D. 2007;12(3): 177–182. 73. Kerr J, Rosenberg D, Sallis JF, et al. Active commuting to school: associations with environment and parental concerns. Med Sci Sports Exerc. 2006;38(4):787–794. 74. Rutt CD, Coleman KJ. Examining the relationships among built environment, physical activity, and body mass index in El Paso, TX. Prev Med. 2005;40(6):831–841. 75. Frank LD, Kerr J, Sallis JF, et al. A hierarchy of sociodemographic and environmental correlates of walking and obesity. Prev Med. 2008;47(2):172–178. 76. Joshu CE, Boehmer TK, Brownson RC, et al. Personal, neighbourhood and urban factors associated with obesity in the United States. J Epidemiol Community Health. 2008; 62(3):202–208. 77. McDonald NC. Critical factors for active transportation to school among low-income and minority students. Evidence from the 2001 National Household Travel Survey. Am J Prev Med. 2008;34(4):341–344. 78. Oakes JM, Forsyth A, Schmitz KH. The effects of neighborhood density and street connectivity on walking behavior: the Twin Cities Walking Study [electronic article]. Epidemiol Perspect Innov. 2007;4:16. 79. Brownson RC, Baker EA, Housemann RA, et al. Environmental and policy determinants of physical activity in the United States. Am J Public Health. 2001;91(12): 1995–2003. 80. Eyler AA, Brownson RC, Bacak SJ, et al. The epidemiology of walking for physical activity in the United States. Med Sci Sports Exerc. 2003;35(9):1529–1536. 81. Sallis JF, Hovell MF, Hofstetter CR, et al. Distance between homes and exercise facilities related to frequency of exercise among San Diego residents. Public Health Rep. 1990;105(2): 179–185. 82. Eyler AA, Matson-Koffman D, Young DR, et al. Quantitative study of correlates of physical activity in women from diverse racial/ethnic groups: the Women’s Cardiovascular Health Network Project—summary and conclusions. Am J Prev Med. 2003;25(3 suppl 1):93–103. 83. Morabia A, Costanza MC. Does walking 15 minutes per day keep the obesity epidemic away? Simulation of the efficacy of a populationwide campaign. Am J Public Health. 2004; 94(3):437–440. 84. Department of Health and Human Services. Physical Activity and Health. A Report of the Surgeon General. Washington, DC: National Center for Chronic Disease Prevention and Health Promotion; 1996. 85. Gable S, Chang Y, Krull JL. Television watching and frequency of family meals are predictive of overweight onset
Built Environment, Disadvantage, and Obesity
86.
87.
88.
89. 90. 91. 92.
93.
94.
95. 96. 97.
98. 99. 100.
101. 102. 103.
and persistence in a national sample of school-aged children. J Am Diet Assoc. 2007;107(1):53–61. Boehmer TK, Hoehner CM, Deshpande AD, et al. Perceived and observed neighborhood indicators of obesity among urban adults. Int J Obes (Lond). 2007;31(6): 968–977. King AC, Castro C, Wilcox S, et al. Personal and environmental factors associated with physical inactivity among different racial-ethnic groups of U.S. middle-aged and olderaged women. Health Psychol. 2000;19(4):354–364. Evenson KR, Birnbaum AS, Bedimo-Rung AL, et al. Girls’ perception of physical environmental factors and transportation: reliability and association with physical activity and active transport to school [electronic article]. Int J Behav Nutr Phys Act. 2006;3:28. Wilson DK, Kirtland KA, Ainsworth BE, et al. Socioeconomic status and perceptions of access and safety for physical activity. Ann Behav Med. 2004;28(1):20–28. Boehmer TK, Lovegreen SL, Haire-Joshu D, et al. What constitutes an obesogenic environment in rural communities? Am J Health Promot. 2006;20(6):411–421. Sharpe PA, Granner ML, Hutto BE, et al. Correlates of physical activity among African American and white women. Am J Health Behav. 2008;32(6):701–713. Huston SL, Evenson KR, Bors P, et al. Neighborhood environment, access to places for activity, and leisure-time physical activity in a diverse North Carolina population. Am J Health Promot. 2003;18(1):58–69. Wilcox S, Bopp M, Oberrecht L, et al. Psychosocial and perceived environmental correlates of physical activity in rural and older African American and white women. J Gerontol B Psychol Sci Soc Sci. 2003;58(6):P329–P337. Estabrooks PA, Lee RE, Gyurcsik NC. Resources for physical activity participation: does availability and accessibility differ by neighborhood socioeconomic status? Ann Behav Med. 2003;25(2):100–104. Felton GM, Dowda M, Ward DS, et al. Differences in physical activity between black and white girls living in rural and urban areas. J Sch Health. 2002;72(6):250–255. Moore LV, Diez Roux AV, Evenson KR, et al. Availability of recreational resources in minority and low socioeconomic status areas. Am J Prev Med. 2008;34(1):16–22. Molnar BE, Gortmaker SL, Bull FC, et al. Unsafe to play? Neighborhood disorder and lack of safety predict reduced physical activity among urban children and adolescents. Am J Health Promot. 2004;18(5):378–386. Cohen DA, Farley TA, Mason K. Why is poverty unhealthy? Social and physical mediators. Soc Sci Med. 2003;57(9): 1631–1641. Mitchell R, Popham F. Effect of exposure to natural environment on health inequalities: an observational population study. Lancet. 2008;372(9650):1655–1660. Sanderson B, Littleton M, Pulley L. Environmental, policy, and cultural factors related to physical activity among rural, African American women. Women Health. 2002;36(2): 75–90. Weir LA, Etelson D, Brand DA. Parents’ perceptions of neighborhood safety and children’s physical activity. Prev Med. 2006;43(3):212–217. Wilbur J, Chandler P, Dancy B, et al. Environmental, policy, and cultural factors related to physical activity in urban, African American women. Women Health. 2002;36(2):17–28. Balfour JL, Kaplan GA. Neighborhood environment and loss of physical function in older adults: evidence from the Alameda County Study. Am J Epidemiol. 2002;155(6):507–515.
13
104. Zhu X, Lee C. Walkability and safety around elementary schools: economic and ethnic disparities. Am J Prev Med. 2008;34(4):282–290. 105. Burdette HL, Whitaker RC. A national study of neighborhood safety, outdoor play, television viewing, and obesity in preschool children. Pediatrics. 2005;116(3):657–662. 106. Lumeng JC, Appugliese D, Cabral HJ, et al. Neighborhood safety and overweight status in children. Arch Pediatr Adolesc Med. 2006;160(1):25–31. 107. Taylor WC, Sallis JF, Lees E, et al. Changing social and built environments to promote physical activity: recommendations from low income, urban women. J Phys Act Health. 2007;4(1):54–65. 108. Alfonzo MA. To walk or not to walk? The hierarchy of walking needs. Environ Behav. 2005;37(6):808–836. 109. Brownson RC, Housemann RA, Brown DR, et al. Promoting physical activity in rural communities: walking trail access, use, and effects. Am J Prev Med. 2000;18(3):235–241. 110. Marmot M. The Status Syndrome. New York, NY: Owl Books; 2004. 111. Larson NI, Story MT, Nelson MC. Neighborhood environments: disparities in access to healthy foods in the U.S. Am J Prev Med. 2009;36(1):74–81. 112. Lee RE, Cubbin C. Striding toward social justice: the ecologic milieu of physical activity. Exerc Sport Sci Rev. 2009;37(1):10–17. 113. Kahn EB, Ramsey LT, Brownson RC, et al. The effectiveness of interventions to increase physical activity. A systematic review. Am J Prev Med. 2002;22(4 suppl):73–107. 114. Grier SA, Kumanyika SK. The context for choice: health implications of targeted food and beverage marketing to African Americans. Am J Public Health. 2008;98(9):1616–1629. 115. Bullard RD, Johnson GS. Just Transportation. Stony Creek, CT: New Society Publishers; 1997. 116. Treiber F, Harshfield G, Davis H, et al. Stress responsivity and body fatness: links between socioeconomic status and cardiovascular risk factors in youth. Ann N Y Acad Sci. 1999;896(Socioeconomic Status and Health in Industrial Nations: Social, Psychological, and Biological Pathways): 435–438. 117. Cohen DA, Inagami S, Finch B. The built environment and collective efficacy. Health Place. 2008;14(2):198–208. 118. Kuller L. Is phenomenology the best approach to health research? Am J Epidemiol. 2007;166(10):1109–1115. 119. Wing S. Whose epidemiology, whose health? Int J Health Serv. 1998;28(2):241–252. 120. Freeman L. Making sense of gentrification. In: There Goes the ‘Hood’. Philadelphia, PA: Temple University Press; 2006:95–124. 121. Childress JF, Faden RR, Gaare RD, et al. Public health ethics: mapping the terrain. J Law Med Ethics. 2002;30(2):170–178. 122. Jacobs M, Stevenson G. Health and housing: a historical examination of alternative perspectives. Int J Health Serv. 1981;11(1):105–122. 123. Shavers VL, Shankar S. Trend in the prevalence of overweight and obesity among urban African American hospital employees and public housing residents. J Natl Med Assoc. 2002;94(7):566–576. 124. Lee TC, Hanlon JG, Ben-David J, et al. Risk factors for cardiovascular disease in homeless adults. Circulation. 2005; 111(20):2629–2635. 125. Ogilvie D, Egan M, Hamilton V, et al. Promoting walking and cycling as an alternative to using cars: systematic review [electronic article]. BMJ. 2004;329(7469):763.
14
Lovasi et al.
126. Plantinga AJ, Bernell S. The association between urban sprawl and obesity: is it a two-way street? J Reg Sci. 2007;47(5):857–879. 127. Wilbur J, Chandler PJ, Dancy B, et al. Correlates of physical activity in urban Midwestern African-American women. Am J Prev Med. 2003;25(3 suppl 1):45–52. 128. Wilbur J, Chandler PJ, Dancy B, et al. Correlates of physical activity in urban Midwestern Latinas. Am J Prev Med. 2003; 25(3 suppl 1):69–76. 129. Evenson KR, Sarmiento OL, Tawney KW, et al. Personal, social, and environmental correlates of physical activity in North Carolina Latina immigrants. Am J Prev Med. 2003; 25(3 suppl 1):77–85. 130. Young DR, Voorhees CC. Personal, social, and environmental correlates of physical activity in urban AfricanAmerican women. Am J Prev Med. 2003;25(3 suppl 1): 38–44. 131. Ainsworth BE, Wilcox S, Thompson WW, et al. Personal, social, and physical environmental correlates of physical activity in African-American women in South Carolina. Am J Prev Med. 2003;25(3 suppl 1):23–29. 132. Voorhees CC, Young DR. Personal, social, and physical environmental correlates of physical activity levels in urban Latinas. Am J Prev Med. 2003;25(3 suppl 1):61–68. 133. Wang MC, Cubbin C, Ahn D, et al. Changes in neighbourhood food store environment, food behaviour and body mass index, 1981–1990. Public Health Nutr. 2008;11(9):963–970.
134. Moore LV, Diez Roux AV, Nettleton JA, et al. Associations of the local food environment with diet quality—a comparison of assessments based on surveys and geographic information systems: the Multi-Ethnic Study of Atherosclerosis. Am J Epidemiol. 2008;167(8):917–924. 135. Rundle A, Field S, Park Y, et al. Personal and neighborhood socioeconomic status and indices of neighborhood walkability predict body mass index in New York City. Soc Sci Med. 2008;67(12):1951–1958. 136. Galvez MP, Morland K, Raines C, et al. Race and food store availability in an inner-city neighbourhood. Public Health Nutr. 2008;11(6):624–631. 137. Sharkey JR, Horel S. Neighborhood socioeconomic deprivation and minority composition are associated with better potential spatial access to the ground-truthed food environment in a large rural area. J Nutr. 2008;138(3):620–627. 138. Rutt CD, Coleman KJ. The impact of the built environment on walking as a leisure-time activity along the U.S./Mexico border. J Phys Act Health. 2005;2(3):257–271. 139. Kelly CM, Schootman M, Baker EA, et al. The association of sidewalk walkability and physical disorder with area-level race and poverty. J Epidemiol Community Health. 2007; 61(11):978–983. 140. Bell JF, Wilson JS, Liu GC. Neighborhood greenness and 2-year changes in body mass index of children and youth. Am J Prev Med. 2008;35(6):547–553.