Jul 3, 2017 - tion of the Mo 2p orbital were obtained from the atomic calculation program by Cowan [25]. The V part of the Hamiltonian describes the corre-.
Home
Search
Collections
Journals
About
Contact us
My IOPscience
Bulk-sensitive Mo 4d electronic structure of Sr2FeMoO6 probed by high-energy Mo L3 resonant photoemission
This content has been downloaded from IOPscience. Please scroll down to see the full text. 2017 EPL 118 37002 (http://iopscience.iop.org/0295-5075/118/3/37002) View the table of contents for this issue, or go to the journal homepage for more Download details: IP Address: 200.238.166.160 This content was downloaded on 03/07/2017 at 18:10 Please note that terms and conditions apply.
May 2017 EPL, 118 (2017) 37002 doi: 10.1209/0295-5075/118/37002
www.epljournal.org
Bulk-sensitive Mo 4d electronic structure of Sr2FeMoO6 probed by high-energy Mo L3 resonant photoemission H. P. Martins1 , F. Prado2 , A. Caneiro3 , F. C. Vicentin4 , R. J. O. Mossanek1 and M. Abbate1 1
Departamento de F´ısica, Universidade Federal do Paran´ a - Caixa Postal 19044, 81531-980 Curitiba-PR, Brazil Departamento de F´ısica, Universidad Nacional del Sur - Av. Leandro N. Alem 1253, 8000 Bah´ıa Blanca, Argentina 3 Centro At´ omico Bariloche, Comisi´ on Nacional de Energ´ıa At´ omica - Av. Ezequiel Bustillo 9500, 8400 Bariloche, Argentina 4 Laborat´ orio Nacional de Luz S´ıncrotron, CNPEM - Caixa Postal 6192, 13083-970 Campinas-SP, Brazil 2
received 27 January 2017; accepted in final form 12 June 2017 published online 3 July 2017 PACS PACS PACS
79.60.Bm – Photoemission and photoelectron spectra: Clean metal, semiconductor, and insulator surfaces 71.20.Ps – Electron density of states and band structure of crystalline solids: Other inorganic compounds 71.70.-d – Level splitting and interactions
Abstract – We studied the Mo 4d electronic structure of Sr2 FeMoO6 using high-energy Mo L3 resonant photoemission. The experimental spectra are in good agreement with modified BeckeJohnson (mBJ) band structure calculations. The energy dependence of the spectra can be explained by the changes in the photoemission cross-sections. The Mo L3 resonant spectrum shows Mo 4d character below the Fermi level and mixed Mo 4d-O 2p character around 8.0 eV. The Mo 4d weight in the resonant spectrum is in good agreement with the calculated interference between the direct and decay terms. The high photon energy used in this study (about 2520 eV) provides a bulk-sensitive determination of the Mo 4d electronic structure. c EPLA, 2017 Copyright �
Introduction. – The 4d transition metal compounds and alloys present a broad range of interesting physical properties. For instance, ferroelectricity in KNbO3 , magnetoresistance in Sr2 FeMoO6 , 1D character in K0.3 MoO3 , ferromagnetism in SrRuO3 , giant moments in Fe-Pd alloys, etc. These materials are used in high-k capacitors, optical devices, magnetic sensors, electrical contacts, etc. In addition, Rh and Pd alloys and compounds are very important in many catalytic processes. The physical properties of these compounds are directly related to the corresponding electronic structure. For this reason, there is a need to develop better techniques to study the transition metal 4d states. Photoemission is a very powerful method to study the electronic structure of transition metal compounds. In particular, the Cooper minimum [1] in the 4d photoemission cross-section was used to investigate some of these compounds [2–7]. In this method, a reference spectrum is contrasted with one taken at the Cooper minimum (80–120 eV), so the differences in the spectra can be qualitatively attributed to features with 4d character. However, this relatively simple and widely used technique
has two drawbacks: first, the energy difference between the reference and the Cooper minimum spectrum is relatively large, so the photoemission cross-section of the other electronic levels involved also changes considerably [8]. Secondly, the results are surface sensitive because the photoelectron escape depth at the Cooper minimum is about 5˚ A [9]. In this work, we study the electronic structure of Sr2 FeMoO6 using high-energy Mo L3 resonant photoemission (RPES). The difference between the on- (2527 eV) and off -resonance (2515 eV) spectra is directly related to the Mo 4d contribution. The other electronic levels do not change much because the energy difference is relatively small, and the results are more bulk-sensitive because the photoelectron escape depth at these energies, about 35 ˚ A [9], is much larger. For these reasons, the present method is a particularly powerful technique to obtain the Mo 4d contribution. We show below that the experimental Mo 4d bands are in good agreement with band structure calculations. The RPES spectra show a minority Mo 4d band at the Fermi level, and mixed Mo 4d-O 2p states at higher energies. These results are important
37002-p1
H. P. Martins et al. to understand the magnetic ordering and the electronic transport in this material. The Sr2 FeMoO6 compound is an ordered double perovskite with a tetragonal structure. This material is a half-metallic ferromagnet with a relatively high TC of about 420 K [10]. Single crystals of this material present a relatively small magnetoresistance, whereas polycrystalline samples exhibit a much larger (30%) magnetoresistance [11]. In view of this, the observed magnetoresistance is usually attributed to tunneling effects across grain boundaries [11,12]. The magnetism here is due to an antiferromagnetic alignment of the localized Fe 3d and the itinerant Mo 4d moments [13]. The magnetic moment of the samples, about 3.2 μB , is very sensitive to the concentration of Fe-Mo anti-sites [14]. The electronic structure of this compound was investigated by photoemission as well as theoretical calculations [15–18]. Experimental details. – The Sr2 FeMoO6 sample was synthesized using the conventional solid-state reaction method. The proper amount of the reagents were repeatedly mixed and calcined in air at 950 ◦ C for 24 h. The resulting powder was reduced in a flowing mixture of 1% H2 -Ar gas at 1050 ◦ C for 1 h. The material was ground, pressed into pellets, and sintered in a vacuum of 2 × 10⁻⁸ bar at 1200 ◦ C for 12 h. The powder XRD analysis confirmed the presence of a single-phase material. The Rietveld refinement indicated a tetragonal I4/mmm structure with a = 5.5761 ˚ A and c = 7.9078 ˚ A. The relative intensity of the (101) reflection showed that the concentration of anti-sites was less than 3% [14]. The photoemission experiment was performed at the Laborat´ orio Nacional de Luz S´ıncrotron (LNLS). The beamline is equipped with a focusing mirror, a double-crystal monochromator and an UHV experimental chamber [19]. The energy scale of the monochromator was calibrated using the Si K and the Mo L3 absorption edges. The photoemission spectra were acquired using a SPECS Phoibos 150 electron energy analyzer. The energy scale of the analyzer was calibrated using the Fermi level of a clean gold foil. The resonant photoemission spectra were taken around 2520 eV with an energy resolution of about 0.4 eV. The samples were repeatedly scraped with a diamond file to remove the surface contamination.
Table 1: Atomic positions and muffin-tin radii used in the band structure calculations of Sr2 FeMoO6 .
Atom Sr Fe Mo O1 O2
Atomic positions x y z 0.500 0.000 0.250 0.000 0.000 0.000 0.000 0.000 0.500 0.000 0.000 0.254 0.249 0.249 0.000
energy convergence criterion for the self-consistent calculation was set to 10−5 eV. Resonant photoemission. The resonant photoemission spectrum was analyzed using the following Hamiltonian: H = H0 + V.
(1)
The H0 part of the Hamiltonian describes the active electron energy levels: � � � H0 = E2p c†i ci + E4d d†i di + E�f e†i ei , (2) i
i
i
where the first term corresponds to the core Mo 2p electrons with energy E2p , the second term describes the valence Mo 4d electrons with energy E4d , and the third term relates to the continuum �f electrons with energy E�f . The Mott-Hubbard repulsion between the Mo 4d electrons was not considered because Sr2 FeMoO6 is a 4d1 compound [23,24]. The Fe 3d and O 2p electrons were not considered because the resonant photoemission involves a Mo 2p core level and it is, thus, a local process. Further, the spectral weight of the Mo 4d electrons was obtained from the band structure calculations, which already include the interactions of the Mo 4d states with the O 2p and Fe 3d electrons. Finally, the energy and wave function of the Mo 2p orbital were obtained from the atomic calculation program by Cowan [25]. The V part of the Hamiltonian describes the corresponding transitions: � � Vph e†i dj + Vab d†i cj V = i,j
Calculation details. – Band structure calculation. The band structure of Sr2 FeMoO6 was calculated using the WIEN2k program [20]. The calculation was performed using the modified Becke-Johnson (mBJ) exchange potential [21]. This method is very efficient and produces good results for transition metal oxides [22]. Both the space group and the lattice parameters were extracted from the XRD measurements. The atomic positions and muffin-tin radii are given in table 1. The grid of k-points was set to 11 × 11 × 11, and the plane-wave basis cutoff was set to RKmax = 7.0. The total
RMT (a.u.) 2.50 1.98 1.92 1.71 1.71
+
�
i,j
VAug c†i e†j dk dl
+ h.c.,
(3)
i,j,k,l
where the first term corresponds to the 4d-�f photoemission process, the second term describes the 2p-4d absorption transition, and the third term relates to the L3 N4,5 N4,5 Auger decay. The Vph parameter is given in terms of the ��f ||r||4d� matrix element, the Vab parameter is written in terms of the �4d||r||2p� matrix element, and the VAug parameter is related to the R1 (2p, �f ; 4d, 4d) and R3 (2p, �f ; 4d, 4d) integrals. Photoemission to the �p channel was neglected because the ��p||r||4d� matrix element
37002-p2
Bulk-sensitive Mo 4d electronic structure of Sr2 FeMoO6 probed by high-energy Mo L3 RPES
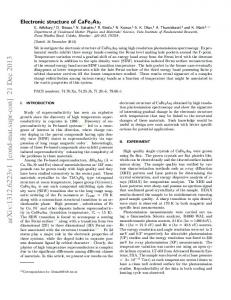
Fig. 1: High energy-photoemission spectra of Sr2 FeMoO6 obtained at 2515 and 1840 eV compared to previous low-energy photoemission spectra taken at 120 and 64.5 eV (taken from ref. [15]).
is much smaller. Likewise, Auger decay into the �p channel was also neglected because the R1 (2p, �p; 4d, 4d) and R3 (2p, �p; 4d, 4d) integrals are much smaller. The dipole matrix elements as well as the radial integrals were calculated using the code by Cowan [25]. The quadrupole contribution to the cross-section can be neglected, because the calculation shows that it is 15 times smaller than the dipole part. We note that this approach does not describe all the many-body effects of the resonant photoemission process. However, the advantage is that all the ingredients of the model are obtained using ab initio calculations. Results and discussion. –
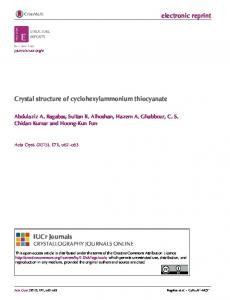
Fig. 2: (Colour online) Calculated photoemission spectra of Sr2 FeMoO6 as a function of the photon energy. The spectra are composed by the Fe 3d, Mo 4d and O 2p contributions. These were weighted according to the corresponding photoemission cross-sections.
dramatic effect is the decrease of the non-bonding O 2p intensity at higher energies. There are also lesser changes in the relative intensity of the other structures in the spectra. A similar photon energy dependence was already reported in the spectra of the VO2 [26] and LaVO3 [27] oxides. We show below that these changes can be explained by the energy dependence of the photoemission cross-sections. Figure 2 shows the calculated photoemission spectra of Sr2 FeMoO6 as a function of the photon energy. The calculated spectra are the sum of the individual Fe 3d, Mo 4d and O 2p contributions (the Sr 4d contribution to the valence band is much smaller and can be neglected). These components were weighted according to their corresponding photoemission cross-sections. The photon energy of the cross-sections were obtained by interpolation of the values reported in the literature [8]. First, we note that the calculated spectra are in reasonably good agreement with the experimental results. Second, the band structure calculations support the assignments of the spectra made above. Finally, the changes in the calculated spectra with the photon energy resemble those observed in the experiment.
Photoemission spectra. The high-energy photoemission spectra of the Sr2 FeMoO6 compound taken at 2515 and 1840 eV are presented in fig. 1. These are compared to previous low-energy photoemission spectra measured at 120 and 64.5 eV (taken from ref. [15]). The structure around 8 eV is mainly attributed to Fe 3d-O 2p and Mo 4dO 2p bonding states. The feature about 6 eV is mostly assigned to Fe 3d-O 2p and O 2p non-bonding states. Finally, the intensity close to the Fermi level, from 2 to 0 eV, corresponds to Fe 3d and Mo 4d bands. The relative intensity of the features in the specResonant photoemission. Figure 3 shows the photra changes strongly with the photon energy. The most toemission spectra of Sr2 FeMoO6 taken at 2515 eV 37002-p3
H. P. Martins et al.
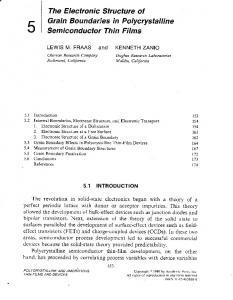
Fig. 3: (Colour online) L3 resonant photoemission spectra of the Sr2 FeMoO6 compound. The off -resonance spectrum was taken at 2515 eV, whereas the on-resonance spectrum was obtained at 2527 eV. The inset shows the Mo L3 x-ray absorption spectrum indicating the photon energies used in the above spectra. The lower part presents the difference between the on and off photoemission spectra.
(off -resonance) and 2527 eV (on-resonance). The inset shows the Mo L3 x-ray absorption spectrum indicating the photon energies used in the spectra. The off-resonance photoemission spectrum is only due to the direct photoemission process (2p6 4d1 + hν → 2p6 4d0 + e). In the on-resonance spectrum, the indirect decay channel (2p6 4d1 + hν → 2p5 4d2 → 2p6 4d0 + e) also contributes. The constructive interference between these two processes enhances the intensity of the Mo 4d states [28–30]. The lower part of fig. 3 presents the difference between the on and off photoemission spectra. This difference is directly related to the Mo 4d contribution to the valence band. The enhancement in the difference spectrum below the Fermi level, around 0.5 eV, is attributed to the Mo 4d band. The increased intensity around 8.0 eV is assigned Mo 4d states mixed with O 2p character. This increase is relatively large indicating that the covalent Mo 4d-O 2p mixing is strong. The intensity I(ν) of the resonant photoemission spectrum is given by [30] �2 � � � �f |VAug |m��m|Vab |i� �� � (4) I(ν) = ��f |Vph |i� + � , � hν − E2p + iΓm � m where i denotes the initial 2p6 4d1 state, f stands for the final 2p6 4d0 state, m denotes an intermediate 2p5 4d2 state, 2 the lifetime broadening is Γm = π |�f |VAug |m�| , and the sum runs over all the possible intermediate states. The first term in the equation corresponds to the direct process, whereas the second term describes the intermediate decay channel. We note that the Vph and Vab terms were treated in the first order, whereas the VAug decay was evaluated to all orders [30].
Fig. 4: (Colour online) Calculated L3 resonant photoemission spectra of the Sr2 FeMoO6 compound. These include the off and on-resonance spectra, as well as the difference spectrum. Table 2: Parameters used in the calculation of the resonant photoemission spectra.
��f ||r||4d� �4d||r||2p� 1 R (2p, �f ; 4d, 4d) R3 (2p, �f ; 4d, 4d)
−0.0309 a.u./eV1/2 −0.0397 a.u. 0.0312 eV1/2 0.0195 eV1/2
The values of the parameters used in the calculation of the intensity of the resonant photoemission spectrum are given in table 2. The calculated off - and on-resonance spectra, as well as the difference spectrum of Sr2 FeMoO6 , are presented in fig. 4. The off -resonance spectrum corresponds to the sum of the Fe 3d, Mo 4d and O 2p components, weighted according to their relative photoemission cross-sections. In the on-resonance spectrum, the Fe 3d and O 2p character remains the same, whereas the Mo 4d contribution is normalized according to eq. (4). We note that the calculation is in relatively good agreement with the experimental results. It describes the main features in the spectra as well as the changes observed between the off - and onresonance. Comparison with previous work. The Mo 4d states in the Sr2 FeMoO6 compound were also studied using the Cooper minimum method [15–18]. The photon energy difference in this method is rather large, about 40–50%, whereas in the present work it is relatively small, around 0.5%. Thus, the variation of the photoemission crosssection of the other electronic levels can be safely neglected [8]. Furthermore, the electron escape depth at the Cooper minimum is very small, about 5 ˚ A, whereas at the A [9]. Therefore, Mo L3 edge is much larger, around 35 ˚ the present results are more bulk-sensitive than those obtained using the Cooper minimum method. The Mo 4d
37002-p4
Bulk-sensitive Mo 4d electronic structure of Sr2 FeMoO6 probed by high-energy Mo L3 RPES electronic structure in Sr2 FeMoO6 was also studied using Mo M x-ray emission spectroscopy, but these results present only a broad structure about 6.0 eV and do not reveal the states at the Fermi level [31]. The present results reveal the contribution of the Mo 4d states to the bulk electronic structure of the Sr2 FeMoO6 double perovskite. They indicate the presence of Mo 4d states at the Fermi level and mixed Mo 4d-O 2p states around 8.0 eV. These findings are crucial to understand the indirect Mo 4d-O 2p-Fe 3d hopping, which is directly related to the electronic transport mechanism in this compound [10]. Further, the relatively large Mo 4d-O 2p hybridization is also necessary to explain the antiferromagnetic coupling between the Fe 3d and Mo 4d spins [13]. The electronic structure of the NiO and Fe2 O3 compounds were studied using hard x-ray resonant photoemission [32]. This study was performed at the Ni K and Fe K x-ray absorption edges and probed the secondary Ni 3d and Fe 4p states [32]. The electronic structure of CeRh3 was also studied using hard x-ray resonant photoelectron spectra [33]. In this case, the spectra were taken at the Ce L3 x-ray absorption edge and probed the Ce 3d core levels [33]. The present study was carried out at the Mo L3 edge and probed directly the active Mo 4d states in the valence band. Summary and conclusions. – In summary, We studied the Mo 4d electronic structure of Sr2 FeMoO6 using high-energy Mo L3 resonant photoemission. The Mo 4d character obtained from the spectra is in good agreement with band structure calculations. The resonant spectrum shows Mo 4d character at the Fermi level and mixed Mo 4d-O 2p character around 8.0 eV. The present findings are important to understand the electrical and magnetic properties of the Sr2 FeMoO6 compound. To conclude, the high-energy resonant photoemission technique is very powerful and provides bulk-sensitive results for Sr2 FeMoO6 . The experimental results can be reproduced using a combination of band structure and model calculations. This approach could be extended to study the electronic structure of many other interesting 4d alloys and compounds. ∗∗∗ We would like to thank the staff of LNLS for their technical assistance. This work was partially supported by the Brazilian Funding Agencies CNPq and CAPES. REFERENCES [1] Fano U. and Cooper J. W., Rev. Mod. Phys., 40 (1968) 441. [2] Abbati I., Braicovich L., Rossi G., Lindau I., del Pennino U. and Nannarone S., Phys. Rev. Lett., 50 (1983) 1799. [3] Rossi G., Lindau I., Braicovich L. and Abbati I., Phys. Rev. B, 28 (1983) 3031.
[4] Neumann T., Borstel G., Scharfschwerdt C. and Neumann M., Phys. Rev. B, 46 (1992) 10623. [5] Kang J.-S., Han H., Lee B. W., Olson C. G., Han S. W., Kim K. H., Jeong J. I., Park J. H. and Min B. I., Phys. Rev. B, 64 (2001) 024429. [6] Park J., Oh S.-J., Park J.-H., Kim D. M. and Eom C.-B., Phys. Rev. B, 69 (2004) 085108. [7] van Acker J. F., Weijs P. J. W., Fuggle J. C., Horn K., Haak H. and Buschow K. H. J., Phys. Rev. B, 43 (1991) 8903. [8] Yeh J. J. and Lindau I., At. Data Nucl. Data Tables, 32 (1985) 1. [9] Tanuma S., Powell C. J. and Penn D. R., Surf. Interface Anal., 43 (2011) 689. [10] Kobayashi K.-I., Kimura T., Sawada H., Terakura K. and Tokura Y., Nature, 395 (1998) 677. [11] Tomioka Y., Okuda T., Okimoto Y., Kumai R., Kobayashi K.-I. and Tokura Y., Phys. Rev. B, 61 (2000) 422. [12] Maignan A., Raveau B., Martin C. and Hervieu M., J. Solid State Chem., 144 (1999) 224. [13] Ray S., Kumar A., Sarma D. D., Cimino R., Turchini S., Zennaro S. and Zema N., Phys. Rev. Lett., 87 (2001) 097204. [14] Balcells L., Navarro J., Bibes M., Roig A., Mart´ınez B. and Fontcuberta J., Appl. Phys. Lett., 78 (2001) 781. [15] Saitoh T., Nakatake M., Kakizaki A., Nakajima H., Morimoto O., Xu S., Moritomo Y., Hamada N. and Aiura Y., Phys. Rev. B, 66 (2002) 035112. [16] Kang J.-S., Kim J. H., Sekiyama A., Kasai S., Suga S., Han S. W., Kim K. H., Muro T., Saitoh Y., Hwang C., Olson C. G., Park B. J., Lee B. W., Shim J. H., Park J. H. and Min B. I., Phys. Rev. B, 66 (2002) 113105. [17] Ray S., Mahadevan P., Kumar A., Sarma D. D., Cimino R., Pedio M., Ferrari L. and Pesci A., Phys. Rev. B, 67 (2003) 085109. [18] Navarro J., Fontcuberta J., Izquierdo M., Avila J. and Asensio M. C., Phys. Rev. B, 69 (2004) 115101. [19] Abbate M., Vicentin F. C., Compagnon-Cailhol V., Rocha M. C. and Tolentino H., J. Synchrotron Radiat., 6 (1999) 964. [20] Blaha P., Schwarz K., Madsen G., Kvasnicka D. and Luitz J., WIEN2k, An Augmented Plane Wave + Local Orbitals Program for Calculating Crystal Properties, WIEN2k 16.1 edition (Karlheinz Schwarz, Technische Universit¨ at Wien, Austria) 2001. [21] Tran F. and Blaha P., Phys. Rev. Lett., 102 (2009) 226401. [22] Koller D., Tran F. and Blaha P., Phys. Rev. B, 83 (2011) 195134. [23] Moreno M. S., Gayone J. E., Abbate M., Caneiro ´nchez R. D., de Siervo A., A., Niebieskikwiat D., Sa Landers R. and Zampieri G., Solid State Commun., 120 (2001) 161. [24] Martins H. P., Prado F., Caneiro A., Vicentin F. C., Chaves D. S., Mossanek R. J. O. and Abbate M., J. Alloys Compd., 640 (2015) 511. [25] Cowan R. D., The Theory of Atomic Structure and Spectra (University of California Press) 1981.
37002-p5
H. P. Martins et al.
[26] Eguchi R., Taguchi M., Matsunami M., Horiba K., Yamamoto K., Chainani A., Takata Y., Yabashi M., Miwa D., Nishino Y., Tamasaku K., Ishikawa T., Senba Y., Ohashi H., Inoue I. H., Muraoka Y., Hiroi Z. and Shin S., J. Electron Spectrosc. Relat. Phenom., 156-158 (2007) 421. [27] Mossanek R. J. O., Abbate M., Yoshida T., Fujimori A., Yoshida Y., Shirakawa N., Eisaki H., Kohno S. and Vicentin F. C., Phys. Rev. B, 78 (2008) 075103. ´ J., Lecante J., Jain [28] Guillot C., Ballu Y., Paigne K. P., Thiry P., Pinchaux R., Petroff Y. and Falicov L. M., Phys. Rev. Lett., 39 (1977) 1632. [29] Davis L. C. and Feldkamp L. A., Phys. Rev. B, 23 (1981) 6239.
[30] Ghijsen J., Tjeng L. H., Eskes H., Sawatzky G. A. and Johnson R. L., Phys. Rev. B, 42 (1990) 2268. [31] Kuepper K., Kadiroglu M., Postnikov A. V., Prince K. C., Matteucci M., Galakhov V. R., Hesse H., Borstel G. and Neumann M., J. Phys.: Condens. Matter, 17 (2005) 4309. `vre P., Magnan H., Chandesris D., Jupille J., [32] Le Fe Bourgeois S., Barbier A., Drube W., Uozumi T. and Kotani A., Nucl. Instrum. Methods Phys. Res. A, 547 (2005) 176. `vre P., Chandesris [33] Kotani A., Parlebas J. C., Le Fe D., Magnan H., Asakura K., Harada I. and Ogasawara H., Nucl. Instrum. Methods Phys. Res. A, 547 (2005) 124.
37002-p6