Paper to be presented at 21st European Regional ITS Conference, Copenhagen, 13-15 September 2010
Business models for deployment and operation of femtocell networks; - Are new cooperation strategies needed for mobile operators?
Jan Markendahl Wireless@KTH Royal Institute of Technology Electrum 422 S-164 40 Kista Sweden
[email protected] phone: + 46 70 663 01 63 Mats Nilson Wireless@KTH Royal Institute of Technology Electrum 422 S-164 40 Kista Sweden
[email protected] Phone: + 46 735 105 125
Abstract In this paper we discuss different business models for deployment and operation of femtocell networks intended for provisioning of public mobile broad band access services. In these types of business cases the operators use femtocells in order to reduce investments in “more costly” macro networks since the traffic can be “offloaded” to “less costly” femtocell networks. This is in contrast to the many business cases presented in Femtoforum where femtocells mainly are discussed as a solution to improve indoor coverage for voice services in homes and small offices, usually for closed user groups The main question discussed in this paper is if “operators need to consider new forms of cooperation strategies in order to enable large scale deployment of femtocells for public access?” By looking into existing solutions for indoor wireless access services we claim that the answer is both “Yes” and “No”. No, since many types of cooperation are already in place for indoor deployment. Yes, because mobile operators need to re-think the femtocell specific business models, from approaches based on singe operator networks to different forms of cooperation involving multi-operator solutions, e.g. roaming and network sharing.
1. Introduction 1.1. Femtocell background Femtocell base stations (FBS) are proposed in order to improve indoor coverage and capacity. The FBS is a small cellular base stations connected through broadband1. Different types of access control schemes have been presented: open access, closed access (for specific users or user groups), and hybrid access. In this paper we will address business aspects for deployment where the type of business model depends on the type of market. Business cases and white papers in Femtoforum have a large focus on the consumer segment, families and voice services in homes. FBS is seen as a product that together with price plans is expected to increase customer loyalty and decrease churn. For the business segment another opportunity is to use femtocells for “offloading” of data traffic from the macro layer in cellular networks. This aspect of femtocells has been increasingly important with the rapid growth of mobile broadband (MBB) services. The increasing use of MBB in combination with flat fee subscriptions has resulted in a decoupling of traffic from operator revenues. The offloading of data traffic from the macrocell layer to femtocells offers a large potential to reduce the need for investments in “more costly” macrocell networks. For all business segments the main added value of femtocells is the improved indoor coverage. However, in regions where the coverage from outdoor to indoor generally is good, bad indoor coverage can result in a switch to another operator that offers better coverage. In order to satisfy the customer needs operators provide specific technical solutions where the radio signals are distributed indoors, e.g. distributed antenna systems (DAS) or using Repeaters2. In this market for indoor mobile voice solutions different types of cooperation are very common. DAS are often used for multi-operator networks, i.e. cooperation between operators. Operators also cooperate with business customers and with real estate owners. For Internet access companies provide fixed or wireless company networks for private access. Public WiFi3 access is offered by hot spot operators where “any” user can access the network if you have an agreement with the hot spot operator. The overall problem area to be discussed in this paper is how femtocells can fit into this picture with i) multi-operator networks for voice, ii) private “closed” data networks and iii)“open” public networks for wireless Internet access? Proposed femtocell solutions are single-operator networks which would imply deployment of multiple femtocell networks in offices and public places. The economic feasibility and the practical aspects of deployment and operation of this “non-shared” approach can be discussed. Sharing of base station sites and spectrum is already in use for wide area 3G/UMTS systems and for indoor mobile voice (2G/GSM) so sharing approaches would be feasible also for femtocell networks. Base station sharing has further been agreed for 4G/LTE networks under implementation. 1
We have adopted the Femtoforum definition “Femtocells are low-power wireless access points that operate in licensed spectrum to connect standard mobile devices to a mobile operator’s network using residential DSL or cable broadband connections.” See also www.femtoforum.org 2 Repeaters reamplify the radio signal to extend coverage - not treated in this presentation. 3 WiFi is a common name for the IEEE802.11 wireless standards used in Laptop’s mobile phones etc.
1.2. Problem area and research questions To be clear, the paper focus is on public access for mobile broad band services and not on voice services in homes. The main problem area is related to the subtitle of the paper: Are new cooperation strategies needed for mobile network operators? A number of business model related research questions can be identified 1. Can the multi-operator business models used for indoor mobile voice also be used for femtocell networks or will single-operator business models emerge ? 2. Will actors like real estate owners enter the value chain for indoor access services? We can also identify some research questions related to spectrum allocation, system capacity and regulatory aspects 3. Are existing spectrum allocation strategies and system concepts feasible for satisfying future demand of indoor mobile broad band services? 4. Are new roaming and/or radio resource management schemes needed in order to enable multi-operator femtocell networks?
1.3. Paper outline The paper outline is as follows. Chapter 2 discusses some related work in the areas: femtocell and indoor deployment, infrastructure cost modeling & analysis, business models and actor relations and networks. Chapter 3 describes the model assumptions, data collection and the framework for the analysis. Next, an overview of indoor solutions is presented including Distributed Antenna Systems (DAS), an indoor GSM picocell concept, femtocell networks using HSPA or LTE base stations and solutions for WiFi hot spots. Then, three chapters provide different forms of analysis. Chapter 5 presents a high level analysis of demand, capacity and number of served users. Next, the configurations of the value networks for different forms of existing cooperation between actors are presented. In chapter 7 the business analysis of indoor solutions is summarized and implications for femtocell networks are discussed. A complementing discussion on backhaul is found is Chapter 8 and chapter 9 contains concluding remarks.
2. Related work and contribution Femtocell and other types of indoor deployment Most literature on indoor wireless systems is contributions on the technical design, interference analysis or radio wave propagation (Tolstrup, 2008), (Yavuz et al, 2010), (De la Roche et al, 2010). Although there are technical solutions that allow multi-operator networks this is not analyzed from a business perspective. Recent papers on femtocells discuss different access strategies and the possibility of offloading but the focus is mostly on deployment and on the technical mechanisms and benefits (Markendahl et al, 2009), (Calin et al, 2009). The business oriented white papers on femtocells mainly focus on small office and home environments and always in a single-operator context (Femtoforum , 2010). However, a good exception is an interesting Telenor paper (Rækken, 2010) where the femtocell deployment is put into a wider context discussing LTE and mobile broadband. “Femtocells will play a more important role in LTE than in 2G and 3G. Even though the initial LTE deployment strategy would be to build coverage outside-in, as the usage increases a wiser coverage strategy could be to build capacity inside-out” Analysis of local and indoor networks has been presented for WiFi hot spots and private networks (Lindner T et al, 2004), (Bar & Park, 2006), (Markendahl & Mäkitalo, 2007), (Cox, 2008), (Middleton & Potter, 2008), (Smura & Sorri, 2009). The focus in these studies is on business models for the local operator, cost and deployment aspects are not covered. These papers deal with business concepts including a multitude of actors but the focus are not on cooperation involving mobile network operators. WiFi with open access represents one form of operator cooperation where multiple service providers use the same infrastructure operator by a network provider J C (Francis et al, 2006), (Barcelo et al, 2009). Our contribution will be to analyze business models for operation of femtocell networks offering public access in a multi-operator business context, including an comparison with existing indoor systems and how femtocells can fit into existing business solutions. Infrastructure cost modeling and analysis A major area of techno-economic evaluation is the modeling and analysis of networks, demand, costs and revenues. These kinds of results have been reported from several European projects like TERA, TONIC, ECOSYS. A good overview of the background, drivers and results of these projects can be found in (Olsen (2009). These projects use a quantitative approach with modeling of technology rollout, cost structure, service classification combined with demand, pricing and revenue forecasts. Taking TONIC as an example (Loizillon et al, 2002), the project objective is to demonstrate the business case (i.e. the revenue – cost performance) for a 3G operator in a country for given user demand, deployment scenarios and economical constraints. The modeling and analysis include a multitude of scenarios and parameters, e.g. many service classes, small/large country, fast/slow rollout, large/small license fees, use of WLAN or not. The typical output includes predictions of cash flow for a number of years and of costs for network deployment and operation.
Analysis of cost structure and business cases for deployment of MBB in general is presented by Blennerud (2009, 2010) and by Mölleryd et al (2009, 2010). Early cost analysis of femtocell deployment is presented in (Claussen et al, 2007), (Markendahl et al, 2008). The conclusions about the profitability differs slightly in these papers but they have the same working assumptions; HSPA type of technology, use of 5 MHz of spectrum and the estimates of cost of radio equipment. If we compare the resulting cost to capacity ratio used in these papers with estimates from “4G” contracts late 2009 in the Nordic countries large differences can be identified. The cost for radio equipment for a three sector site supporting 20 MHz is well below 10k€. The cost-capacity ratio for macro base station radio equipment is 20 - 40 times lower than assumed in the papers from 2007 and 2008. This has a large impact on the trade-offs between femtocell and macrocell networks (Markendahl, 2010) Business model design and theories There is a multitude of definitions of business models and large number of papers on the topic. Two publications (Ballon, 2007),(Braccini, 2008) provide useful overviews of business model contributions for telecom markets and services. In (Braccini, 2008) the Business Model Ontology (BMO) (Osterwalder et al. 2005) and the e3-Value Ontology (Gordijn and Tan, 2005) are briefly described. The BMO was “introduced in order to systematize and summarize all definitions and the contributions related to Business model research available in literature”. The business model is composed by four main elements or “pillars”: Product, Customer Interface, Infrastructure Management and Financial Aspects. The e3value methodology (Gordijn, Akkermans, 2001) has been developed to model a value web consisting of actors who create, exchange, and consume things of economic value. The e3-Value Ontology aims at identifying exchanges of value objects among actors in a business case and supports profitability analysis. The e3-Value Ontology includes some base constructs (Actors, Value objects, Value interfaces, Value ports, Value Interfaces and Value exchanges) and defines linkages among them. The constructs and their linkages in the e3Value Ontology can be used to model a Value Network. In (Ballon, 2007) the so called “domain approach” introduced by Faber et al (2003) is used as starting point for a classification. The business modeling consist of four “domain” or “levels” representing; 1) the value network, 2) the functional model, 3) the financial model and 4) the value proposition (i.e. the architecture or general outline of the future product or service). A grouping of a number of business model parameters is made into control parameters (the value network and the functional model) and value parameters (the financial model and the value proposition). Service innovation, service R&D and business models is the main theme in a book where the STOF model is presented (Bouwman, 2008). The STOF model has four different domains representing the service, the technology, the organization and the financial aspects. As pointed out in the beginning of the book business models are not only for analysis but can also be used for service design. The design process using the STOF method consists of four steps: 1) a “quick scan” where a simple business model is developed including all four domains,
2) an evaluation of the simple business model using “critical success factors” (CSFs), 3) specification of “critical designs issues” (CDIs) and 4) an overall evaluation. Finally, the business model proposed by Chesbrough & Rosenbloom (2002) should be mentioned. The definition contains the following elements: value proposition, market segment, cost structure and profit potential, firm organization and value chain, competitive strategy, firm in the value network. The definition by Chesbrough and Rosenbloom lacks elements that explicitly describe the technical design and functionality. This can be added as a separate element or be included as linked to the value proposition, i.e. improvements in technical performance will be reflected in the value proposition. Actor relations and networks Actor networks and interaction between market players have been studied by business and market researchers since the 1980´s (Johansson & Mattsson, 1985), (Håkansson, 1987), (Håkansson & Snehota, 1989) Many studies report on the interaction within a network of suppliers and on relationships between suppliers and customers in the manufacturing industry (Andersson, 1994), (Gadde & Snehota, 2000), (Grönroos, 2004), (Ulaga & Eggert, 2006). In this paper we will build upon the ARA model with Actors, Resources and Activities ((Håkansson, 1987), (Håkansson & Snehota, 1989). In our analysis of actors and distribution of roles and responsibilities within a value networks we will use a modified form of the ARA model, see section 3.4.
3. Methodology, models and assumptions We have investigated a number of existing indoor solutions for provisioning of wireless access and compare these to different options for deployment of femtocell networks. In this section we describe the overall work flow, the data collection, the used models and assumptions and the approach for the business modeling and analysis. 3.1. The work flow The results in this paper have been obtained by doing the following work items: 1. Identify different technical indoor solutions for wireless access 2. Identify and contact market actors that can provide information on the technical solutions and/or the related business models and types of cooperation 3. Make a “sanity check” of expected demand – spectrum – radio access solutions in order to ensure that indoor wireless capacity demand can be met 4. Perform a round of interviews and discussions with mobile operators, local operators, facility owners, users, telecom vendors and 3rd parties 5. Analyze and describe the business models and cooperative patterns 6. Identify options for deployment of multi-operator femtocell networks and compare with existing indoor solutions 3.2. Assumptions User demand Today the mobile broadband usage is 2 GB per user and month in major markets in Western Europe. We will use two levels of monthly demand for our analysis, 10 and 50 GB per user. Assuming that the data is ”consumed” during 8 (equally traffic intensive) busy hours per day we get average corresponding continuous bit rates of approximately 0,10 Mbps4 and 0,50 Mbps per user for the 10 GByte and 50 GByte per month and user. Radio access technology, spectrum and capacity The offered capacity is the product of the amount of allocated spectrum (MHz) and the spectral efficiency (bps per Hz of spectrum). We assume spectral allocation in the range 5 – 20 MHz and a radio access technology with a re-use factor of 1 which implies that the corresponding capacity is available at each base station”. We will use a generic radio access technology with assumed spectral efficiency in the range 1 – 10 bps per Hz. Business environment and regulation The focus of the problem and possible solutions is on indoor femtocell networks in a multioperator setting, i.e. with different types of network sharing and roaming. We assume that all types of cooperation between actors are possible without any restrictions from telecom regulators. 4
bps = bits per second, Mbps = Megabits per second
3.3. Data collection A number of meetings and interviews have been conducted with representatives for the companies and organizations according to table I. The interviews with operators, users and third parties were organized as discussions around drivers and challenges for current indoor solutions, examples of questions are: - What kind of user requirements and drivers can be identified? - What technology solutions and options are of interest and what solutions dominate? - How can an indoor network deployment “project” start and who can initiate it? - How can an indoor network deployment “project” be organized and managed? - What kind of resources do you need, have or a need to develop? - Who are you partners and business customers? TABLE I.
INTERVIEWED COMPANIES
Mobile Network Operators SpringMobil Tele2 Telia Hot Spot Operators The Cloud Nordic Users, Business customers The Swedish Parliament “Skatteverket” Uppsala University Telecom Vendors Huawei Ericsson Nokia Siemens Networks Powerwave Third parties Absolute Mobile MIC Nordic
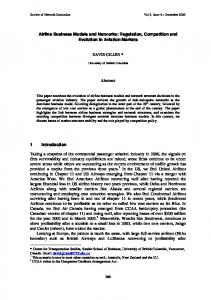
3.4. Analysis approach The functionality and responsibilities of different actors are mapped in order to describe the configuration of business roles within the value network for provisioning of the indoor access service. . In the used network model the three main entities are with Actors, Business roles and Relations. A business role controls a set of resources and performs certain activities in order to implement certain functionalities and exchange operations (Markendahl & Mäkitalo, 2007). This can be compared to the network model presented by Håkansson (1987) where Actors control and have certain knowledge of Resources. The Actors perform Activities interconnecting the resources. In the model used in this paper we highlight the relations between actors and the distribution of business roles among actors, see a generic map in Figure 1.
Actor 1 Business Role A Business Role B
Figure 1.
Actor 2
Actor 3
Business Role C
Business Role F
Business Role D
Business Role G
Business Role E
Generic illustration of actors and business roles
Examples of typical business roles including technical functionalities and responsibilities that will be used in our analysis in section six are: • To plan and deploy an indoor network and infrastructure • To operate an indoor network • To identify users and allow them to access the network resources • To charge end users and distribute payments • To handle relations with existing customers and users • Marketing and sales activities in order to acquire new customers Based on different business model definitions mentioned in section 2 we will focus on the following four elements in our analysis •
•
•
•
The value proposition; o The service is in all the studied cases to provide wireless access in indoor environments. The main difference between offers is if the access is for “any” user (public access) or for a specific user group only (private access). o Another value for business customers (enterprises and facility owners) is the possibility to offer one “common” infrastructure and one set of agreements. Financial aspects o This usually includes both revenues and network costs, in our analysis the main driver is to reduce the cost for network deployment and operation. This is evident in all our cases and is not further analyzed or quantified. Market segment o The type of user is related to if it is private or public access, and in the case of public access, if it is for customers of one or several operators. Configuration of the value network o What actors that take different roles o The relations between different actors o What actors that have relation(s) with the end-users
4. Indoor solution overview In this paper we will discuss and analyze the following technical and business solutions: - Distributed Antenna systems - The indoor GSM picocell concept, (ref: SpringMobil, Sweden) - Femtocell networks using HSPA or LTE base stations - WiFi hot spot networks for wireless Internet access
4.1. Distributed Antenna systems Distributed Antenna Systems, commonly referred to as “DAS”-systems, are typically deployed in office buildings and campus areas. In order to be meaningful the premises covered needs a certain size and traffic volume. DAS is not a solution for the home or SME’s5. The DAS systems are divided into two main types, active and passive. The passive DAS is based on a building distribution network based on coaxial cables and antennas. This type does not require any active electronics, and is still favoured for smaller installations. In most cases though, active networks are now installed to match requirements on availability and performance. As mentioned a DAS network is operator, and often system (2-4G) independent this maintains the value of the deployment since it is geared to accommodate future standards and operators. A typical DAS system layout is shown in figure 2 below. In a majority of the installations there is a base station room (“BTS Hotel”) in the cellar of the premises. A properly installed DAS gives a 100% coverage user experience. One often claimed advantage of the DAS is that each antenna port delivers higher capacity at the respective coverage spot compared to picoBTS and Femtocell solutions were the capacity is limited to the portion deliver by the local cell. This makes the DAS system more suitable to handle large fluctuations in traffic at the premises, for instance in a lunch canteen, a conference facility or other places were the users shift locations during the day. Antenna element Distribution network
Σ
Figure 2. 5
Base station Red MNO Base station Blue MNO
System overview of distributed antenna system (DAS)
Small and Medium sized Enterprises
4.2. The indoor GSM picocell concept, (ref: SpringMobil, Sweden) The picocell concept was developed by the GSM community to enable the design of a low cost indoor service based on a slightly relaxed technical specification. The picocell offers coverage in the range of a medium sized office floor. The picocells are often targeting SME’s, the UK/Ofcom “Low Power GSM” initiative was more or less based on the picocell solution. In addition picocells have been widely used for mobile telephone service on board ships. Due to higher output power than Femtocells and DAS nodes fewer picocells are need to create coverage. On the other hand sparsely located picocells result in low traffic capacity. In figure 3, a typical picocell configuration is shown. In the case of the operator SpringMobil in Sweden that offers this type of indoor solution a roaming agreement exists with the operator Tele2. This enables the SpringMobil customers to use the Tele2 network when outside of the company premises.
Base station Tele2
To Tele 2 network control Figure 3.
To SpringMobil networkcontrol
System overview of the SpringMobil/Tele2concept for ernterprize telephony
4.3. Femtocell networks using HSPA or LTE base stations The network node density for mobile broadband coverage will be similar to the DAS structure described above. The number of “antenna positions” and the cables mesh will match each other for DAS and Femto broadband. For an SME the Femto offer will be attractive in terms of re-using an existing CAT5/Ethernet structure and stepwise installation of Femtocells as demands grows. The base station connection room is not needed either; the interface is purely the ISP connection. Figure 4 shows this set up.
Macro layer base station
To operator networkcontrol Figure 4.
Internet
Femtocell base stations
System overview of operatar network with both macrocellular and femtocell layers
4.4. WiFi hot spot networks for wireless Internet access The WiFi service is spreading where homes, offices, hotels, airports and railways are adapting these in a high speed. The present trend is to offer these for “free”, in other words included in an other service such as lodging, travel, fast food, ADSL, etc. WiFi includes a decade of several generations of standards, IEEE802.11 a/b/g/n and so on. From a rollout perspective these are very close to the femtocell concept, see figure 4 above.
5. Analysis of demand, capacity and number of served users To judge the implication on indoor business strategies for operators and real estate owners for the coming decade, the technical solutions and estimated future deployment volumes need to be addressed. In this chapter we will focus on the indoor component and regard the outdoor macro network as a solved case. The mobile broadband evolution started for real in the UMTS network year 2007 when HSDPA modem dongles were introduced. In Sweden, the uptake was rapid and the same year the traffic volume in terms of bits for mobile broadband passed the voice bit transport. An average voice user consumes roughly 20 Mbytes per month. In many markets the average mobile broadband consumer of 2010 consumes 2 Gbyte per month. We expect that the monthly use will increase tenfold every 5 years. We have analyzed relatively high usage levels, 10 and 50 GBytes per user and month as already mentioned. These levels will be reached on the Swedish as well as other markets 2 to 6 years from now. It is wide recognized that roughly 70-90% of the traffic sessions takes place indoor. This fact will force deployment of mobile broadband infrastructure to handle the traffic where it is originated leaving the remaining 10-30% for the outdoor macro networks.
One way to view a standard macro mobile network is “being on the volcano” approach. The height of your position would correspond to your actual bit rate. If there are many visitors on the volcano it would sink down in the ground, bitrates decreeing. The best case for the user is to be alone at the flat top, which would guarantee maximal bit rate as long as you stay there. When moving away on the slope, the bite rate is decreasing until service fully disappears or you find yourself on the uphill slope of the neighboring volcano, see Figure 5. .
Figure 5.
Outdoor wireless network performance (simplified).
RAT 1 RAT 2 RAT 3
For twice the amount of Spectrum (2 X MHz)
Macro BS Figure 6.
For a given amount of Spectrum ( e.g. X MHz)
Bit rate performance as a function of the disctance to the nearest base station for different amounts of spectrum and different Radio Access technologies
The height of the bit rate volcano is the “up to” value given by the operators. This height is depending upon the spectrum available for them. Typical values are 2 times6 5, 10 or 20 MHz. Figure 6. illustrates how bit rates can depend on the amount of spectrum and on Radio Access technologies (RATs)7 with different spectral efficiency. In an indoor network, the situation will change. The struggle present in outdoor macro cells to overcome path loss in your link budget in order to give a good coverage/bandwidth performance is not at all the same in door networks. Due to small communication distances, the maximum performance can be supported all over a building, in a tunnel or at a campus area. Even very moderate emission levels handles the perfectly. In most cases, it is required and possible to cover indoor or campus at almost maximum bandwidth performance.
Figure 7. Indoor wireless network performance.
6
Paired separated spectrum is often used, “FDD” (Frequency Duplex Division), one direction to the user and one from. 7 Radio Access Technology are in our case different releases of 3GPP often denoted HSPA, HSPA+, LTE
TABLE II.
EXAMPLES OF SPECTRAL EFFICIENCY
3GPP and ITU target Values used in table III (bps per Hz) (bps per Hz) Peak value 15 – 30 10 Cell average ~2,0 1,0 At cell border - 0,10 0,10
Type of value
Target values for spectral efficiency; peak, cell average and at the cell border; are shown in table II together with the more “relaxed” estimates that we use in our sensitivity analysis for shown in table III. Bit rates and system capacity depend on the amount of spectrum and the spectral efficiency of the used RAT. Examples of system capacity and number of served users, assuming demand according to section 3.2 are shown table III. TABLE III.
System bandwidth (MHz) 5 5 5 20 20 20
ILLUSTRATION OF (THEORETICAL) NUMBER OF SERVED USERS
Spectral efficiency (bps per Hz) 10 1,0 0,10 10 1,0 0,10
System capacity (Mbps) 50 5 0,5 200 20 2
No served 10 GB users per node 500 50 1 2000 200 20
No served 50 GB users per node 100 10 1 400 40 4
In an indoor environment the spectral efficiency will be well above 1 bps per Hz.. For values in the range 1 – 10, the numbers in table III indicate that, depending where on the “indoor volcano” the users are, the following number of users can be served per node •
50-500 10GB users or 10-100 50GB users with a 5 MHz femtocell
•
200-2000 10GB users or 40-400 50GB users with a 20 MHz picocell or DAS system
These number of users that can be handled indicate that the number of base stations or nodes will be determined by coverage not capacity. In capacity limited scenarios, a DAS system can be “sectorized”, e.g. by deploying one “sector” per floor.
6. Existing actor cooperation Femtocell deployment is often discussed in terms of single-operator networks. Some lessons can be learned from deployment of existing networks where different types of cooperation between operators are common, at least in Sweden. In this section we will describe how the value networks are configured for different types of cooperation between operators and other actors.
6.1. Deployment and operation of wide area cellular networks Mobile network operators usually deliver services where the operators themselves take care of “most aspects”, i.e. the operators make use of a vertically integrated value chain, all business roles are handled by the operator. This is illustrated in Figure 8. for two operators, each with there “own” customers that can access the network of the “own” operator only. One type of cooperation where users can access the network of other operators is roaming, see Figure 9. A customer of the red MNO is allowed to access the network of the blue MNO. The business roles of the blue MNO related to access to and to the use of the “blue” network are involved, whereas the red MNO is in charge of the business roles responsible for customer contacts, user identification and billing. Most common is international roaming where the cooperating operators do not compete for the end-users. When national roaming is used the operators are present at the same market and hence compete. National roaming is often imposed by national regulators in order to lower barriers for market entrants. In Sweden the 3G Greenfield operator “3” (Hutchinson) used the GSM network of Telenor (earlier Vodafone) until 2008 in areas where own 3G coverage were lacking. Red MNO Marketing & sales Customer management Payments & billing Authentication Authorization Network operation Network deployment
Figure 8.
Blue MNO Marketing & sales Customer management Payments & billing Authentication Authorization Network operation Network deployment
Business roles for Mobile Network Operators (MNOs) with vertically integrated value chain
Red MNO
Blue MNO
Marketing & sales
Marketing & sales
Customer management
Customer management
Payments & billing
Payments & billing
Authentication Authorization
Authentication Authorization
Network operation Network deployment
Network operation Network deployment
Business roles for Mobile Network Operators with roaming agreements where a customer of the red MNO access the network of the blue MNO.
Figure 9.
Another type of operator cooperation is network sharing. National roaming can be seen as a form of network sharing but in Figure 10. we illustrate the case with a common shared infrastructure deployed and operated by a joint venture. The operators “control” their own customers but share the network resources. In Sweden two joint ventures for 3G networks exist; SUNAB owned by Telia and Tele2 and 3GIS owned by Telenor and “3”. Interestingly the cooperation strategy have changed when it comes to deployment of 4G networks, here Tele2 and Telenor have formed the new joint venture “Net4mobility” for deployment of a LTE network in the 2,6 GHz band and combining resources in the GSM900/1800 bands. Red MNO
Blue MNO
Marketing & sales
Marketing & sales
Customer management
Customer management
Payments & billing
Payments & billing
Authentication Authorization
Authentication Authorization Joint venture Network deployment
Figure 10.
Network operation
Business roles for Mobile Network Operators (MNO) with shared networks using a joint venture
6.2. Deployment and operation of indoor wireless networks In section 4 we described a number of technical solutions and concepts for provisioning of wireless access in indoor environments. In this subsection we will discuss these concepts in the business domain using the same type of illustrations as in subsection 6.1. The SpingMobil solution for enterprise telephony is often marketed as a “one person – one number - one phone” concept. The fixed line “company phones” and the “company switchboard” are replaced by a solution using mobile phones. Indoor SpringMobil GSM base stations provide indoor coverage for voice services at the company premises whereas nationwide outdoor coverage is provided by the partner Tele2 (that recently acquired SpringMobil). SpringMobil was awarded the 4th Swedish GSM license in the 900 MHz band, but, as far as we understand, the GSM indoor base stations all operate in the 1800 MHz band. The distribution of business roles are shown in Figure 11. This is a kind of “one sided” national roaming where SpringMobil customers can access the Tele2 network, compare Figure 9. Tele2 customers can not access the SpringMobil network. Moreover, SpringMobil customers of one business customer cannot access the SpringMobil network at the location of other business customers of SpringMobil. The access is for a closed user group only, this is similar to the closed access scheme for femtocells. Whereas the SpringMobil approach targets company specific solutions with private access WIFI hot spots offer public access for “any” authorized user. The WIFI access service can be for free at some locations (coffee shops and some hotels) but at airports, railways stations, trains and at some hotels the access service is offered for a usage fee. No matter if a usage fee is used or not, some kind of access control is used. The distribution of business roles among different types of actors are shown in Figure 12.
SpringMobil (indoor at enterprise) Marketing & sales Customer management Payments & billing Authentication Authorization Network operation Network deployment
Indoor Figure 11.
Tele2 (outdoor) Marketing & sales Customer management Payments & billing Authentication Authorization Network operation Network deployment
Outdoor
Business roles for the SpingMobil solution for enterprise telephony
Payment provider (Credit card company, Paypal, Boingo, MNO)
Hot Spot operator
Marketing & sales
Marketing & sales
Customer management
Customer management Payments & billing
Facility owner (e.g. hotel, airport)
Authentication Authorization
Payments & billing
Network operation Network deployment
Figure 12.
Business roles for a WIFI hot spot operator cooperating with a facility owner and payment providers
The operator of the WIFI network is responsible for deployment and operation of the network but usually does not have any “own” customers. The users are usually customers of another business like a hotel, an airport or a railway company, hence the customer acquisition is automatically handled by other companies. In the same way charging and payments can be managed by other actors like a hotel (put the fee on the room bill), credit card companies (at public locations), payment providers or by using the mobile phone subscription. The distribution of business roles using distributed antenna systems (DAS) are shown in Figure 13. The deployment of the DAS system is a cooperative effort while the network operation and all customer and billing related activities are handled by each operator. Red MNO Marketing & sales Customer management Payments & billing Authentication Authorization Network operation Network deployment
Figure 13.
Blue MNO Marketing & sales Customer management Payments & billing Authentication Authorization Network operation Network deployment
Facility owner and/or enterprize customer Network deployment
Business roles for a operators sharing an indoor infrastructure using distributed antenna systems
7. Business analysis of indoor solutions 7.1. Value proposition The offered product or service is in all our cases to provide and to ensure wireless access in indoor environments. We have identified a number of cases where different actors value this indoor coverage differently. In addition, there is a distinction between access for “any” user (public access) and when the access service is provide for specific users (private access). From the interviews we can conclude that the mobile operators view the dedicated indoor solutions as complements to the outdoor wide area systems. The indoor solutions are used at locations motivated by traffic and revenue considerations. The operators do a kind of revenue estimate for each customer case based on the customer needs, typically an enterprise with a business critical communication need. However, there are cases where bad radio coverage is compensated by deployment of a dedicated system without business reasons, typically this can be motivated by public safety reasons. The deployment of a dedicated indoor system is hence part of an agreement between an operator and a business customer. At the same time, an increasing interest for indoor solutions can be observed from real estate owners, facility managers and private companies. The main driver for these actors is to own infrastructure located inside the own buildings. Other drivers are to not be dependent upon a specific operator and to be able to make short term agreements, typically 12 – 24 months. The willingness of operators to invest in dedicated indoor solutions depends both upon the potential revenues and the deployment costs. Some operators for an extra fee offer “quality zones”, where the coverage is improved by use of repeater solutions. The interviews indicate a clear pattern among different types of actors when it comes to willingness to pay for a dedicated indoor system, see Figure 14.
Willingness to pay
Companies & Enterprise Owners of conference centers Hotels, fairs, Owners of shopping malls, railway stations, etc Local / Road authorities Traveller ”in tunnel”
Figure 14.
Type of end-user Visitors (public users) in malls
Visitor (guests) at hotels etc
Employees of company
Willingness to pay for different types of marketactors in order to ensure indoor coverage
The highest willingness to pay is found where the users are employees of a business customer of an operator. The service availability and capacity are in many cases very critical for the daily operation of a company, especially when a “mobile office” solution with mobile phones only is used. For case where an enterprise rents an office from a real-estate owner this actor need to find technical and financial solutions so that the business customer is satisfied. Other locations with relatively high willingness to pay include hotels, conference centers, fairs etc with a large share of public users. In these types of locations the access to reliable mobile communication services are also highly business critical. Bad radio coverage or service availability is risky for the core business of the hotel etc. Other cases with requirements for public access to mobile communications can be found in shopping malls. The interviews reveal a large variety in willingness to pay among retails chains, shopping malls and real-estate owners. Some actors clearly identify the indoor solutions as a opportunity to make operators pay for the right to install indoor networks. Other actors see indoor coverage as an added value to its own customers and are prepared to pay for deployment of indoor solutions. One commonly used approach is that the real-estate owner shares the costs for the antenna distribution systems and other equipment with one or several operators. In addition, the operators in these cases pay a “reasonable” site lease Finally, there are case like road tunnels and locations under bridges etc where the “facility owner” is some public or local authority. In these cases the willingness to pay is low since there is now “core business” that can generate revenues (or suffer from lost revenues) for the “owner” of the tunnel or bridge. Users will most likely not choose another road or highway due to known bad radio coverage. Users are often used to coverage holes and accept some degree of bad or lost connection when in the car 7.2. Market segments The SpringMobil solution targets business users only and hence “private access”. WiFi hot spots target “any user” and “public access”. Users can access the network using one time subscriptions or some other mobile operator or hotspot operator subscription. The DAS solutions are agnostic when it comes to private or public access. Operators may deploy the indoor solution at a specific location for a specific business customer. Usually, DAS systems are deployed by multiple operators and other actors in order to offer public access to the subscriber of the operators. 7.3. Value networks From section 6 we can conclude that mobile operators are the main actor for cellular solutions. Mobile operators may use different shared network solutions but always “control” their “own” customers. For WiFi hot spots the “control” of customers and payments are more distributed among the involved actors. However, in all cases with indoor solutions we can observe close cooperation between the network operator, the actors representing the users and actors that own or manage the local environment.
7.4. Implications for femtocell networks Building upon the findings on existing wireless access solutions we can identify some implications for deployment of femtocell networks. In Figure 15. we present four different options for femtocell deployment; one and several single-operator networks and multioperator solutions based on roaming or on multi-operator access points. One single-operator femtocell network is of course less suitable in locations where customers of all operators are present, see Figure 15. a) for users that can not access the network. However, both SpringMobil and hot spot type of approaches are feasible for singleoperator femtocell networks since closed user groups can be supported. Deployment of multiple single-operator femtocell networks would be a costly solution and in most cases not practically feasible from a customer or facility owner perspective with multiple operators involved in planning, deploying and maintaining separate networks. A network with multi-operator femtocells would mean reduced number of access points. The technical solution would mean access points with separate carriers (TRXs) for each operator. As far as we know this is not standardized in 3GPP or specified by any vendor. Multi-operator femtocell networks can be implemented with national roaming in local environments; this is to some extent similar to the SpringMobil approach. It can also be seen as one way to implement a shared infrastructure. As we have seen from existing solutions operators are used to cooperate and to share networks, both for wide area and for indoor deployment, i.e. using DAS. A roaming solution would allow operators to both share the costs and still maintain the relation with the “own” customers.
a) One single-operator femtocell network
b) Multiple single-operator femtocell networks
c) Network with multi-operator femtocells
d) Multi-operator solution based on roaming
Figure 15. Different options for deployment of femtocell networks
8. Discussion on spectrum and distribution network The totally available frequency resource for mobile broadband in Europe, (also relevant for other parts of the world although alternative band apply) can be found in the following bands: 450-470 MHz, Wide Area 3G/CDMA2000/EVDO and 4G/LTE 790-860 MHz, 4G/LTE 880-960 MHz, 2G/GSM, 3G/UMTS and 4G/LTE 1710-1880 MHz, 2G/GSM and 4G/LTE 1880-1900 MHz, DECT 1900-2200 MHz, 3G/UMTS and 4G/LTE 2400-2500 MHz, WiFi, Bluetooth 2500-2700 MHz, 4G/LTE and WiMax 3400-3800 MHz, Mobile Broadband Access 5150-5350 MHz, 5470-5725 MHz, 5725-5875 MHz, WiFi The total resource is more than 1000 MHz of spectrum a high value compared to the needs calculated in this document. Most of the above spectrum is available today; around 30% is unlicensed and 40% of very low usage (the 3 GHz band). It is evident that, based on our assumptions, spectrum availability will not be a problem in itself. The main explanation is the the small coverage area of dedicated indoor nodes where the resource are re-used many times. On the other hand a problem clearly appears in the backhaul infrastructure need to support all these nodes. In the Femtoforum definition of femtocells it is clearly stated that (existing) xDSL or cable broadband infrastructure shall be utilized. The concept is based on using existing fixed broadband at low or zero marginal cost. This applies clearly as an add-on to consumers and small enterprises. If the concept shall be enlarged to medium and large sized premises then the situation changes dramatically. In a larger femtocell based rollout, such as an office complex, a campus area or a dense urban environment the distribution network, or backhaul, will be a dominating part of the implementation. A backhaul network similar to the wired PTT/POTS infrastructure would be needed, which in turn will dominate the business case rather than the CAPEX/OPEX of the radio nodes themselves. With this in mind the femtocells infrastructure will be comparable with the DAS where the installation of cables is a part of the business planning. One existing solution for femto cells would be national roaming. A customer being indoor roams into the (preferred) femto cell network. Transparency can today be supplied according to existing standards using MSC to MSC handovers etc. So far the national roaming concept has not been successful due to the fact that the existing national operators are very reluctant to accept “small cherry picking actors” as roaming entities into their networks. One way to solve this would be to regulate a common open indoor network access provider into the market.
9. Conclusions Femtocells are currently mainly discussed as a solution to improve indoor coverage for voice services in homes and small offices. The access is limited to a closed user group. The proposed business cases have a large focus on the consumer segment where a femtocell is seen as a product that together with price plans are expected to increase customer loyalty and decrease churn. In this paper we focus on femtocell deployment for provisioning of mobile broadband services and for public access. In these types of business cases the operators use femtocells to reduce networks costs, investments in “more costly” macro networks can be avoided or delayed since the traffic can be “offloaded” to “less costly” femtocell networks. The main question discussed in this paper is if “operators need to consider new forms of cooperation strategies in order to enable large scale deployment of femtocells for public access?” By looking into existing solutions for indoor wireless access services we can answer the first two research questions defined in the introduction. Operators are cooperating for provisioning of indoor coverage for existing 2G and 3G system, in Sweden usually often involving “all” mobile operators and the facility owner. Hence, we can argue that the multioperator business models used for indoor mobile voice also be used for femtocell networks. Another fact is that actors like real estate owners already have entered the value network. For the two other research questions related to spectrum allocation, system capacity and regulatory aspects we have the following conclusions: RQ3. Are existing spectrum allocation strategies and system concepts feasible for satisfying future demand of indoor mobile broad band services? The demand-capacity analysis indicates that spectrum allocation strategies, assuming current system solutions, are sufficient to meet future user demand, at least up to 50 GB per user and month. Spectrum will not be a problem in itself, the main reason for this is the small coverage areas of the indoor nodes. On the other hand a problem may appear in the backhaul infrastructure needed to support all femtocell nodes. The concept is based on re-use of existing fixed broadband at low or zero marginal cost. This reasoning can be applied to consumers and small enterprises. If the concept shall be extended to medium and large sized premises the situation would change dramatically. RQ4. Are new roaming and/or radio resource management schemes needed in order to enable multi-operator femtocell networks? A multi-operator femtocell network would in principle be possible to deploy today by use of national roaming. This requires strategies that ensure that users are handed over to the “correct” outdoor network. Handover issues are currently discussed in 3GPP for singleoperator operation. The handover may be a “show stopper” for multi-operator femtocell networks for voice services. However, for mobile broadband with nomadic or stationary users the handover problem would be possible to handle. In general, a distributed antenna solution enables operators to operate their networks in a more independent way. The same would be true for base stations with separate transceiver for each operator. However, the authors are not aware of any development or standardization of multi-operator femtocells
All in all, the four indoor solutions discussed are in the long run comparable without a clear winner in a business implementation perspective. The pico cell solution gives a larger initial coverage using a few nodes, which is an advantage for minimizing the initial investment. In the long run the pico cell technology will have difficulties to offer business solutions for high capacity demands. The DAS gives real estate owners a possibility to offer a general and more or less, transparent system and operator coverage service. This solution offers traffic capacity for dynamic hot spots since the capacity delivery is centralized. The femtocell solution might be very attractive if a fixed wideband structure is already in place. The femto solution needs improvements to offer an acceptable service including roaming, handovers and multi operator functionality. This is required in order to avoid the disadvantage of parallel infrastructures. The WiFi service will most likely be seen as a carrier of future femtocells, using combined 3G/4G and WiFi cells. To summarize we can say that the answer to the main question if “mobile operators need to consider new forms of cooperation strategies….?” is both “Yes” and “No”. No – since suitable types of cooperation are already in place for indoor deployment Yes - Operators need to re-think the femtocell business models, from approaches based on singe operator networks to different forms of cooperation involving multi-operator solutions This is especially true when LTE femtocells are considered for build out of mobile broad band networks, both for offloading scenarios and also for the cases where indoor systems provide most of the network. We believe that operators to a larger extent than now should consider the ideas discussed in (Rækken, 2010) “
a wiser coverage strategy could be to build capacity inside-out”
Bibliography Femtocells and other types of indoor deployment F. Bar, N. Park,“Municipal WiFi networks: The goals, practices and policy implications of the US case”, Communications & Strategies No 61, 2006, Barcelo et al, “Wireless open access technologies: State of the Art and technical opportunities”, First Int Conf on evolving Internet, 2009 D. Calin et al “ On femto deployment architectures and macrocell offloading benefits in joint macrofemto deployments, IEEE Communications Magazine, Jan. 2010 J Cox, “Municipal WiFi as large scale for profit projects falter innovative new models emerge”, Network World: April 21, 2008 G. De la Roche et al, “Access control mechanisms for femtocell”,IEEE Com. Magazine, Jan 2010. Femtoforum; Femtocell Business case Whitepaper; June 2009, February 2010, www.femtoforum.org J C Francis et al, “Business opportunities of open broadband wireless access networks, Int workshop on broadband wireless access for ubiquitous networking, 2006 T. Lindner et al, 2004, “Exploitation of Public and Private WiFi Coverage for New Business Models”, IFIP Conference on E-Commerce, E-Business, and E-Government (Springer) J. Markendahl , Ö. Mäkitalo , “Business model analysis for local access provisioning”, The 18th Int. Symposium on Personal, Indoor and Mobile Radio Communications (PIMRC707); 2007 J. Markendahl et al, ”Business Innovation Strategies to Reduce the Revenue Gap for Wireless Broadband Services” Communication & Strategies, no 75, 3rd quarter 2009 C. Middleton, A. Potter , 2008, “Is it good to share? A case study of the FON and Meraki approaches to broadband provision”, ITS Biennal Conference, Montreal, June 2008 R. H. Rækken, “Femtocells for Wireless in the Home and Office”, Teletronikk, No 1, 2010 T. Smura, A Sorri, “Future scenarios for future local area access: Industry structure and access fragmentation”, 8th Int Conf on Mobile Business, 2009 M Tolstrup, “Indoor ”Indoor Radio Planning”, 2008, ISBN 978-0-470-05769-8 M. Yavuz et al, “Interference management and performance analysis of UMTS/HSPA+femtocells”,IEEE Communications Magazine, Jan. 2010.
Infrastructure cost modeling and analysis G. Blennerud, “Don´t worry – Mobile broadband is profitable”, Ericsson Business Review,#2 2009 G. Blennerud, “The recipe for mobile broadband profitability”, Ericsson Business Review,#3 2009 G. Blennerud, “Mobile broadband – busting the myth of the scissor effect”, Ericsson Business Review,#2 2010 H. Claussen, L Ho, L. Samuel ,, “Financial Analysis of a Pico-Cellular Home Network Deployment”, Proceedings ICC 2007
F. Loizillon et al, “Final results on seamless mobile IP service provision economics. Technical report”, October 2002. IST-2000-25127 TONIC, Deliverable 11, http://www-nrc.nokia.com/tonic J. Markendahl, Ö Mäkitalo, J. Werding, “Analysis of Cost Structure and Business Model options for Wireless Access Provisioning using Femtocell solutions”; 19th European Regional ITS Conference, 2008 J. Markendahl, Ö Mäkitalo, “A comparative study of deployment options, capacity and cost structure for macrocellular and femtocell networks”, to be presented at the 2nd IEEE International Workshop on Indoor and Outdoor Femto Cells (IOFC 2010), Istanbul, September 2010 B.G. Mölleryd et al “Analysis of operator options to reduce the impact of the revenue gap caused by flat rate mobile broadband subscriptions”, ” 8th Conf. on Telecom, Media & Internet Tele-Economics, June 2009 B.G. Mölleryd et al “Decoupling of revenues and traffic - Is there a revenue gap for mobile broadband?” 9th Conf. on Telecom, Media & Internet Tele-Economics, June 2010 B. T. Olsen, "The Core of Techno-Economics; A historical review and new business modeling with examples from the CELTIC MARCH project", Key Note speech at CTTE 2009, Stockholm, June 2009, available: http://www.ctte-conference.org/?q=node/14
Business model design and theories P. Ballon, “Business modeling revisited: the configuration of control and value”, INFO: The Journal of Policy, Regulation and Strategy for Telecommunications, Information and Media, 9, pp 6-19, 2007 . H. Bouwman et al (ed), “Mobile service innovation and business models”, Springer, 2008 A. Braccini, “Business model definition methodologies for telecommunication services”, ITS Regional Conference, Rome, September 2008 H. Chesbrough & R.S. Rosenbloom, “The role of business model in capturing value from innovations: Evidence from Xerox Corporation’s technology spin-off companies", Industrial and Corporate Change, Vol. 11, no. 3, pp. 529-555, 2002 E. Faber et al, ““Designing Business Models for Mobile ICT Services”, Proceedings of the 16th Bled Ecommerce conference, Bled, June 2003. J. Gordijn, Y.H. Tan, ”A Design Methodology for Modeling Trustworthy Value Webs”, International Journal of Electronic Commerce, 9 (3), pp 31-48, 2005 J. Gordijn, and J.M. Akkermans, “Designing and evaluating e-business models”, IEEE Intelligent Systems - Intelligent e-Business, 16, 4 , pp. 11-17, 2001 R. Normann & R. Ramirez: "From Value Chain to Value Constellation: Designing Interactive Strategy", Harvard Business Review, Jul/Aug, Vol. 71, Issue 4, 1993 A. Osterwalder et al,” Clarifying Business Models: origins, present, and future of the concept”, Communications of the Association for Information Systems, 16, 2005, pp 1-25.
Actor relations and networks J Andersson et al, “Dyadic business relationships within a business network context”, Journal of Marketing, Vol 58, No 3, pp 1- 15, 1994 L-E Gadde, I Snehota, “Making the most of supplier relationships”, Industrial Marketing Management, Vol 29, pp 305-316, 2000 C Grönroos, “The relationship marketing process; communication, interaction, dialogue, value”, Journal of Business & Industrial marketing, Vol 19, No 2, pp 99 – 113, 2004 H. Håkansson (ed), “Industrial technological development, a network approach”, Croom Helm, 1987 H. Håkansson, I Snehota, “ No business is an island, the network concept of business strategy”, Scaninavian Journal of Management, Vol 5, No 3, pp 187-200, 1989 J. Johansson, L-G Mattsson, “Marketing investments and market investments in industrial networks”, Int. Journal of Research in Marketing, Vol 2, pp 185-195, 1985 J, Markendahl, O, Mäkitalo, “Analysis of Key Capabilities and Business Role Interaction for provisioning of public Internet access in local environments”, 18th Regional ITS Conf, 2007 W Ulaga & A Eggert, “Value based differentiation on business relationships: gaining and sustaining key supplier status”, Journal of Marketing, Vol 70, No 1, pp 119-136, 2006