ACSEG'2004 proceedings – Connectionist Approaches in Economics and Management Sciences Lille (France), 18-19 November 2004, pp. 112-119
Business Plans Classification with Locally Pruned Lazy Learning Models
Antti Sorjamaa1 , Amaury Lendasse1 , Damien Francois 2 and Michel Verleysen3 1 Helsinki University of Technology Neural Networks Research Center, FI-02015, Finland, Tel : +358 9 451 4499 E- mail : {asorjama,lendasse}@cis.hut.fi 2 Université catholique de Louvain CESAME, av. G. Lemaître 4, B-1348 Louvain- la-Neuve, Belgium Tel : +32 10 47 8002 E- mail :
[email protected] 3 Université catholique de Louvain Machine Learning Group, Place du Levant, 3, B-1348 Louvain- la-Neuve, Belgium Tel : +32 10 47 2551 E- mail :
[email protected] Résumé : Un plan d’affaires est un document présentant de manière concise les éléments clefs qui décrivent un projet de création d’entreprise. Celui-ci est utilisé comme un outil parmi d’autres pour évaluer la faisabilité et la rentabilité d’un projet. Dans ce papier, nous étudierons la relation entre la qualité d’un plan d’affaires et la réussite de ce projet. En particulier, une méthode de classification utilisant l’information provenant du plan d’affaires est utilisée dans le but de prédire le succès ou bien l’échec de chaque projet. La méthode de classification qui est utilisée se base sur une approximation linéaire par morceaux connue sous le nom de Locally Pruned Lazy Learning Model. Mots clefs : Lazy Learning, Classification, Leave-one-Out, Elagage. Abstract : A business plan is a document presenting in a concise form the key elements describing a perceived business opportunity. It is used among others as a tool for evaluating the feasibility and profitability of a project. In this paper, we study the relationship between business plan quality and venture success. In particular, a classification method using the information from the business plan is used in order to predict the success or the failure of each project. The classification method presented in this paper is based on a linear piecewise approximation method known as Locally Pruned Lazy Learning Model. Key-Words : Lazy Learning, Classification, Leave-one-Out, Pruning Acknowledgements: Part the work of A. Sorjamaa and A. Lendasse is supported by the project New Information Processing Principles, 44886, of the Academy of Finland. The work of D. Francois is supported by a grant from the Belgian FRIA. M. Verleysen is a Senior Research Associate of the Belgian National Fund for Scientific Research. Part of this work is supported by the Interuniversity Attraction Poles (IAP), initiated by the Belgian Federal State, Ministry of Sciences, Technologies and Culture. Dataset has been cordially provided by B. Gailly from UCL, Belgium.
1
ACSEG'2004 proceedings – Connectionist Approaches in Economics and Management Sciences Lille (France), 18-19 November 2004, pp. 112-119
Business Plans Classification with Locally Pruned Lazy Learning Models Résumé : Un plan d’affaires est un document présentant de manière concise les éléments clefs qui décrivent un projet de création d’entreprise. Celui-ci est utilisé comme un outil parmi d’autres pour évaluer la faisabilité et la rentabilité d’un projet. Dans ce papier, nous étudierons la relation entre la qualité d’un plan d’affaires et la réussite de ce projet. En particulier, une méthode de classification utilisant l’information provenant du plan d’affaires est utilisée dans le but de prédire le succès ou bien l’échec de chaque projet. La méthode de classification qui est utilisée se base sur une approximation linéaire par morceaux connue sous le nom de Locally Pruned Lazy Learning Model. Mots clefs : Lazy Learning, Classification, Leave-one-out, Elagage. Abstract: A business plan is a document presenting in a concise form the key elements describing a perceived business opportunity. It is used among others as a tool for evaluating the feasibility and profitability of a project. In this paper, we study the relationship between business plan quality and venture success. In particular, a classification method using the information from the business plan is used in order to predict the success or the failure of each project. The classification method presented in this paper is based on a linear piecewise approximation method known as Locally Pruned Lazy Learning Model. Key-Words : Lazy Learning, Classification, Leave-one-out, Pruning.
1. Introduction A business plan is a document presenting in a concise form the key elements (management, finance, marketing, etc) describing a perceived business opportunity. It is used among others as a tool for evaluating the feasibility and profitability of a project from the entrepreneur's or investor’s point of view. In this paper, we try to analyze to which degree a well thought and well written business plan leads to a successful venture in order to understand the link between business plan quality and venture success. We used a set of 119 business plans that were collected in the context of business plan competition organized in France, Belgium, Germany and Luxembourg (Gailly B. (2003), Francois D. et al. (2003)). Each business plan was evaluated by experts, on a double-blind basis, according to seven criteria, with grades ranking from 0 to 10. Concerning the expected result of the classification, a project is considered successful if it leads to an actual commercial activity and if it is still active 24 months after the initial assessment. When one tries to predict the success or failure of a project, one has to find the most relevant criteria among the initial ones, choose and design a classifier, and choose a threshold (cutoff value) between a success and a failure. The aim of the latest is to optimize an application-driven criterion, which might not be the classical “least misclassification number” or “least mean square error”. The variable selection stage is necessary because of the small number of samples, which forces to restrain the number of parameters in the models and so makes it harder to obtain good generalization performances. The classification method presented in this paper is based on a linear piecewise approximation method named Lazy Learning. This method is presented in section 2. This 2
ACSEG'2004 proceedings – Connectionist Approaches in Economics and Management Sciences Lille (France), 18-19 November 2004, pp. 112-119
method has been successfully modified to include an input selection procedure. The new method is known as Locally Pruned Lazy Learning Model and is described is section 3. The threshold selection that uses the optimization of the precision is presented in section 4. Finally this method is used with the set of 119 business plans. The results are presented in section 5.
2. Lazy Learning Models Lazy Learning model (LL) is a linear piecewise approximation model based on knearest neighbors (k-NN) method (Bontempi G. et al. (1999), Bontempi G. et al. (2000)). Around each sample, the k-nearest neighbors are determined and used to build a local linear model. This approximation model is the following: y = LL(x1 , x2 ,..., x n ) ,
(1)
with y the approximation of the output and x 1 to x n the n selected initial inputs. The number of inputs and the inputs themselves must be determined a priori in LL models. The optimization of the number of neighbors is crucial. When the number of neighbors is small, the local linearity assumption is valid but a small number of data will not allow building an accurate model. On the contrary, if the number of neighbors is large, the local linearity assumption is not valid anymore but the model is more accurate. For an increasing size of the neighborhood, a leave-one-out (LOO) procedure is used to evaluate the generalization error of each different LL model (Efron, B. et al (1993)). The LOO procedure takes each neighbor out successively. The neighbors that remain are used to build the local linear model and the error is evaluated with the data taken out. The generalization error is the average of model errors computed with each neighbor absent. Once the generalization error for each neighborhood size is evaluated, the number of neighbors that minimizes this generalization error is selected. The main advantages of the LL models are the simplicity of the model itself and the low computation load. Furthermore, the local model can be built only around the data for which the approximation is requested. Unfortunately, as mentioned above, the inputs have to be known a priori. Several sets of inputs have to be used to select the optimal one. The error has to be evaluated around each data point for each set of inputs. The optimal input set is the one that minimizes the generalization error. This procedure is long and reduces considerably the advantages of the Lazy Learning. In the next section, we will present an enhanced input selection methodology taking place in the Lazy Learning itself.
3. Locally Pruned Lazy Learning Model Local Pruning Lazy Learning (LPLL) method is a modified version of the initial LL been presented in the previous section. This new method takes out the least important inputs and therefore provides an approximation that will require smaller number of neighbors. For each sample for which the approximation is required, an initial model is build: y = LL(x1 , x2 ,..., x n ) .
(2)
In this model, all available inputs are used. Then each input from x 1 to x n is taken out successively. The basic LL is applied to each pruned input set and the generalization error is obtained. Then the pruning choice that minimizes the generalization error is selected and the
3
ACSEG'2004 proceedings – Connectionist Approaches in Economics and Management Sciences Lille (France), 18-19 November 2004, pp. 112-119
corresponding input is definitely taken away. For example, if the pruned input leading to the minimum generalization error is x 2 , the model will become: y = LL(x1 , x3 ,..., xn ) .
(3)
This operation is repeated until an optimal set of inputs is determined for each sample. This optimal set of inputs is the one that minimizes the generalization error obtained with the Leave-one-Out procedure. The set of inputs that is selected can be different for each sample. This comes from the fact that locally, some inputs can be more important for some specific state (of the input) and also because of nonlinearities in the data set. The fact that the input sets are different will not increase the complexity of the global model but will considerably decrease the generalization error that is obtained.
4. Threshold Selection When the approximation of the success probability is found (in this case, using the LPLL models), it is necessary to determine the threshold that will be the frontier between predicted successes or failures (Bishop C. M. (1995)). A trivial way is to fix this threshold to 0 (assuming that success is marked with 1 and failure with -1). This method is efficient if the a priori probabilities of the two classes are really 0.5. In our case, the data set is biased (only 17% of the samples are successes); the threshold of such a biased set cannot be easily determined a priori. For example, this threshold can be chosen to optimize some categorization error. Two different errors can occur: the classification of a failure as a success (false success) and the classification of a success as a failure (false failure). This information is summarized in a confusion matrix below. Table 1: Confusion Matrix. Predicted Failure Observed Failure True Failure Observed Success False Failure
Predicted Success False Success True Success
These values are related to each other with respect to the threshold. A large threshold will lead to a large number of False Failures and a small number of False Successes. On the contrary, a small threshold will lead to a larger number of False Successes and a smaller number of False Failures. The rate of False Successes is the number of False Successes divided by the total number of Observed Failures. The rate of False Failures is the number of False Failures divided by the total number of Observed Successes. When a class (Success or Failure) is over- or under-represented, it is more interesting to choose a threshold that minimizes the sum of the error rates instead of the total number of errors. Other criteria exist; they are expressed as relationships that use the confusion matrix elements. From the investor’s point of view, a False Failure won’t cost so much money than a False Success. Indeed, a False Failure is a company that makes money but investors didn’t invest in it. The investors just missed this opportunity. A False Success is a project where the investors invested the ir money but which finally becomes a failure; the investors lose their money. In this paper, we are going to choose the threshold that maximizes the Precision, defined as the ratio of True Successes among the Predicted Successes. But the rate of Predicted True Successes (known as Recall) will also be taken into account, in order to penalize too large threshold s, when the number of selected projects will eventually decrease to zero. In fact, if the Precision is maximum, the only Predicted Successes will be the real 4
ACSEG'2004 proceedings – Connectionist Approaches in Economics and Management Sciences Lille (France), 18-19 November 2004, pp. 112-119
successes if data are consistent. But the number of such Predicted Successes is much too small to be interesting in the investor’s point of view. The threshold can be considered as a structural parameter and it should be chosen in order to maximize the precision of the validation set (build by the Leave-one-Out procedure). Then, the selected threshold will not be specific to the data set used for the training phase of the Lazy Learning model.
5. Results The data set has been collected in the context of a business plan competition organized in Belgium, France, Germany and Luxembourg in 2001 and 2002. The projects (business plans) are coming from different fields: Insurance, environment and telecommunications. The descriptions of these projects have been submitted using electronic format including 5 to 25 pages. The participants described the structure of the company, the aimed market, eventual competitors, etc. Each business plan has been sent to a group of experts who evaluated it according to criteria described in Table 2. The grades are on a scale from 1 to 10. Table 2: Evaluation criteria 1
Attraction: Does the project look appealing?
2
Main Aspects: Are the main aspects studied in the project?
3
Usability for costumers: Is the project interesting for the market?
4
Differentiation: Is the project different than the competitors’ projects?
5
Market: Is the market appealing in terms of eventual growth?
6
Competition: What is the number of competitors on the aimed market?
7
Global Evaluation
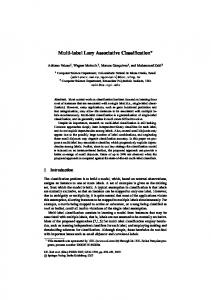
Each project was considered successful if it had lead to an actual commercial activity and if it was still active 24 months after the initial assessment. The data set from the competition organized in 2001 consists of 119 projects, 20 of which being considered as successes. This data set is used for training and for model structure selection. The data set from the competition organized in 2002 consists of 42 projects, 15 of which being considered as successes. This second data set is used as test set. The LPLL models are built with the training set. Figure 1 presents the optimal number of nearest neighbors that is selected by the Leave-one-Out procedure for each sample of the training set. Figure 2 presents the optimal number of inputs that is selected for each sample of the training set. Figure 3 presents the precision with respect to the threshold. The maximum precision is obtained with a threshold around -0.34. Figure 4 presents the return value with respect to the threshold.
5
ACSEG'2004 proceedings – Connectionist Approaches in Economics and Management Sciences Lille (France), 18-19 November 2004, pp. 112-119
Number of neighbors
100 80 60 40 20 0 0
20
40
60 Training set
80
100
120
100
120
Figure 1: Optimal number of nearest neighbors for each sample of the training set.
Number of inputs
7 6 5 4 3 0
20
40
60 Training set
80
Figure 2: Optimal number of inputs for each sample of the training set.
0.5
Accuracy
0.4 0.3 0.2 0.1 -1
-0.5
0 Threshold
Figure 3: Precision with respect to the threshold.
6
0.5
1
ACSEG'2004 proceedings – Connectionist Approaches in Economics and Management Sciences Lille (France), 18-19 November 2004, pp. 112-119
0.5
Return
0.4 0.3 0.2 0.1 0 -1
-0.5
0 Threshold
0.5
1
Figure 4: Return value with respect to the threshold.
The global model (LPLL models and threshold) is applied to the test set. Figure 5 presents the optimal number of nearest neighbors that is selected by the Leave-one-Out procedure for each sample of the test set. Figure 6 presents the optimal number of inputs that is selected for each sample of the test set.
Number of neighbors
100 80 60 40 20 0 0
5
10
15
20 25 Test Set
30
35
40
45
35
40
45
Figure 5: Optimal number of nearest neighbors for each sample of the test set.
Number of inputs
7 6 5 4 3 0
5
10
15
20 25 Test Set
Figure 6: Optimal number of inputs for each sample of the test set.
7
30
ACSEG'2004 proceedings – Connectionist Approaches in Economics and Management Sciences Lille (France), 18-19 November 2004, pp. 112-119
The final results using LPLL models are summarized in Table 3. Table 3: Results Leave-one-Out on the training set Test set
Precision 40% 57.33%
Return 20% 53.33%
6. Conclusion We have shown in this paper that it is possible to extract information from the business plans in order to predict the probabilities of their success. Furthermore, the models that have been used do not need any expert knowledge or extra information. The results obtained with the learning set (2001) using the Leave-one-out procedure are not very good (40% of accuracy). This is probably due to the small number of successes in the training set (17%). Nevertheless, if the selected projects were drawn at random, the precision should be 17%; the proposed model thus multiplies the expected precision by more than two. The results obtained with the test set (2002) are better: 57% of accuracy. The percentage of success is 36% for this test set. Here, the accuracy is increased by 60%.
References Gailly B. (2003), Teaching entrepreneurs how to write their business plan: case study and empirical results, IntEnt Conference, Grenoble. Francois D., Lendasse A., Gailly B., Wertz V. and Verleysen M. (2003), Are Business Plan useful for Investors? Connectionist Approaches in Economics and Management Sciences, Nantes, France. Bontempi G., Birattari M., Bersini H., (1999) Lazy learning for modeling and control design. International Journal of Control, 72, 7/8, 643-658. Bontempi G., Birattari M., Bersini H. (2000) A model selection approach for local learning. Artificial Intelligence Communications, 13,1,41-48. Efron, B., Tibshirani, R. J. (1993), An introduction to the bootstrap, Chapman & Hall. Bishop C. M. (1995) Neural Networks for Pattern Recognition. New York: Oxford.
8