involved business objects) is a starting point for improve- ment. Business process modeling is used for communication and understanding of processes.
Business Process Modeling for Post Execution Analysis and Improvement Azeem Lodhi and Veit K¨oppen Department of Technical and Business Information Systems Faculty of Computer Science University of Magdeburg Universit¨atsplatz 2, 39106 Magdeburg, Germany e-mail: {firstname.lastname}@ovgu.de Abstract—Evaluation and analysis of business processes are important for improvement of business processes. Business process modeling is used as a medium of communication between stakeholders. Most of the research in business process modeling is focused on alignment of information technology services and business operations. Existing process models lack the representation of performance data for evaluation and analysis. The process models conceived for information system development are not sufficient for such representation. This paper discusses the challenges of business process modeling in the post execution analysis context and describes the characteristics of an analytical modeling language. Furthermore, we also extend an existing modeling language and explain the proposed extensions with the help of a case study. Keywords-business process modeling, business process analysis, analytical modeling language, improvement
I. I NTRODUCTION Enterprises try to provide better services in order to keep their strategic position in the market. Management of business operations undergoes different trends. Specific terms have been coined to describe the research focus like data oriented approaches (common from seventies and eighties) and process oriented approaches (from last two decades) [25]. In data oriented approaches, provision of IT services for business were the main focus and specific models are proposed for this purpose like data models. Afterwards, the focus shifted to process level where different modeling techniques and systems were proposed [14]. Recent changes enforced enterprises to better understand their processes and improve them. An important research area in this context is an investigation of models and systems for post execution analysis improvement. For improvement, evaluation and analysis of enterprise operation are a prerequisite. Enterprises with better control and insights about their processes have an advantage over others. Understand a business process and its context (with involved business objects) is a starting point for improvement. Business process modeling is used for communication and understanding of processes. Management of business operations require different models in its phases as discussed in [1], [16], [18]. In [17], authors differentiate process models for software development and process restructuring.
c Submitted in SKIMA 2011, 8-11 SEP-2011, Benevento, Italy. IEEE
Different models and views are required for restructuring and analysis of business processes [1]. Process mining techniques [23] focuses on the process level and extracts knowledge about business process executions from log files of information systems . Most of the research in process mining is focused on alignment of information technology and business processes. It also provides different statistics for analyses. Similarly, in [13], an improvement framework is briefly discussed to extract process the knowledge and storage. Limited research is carried out to represent process knowledge through business process models for improvement. Currently, information is represented as key performance indicators (KPIs) or using different approaches of visualizations (e.g., pie charts or histograms) which is too abstract and does not provide process details to business analysts. For evaluation of business processes, process performance data in different dimensions like time and cost are important with process model. Descriptive graphical methods can provide substantial results in business process improvement and optimization [7]. Most of the modeling languages are designed for the development of information systems as discussed in [14]. Few articles in business process analysis use business process models in post execution analysis phases. However, using these modeling languages for analyses of business processes is not appropriate, specifically after execution, as these models are not designed for this purpose. Business process modeling has to be further investigated for adequate representations of business processes, especially after execution for analysis and improvement. In this paper, we discuss business process modeling and its representational hierarchy from post execution analysis perspective in Section II. We also discuss the evaluation and post execution analysis in detail. In Section III, we discuss the challenges of representation for analysis and improvement of business processes. The characteristics of an analytical modeling language are briefly described in Section IV. We consider the characteristics of an analytical modeling language and provide an extension of existing modeling language in Section V with the help of a case study. In the end, we summarize our paper and provide an outlook in Section VI. Submitted for the IEEE Computer Society
II. B USINESS P ROCESS M ODELING Graphical business process models are used for communication between different stakeholders (e.g., executives, managers, and employees) at various levels. Being graphical nature of business process models, they are used to represent operations of an enterprise. This is a better and quick way for a better understanding and analysis compared to textual descriptions. Business process modeling has increased the ability to understand operations and helps in order to make rational decisions for organizing activities in a traceable and understandable way [4]. Business process modeling is used in different phases of the business process management lifecycle, like from identification of business processes to implementation in information system, analysis, and improvements after business process execution. Business process modeling is considered as the first and the most important step in a business process management [24]. We restrict ourselves in this work to post execution representation of business processes for analysis, cf. [14]. We also do not go into details of a business process management lifecycle, its different phases, and models used in those phases, cf. [12].
Legend
Perspective
Organisational
includes
includes
B. Object
Machine
considered in
considered in
Dimension
Time
using different
using
Attribute
Idle time
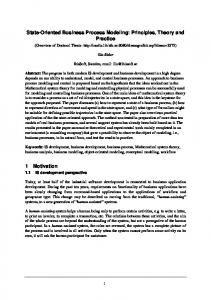
Figure 1.
Business process modeling hierarchy and example
Legend Class
Start time
Instance
End time
Business Obj.
has
Characteristics
Capacity
measured in
Experience
Skills
Dimensions Time
A. Representational Hierarchy Different stakeholders are involved in business processes at different levels like strategic, management, and operation level. These stakeholders (e.g., executives, managers, and other employees) have different requirements and expectations from business process models. Executives are interested in an overall picture of business processes, thus they require a suitable abstraction of BP models. Managers look for specific details of processes and activities under their responsibility. Therefore, business process models are viewed at different levels of granularity (abstract or in detail) by stakeholders. Business processes are modelled in various perspectives under which different business objects are analyzed in various dimensions using attributes related with them. Here, we provide a relationship between perspectives, business objects, and dimensions in a form of hierarchy from post execution modeling perspective. This relationship is shown in the Figure 1 and further explained as follows. Business processes are investigated from various perspectives to get a better understanding about them. In a perspective, specific involved objects are presented in a model/view to focus the particular details as required by the stakeholder. A better understanding of business processes helps to improve them and accommodate the changes in processes. In [10, p. 118-121], authors identify five mandatory perspectives which can be further enhanced with six other perspectives in a context of workflows. Some examples of perspectives are organizational perspective, control flow perspective, and operational perspective.
Class Instance
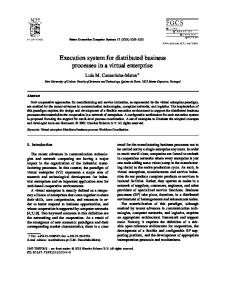
Figure 2.
Cost
Quality
Business object characteristics and dimensions
Mostly, specific elements (business objects) of processes are considered under these perspectives. For example, in organizational perspective resources of organizations are considered, like employees and machines. Similarly, in control flow perspective, sequence or collaboration of activities, and conditions are analyzed. Business objects have certain characteristics which define their state. Further characteristics of business objects become important when they get involved in business process (process executions) and interact with other objects. In different analyses, business objects are analyzed from various dimensions. Examples of these dimensions are time, cost, and quality. Different attributes of business objects and processes are analyzed under these dimensions. We show the relationship of business objects, characteristics, and dimension in Fig. 2. We have further discussed details of business objects and business processes in [12]. In the Figure 1, the left hand part shows the classes or concepts whereas on the right hand part example of those classes/concepts are shown. The presented hierarchy of Figure 1 explains how different models are built for analyses in post execution context. For example, at an abstract level of granularity, only few elements are considered and their aggregations are used and vice versa for detailed models. Different perspectives, dimensions, and their attributes can be used to extend business process models in order to
provide support for post execution analysis. Computation of analytical data and various attributes of these dimensions are out of scope of this paper. In Table I, we summarize some of the examples of different perspectives, involved business objects, dimensions, and their attributes. Other perspectives can also be achieved by including different business objects in control flow perspective like technological perspective will be achieved by including technical objects (involved systems and applications). Similarly, environmental or compliance perspective will be achieved by extending models with environmental objects, rules, and their related attributes.
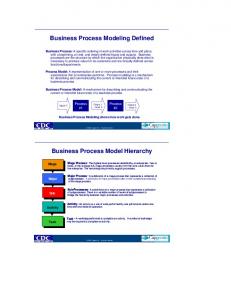
Define Measure Monitor Post. Exec. Analysis Recommend Figure 3.
Steps in Evaluation Phase
B. Evaluation and Post Execution Analysis Businesses are evaluated in order to determine whether the desired objectives are achieved or not. Different aspects of enterprise are investigated to measure the performance and achievement of overall enterprise’s objectives. The evaluation of business is carried out at different levels, like at the overall output level and process level. Different approaches are employed for this purpose like business intelligence and process mining. In this paper, we focus on the process level analysis and their representation. The steps for evaluation phase of processes are shown in the Figure 3 and discussed as follows. For the evaluation, first we need to define what we want to measure. This also involves the specification of process parts and business objects which are related with this measurement. Some processes and business objects may have a direct effect on other processes and business objects while the other may have an indirect effect. Depending on the purpose and scope of evaluation, these effects are evaluated in processes. After defining the objective and scope of evaluation, the collection of data about process and business objects is carried out. Collection of data involves querying different database tables and logs for the values of business objects and processes. In case of data collection from log files, the collected data is cleaned in order to separate system related data and business process trace data [11]. The current values of business objects are compared with the target values to measure the performance of processes and business objects. Different analytical techniques provide quantitative and qualitative results about processes and business objects, e.g., statistics and process mining [23]. Monitoring of processes and business objects is mostly used with controlling. Monitoring and controlling include measurement and analysis of processes and business objects where changes are made in real time. This is carried by defining threshold values of business objects and process to draw the attention and in response certain actions are taken related with processes and involved objects. Post execution analysis of business processes uses quantitative and qualitative results for analyses of processes and
involved objects. The performance of process and business objects are analyzed from different perspectives like control flow, organizational, and operational. In case of discrepancies between plan and target values or behavior, the deficiencies in business processes are further investigated to find out the root causes of these deficiencies. Data from previous execution are also used to see the difference of current changes and predict about the future of processes and their executions. Similarly, different methods like data mining and process mining are applied to improve the existing situation. Currently, the knowledge in post execution analysis is represented at an abstract level. Mostly, pie charts or histograms are used which do not directly connect performance information with involved objects. Most of the existing modeling methods are strongly influenced from software development [26], [5]. The graphical process models developed for information systems development have different focus and details such as transforming business needs in information technology services. The gap of understanding will occur when existing models are used for evaluation and improvement. Therefore, there is a need to fulfill this gap and provide models for process analysis and improvement. For a better support in business process improvement, knowledge should be represented along the process structure with more details within business process models. Process models with fewer details are useful for an overall picture. However, for process managers, abstract models are not enough and need more detailed representation with process models. By doing so, models provide further insights about processes and enable analysts to carry-out improvements in processes. III. R EPRESENTATIONAL C HALLENGES IN P OST E XECUTION A NALYSIS Several surveys [1], [26], [8], [21] and comparisons [6], [20], [15] discuss limitations of existing modeling languages and challenges in the business process modeling domain. Their findings show that user’s demands are not fulfilled and require further research in business process modeling
Table I B USINESS PROCESS MODELING PERSPECTIVES AND DIMENSIONS Perspectives
Business objects
Organizational
Machines, Employees, Activities, tasks, conditions Inputs, outputs, data or information
Process (control flow) Operational
Dimensions Time Idle time, processing time, operating time Parallel, sequential, start time, completion time Availability, processing time, waiting time
for post execution analysis [8]. Analysis and improvement of business processes require more details compared with simple representation for communication and understanding [1], [6]. Therefore, enrichment of business process models and new constructs are required to provide details for analysis and improvement. Focusing particularly on post execution analysis and improvement phase, the representational challenges are discussed in the following subsections. A. Environment of Business Processes Different internal and external factors are involved in execution of business processes. These factors affect the execution of business processes and therefore, important in representation. External factors like time, weather, market’s condition, and employee’s skills have a direct effect on business operations. In a recent survey of modeling techniques [20], authors found that only few modeling techniques represent a business process environment in their models using some constructs. The absence of environment factors from models makes analysis difficult for analyst to understand the execution of business processes and performance of its business objects. B. Elements and Attributes Most of the business process models do not represent business objects and their attributes involved in executions. The involved business and attributes are implicitly assumed as present before execution. Due to this reason, dependencies are implicit and do not provide details in the analysis after execution. Different articles discuss the importance of explicit representation of attributes in business process models, for instance [1], [7], [16], [3]. For example, in case of Petri nets, the presence of all involved elements is abstractly represented by the presence of a token (dot). Similarly, the rules and other assumptions are not explicitly represented in models. The representation of business objects is important for a business analyst who wants to analyze the role of a participant in execution. In [9], authors found that activities extended with attributes provide a better capability for process analysis. Incomplete representation of elements in process models is discussed in [20] where authors see it as a main hindrance for specification of rules. Based on characteristics of cases, different process structures/paths are followed during
and attribute examples Cost and other Operating cost, capacity, skill or capability, usage, work load Iterations, decisions, activity cost, flexibility Quality, stock, invoice, price, material, rejections
a execution. For example, representation of different kind of objects (like customer types gold and silver) is still missing in process models. C. Representation of Successful and Failure Paths The perspective of processes, business objects, and their executions are not fully represented in the models. For example, the path on which the most of the executions leads to failure is not represented or the path on which most of the time or cost is consumed without significant contribution is also not represented. Similarly, the path of enterprise’s best practice is also not represented. Such path representations are important for investigation of deficiencies. D. Structural Challenges of Business Process Models Restrictions of the most modeling languages are not compliant with business processes that occur in reality. For example, few modeling languages apply the structural restrictions on process models like workflow nets [22] where more than one input places are not allowed because of the complexity in formalism of modeling language for validation and verification of models. Similarly, explicit representation of other involved elements are also often avoided. Due to this, business process models do not represent the details of reality. However, in a real business process more than one starting place can occur and it requires all business elements to be represented explicitly. This question requires further investigation that how the reality should be represented in business process models. E. History Construct Business process models lack in representing the history of process instances [20], like through which particular process structure most of the instances are executed. Different annotations and lists are used to represent such information with models. For example, in a loan mortgage application, the representation of a client’s profile (his past behavior with the company and transactions) is important to take decisions. Currently, such information is not explicitly presented in models. In [20], authors find it as a main hindrance for integration and specification of rules in business process models. The specification of a history construct in a model will help the stakeholders to better understand the dependencies between activities and rules.
F. Priority of Activities In business processes, some activities are executed independently from one to another i.e., in parallel. In most cases, users want to prioritize the order of executions for efficiency and use annotations for communication in models. This is due to this reason that longer activities should be started earlier (or later depends on the situation of resources and importance), therefore, other activities would not have to wait for the completion of a previous activity. The modeling languages do not provide any constructs, therefore, separate lists or annotations are currently used for this purpose. The priority of activities has to be represented in models for planning of efficient utilization of resources. IV. C HARACTERISTICS OF AN A NALYTICAL M ODELING L ANGUAGE Efficiency and performance of business processes are measured using key performance indicators (KPIs). Similarly, when the structure followed by business processes executions has to be analyzed, then business process models are used. However, what is the case when both are required for analysis? Then, we need key performance indicators (KPIs) and models simultaneously at one place. For this reason, further investigations should be made for analytical modeling language that provides performance information within business process models. Similarly, the limitations of modeling languages discussed earlier also need to be addressed in an analytical modeling language. In the following subsections, we discuss some of the characteristics which should be included in an analytical modeling language. A. Granularity of Detail Business process models are viewed by different stakeholders and so at different levels of granularity (abstract or in detail). Executives are interested in an overall picture of business processes, thus they require a suitable abstraction of business process models whereas operational managers look for specific details of processes and their activities of their responsibility. The same situation holds in analytical data perspective. Therefore, an analytical modeling language should provide constructs to represent processes and quantitative analysis at different levels of granularity. In case of structural limitations as discussed earlier in Sect. III-D, analytical modeling language may apply limitations at an abstract level. However, at an operational level, these restrictions must be relaxed to provide further details through models. B. Context Based Representation Different stakeholders are involved in business processes and each wants to view processes in his own perspective. Context adaptive views or models are required to be built based on user demands rather than pre-built models. Such views/models can be further extended to provide better
insights into processes. Model adaptation based on its usage by stakeholders can also be considered to provide maximum flexibility to end users. For example, the profile of end-user can be maintained which stores his personal preferences (likeness, expectations) and based on these models are represented (like providing specific details and extension of attributes). C. Integration of Analytical Data and Elements with Models Attributes and business objects should be part of the models for analysis because of the reasons discussed in Sect. III-B. Explicit representation of elements with attributes values will help to understand the structural deficiencies and reasons of failure. For example, in case of certain failures, business objects and attribute values explain the reasons that why a certain failure occurred and which activity should be carried out again. Similarly, involved conditions and rules should also be explicitly specified in models. These explicit representations will provide the rationale for the decisions made in business process executions. Such extended models can also be used to provide training to new users. In this way, the new user can analyze the past executions and understand the decisions made by experienced users. D. Formalism of Analytical Modeling Language An Analytical modeling language should define business processes precisely and provides the semantics to be followed. Important representational elements should be provided, even though the formalism becomes complex or hard to define. Because the enrich representation of models will make their formalism complex, as representation of models and its formalism discussed in [19]. With the formalism, the analytical data can be automatically integrated with the business process models. E. Generic Representation of Business Processes Different models are used during business process lifecycle phases, which involves different constructs and details. These models have different focus like data models and other models. During analysis, when different models consulted back and forth then ambiguities (confusion) may arise because models are at different levels of abstraction. Post execution phase of business process analysis requires an integrated view of business processes and its elements. Therefore, the analytical modeling language should be integrated and generic in representation, so that organizational elements would have one consistent view of business processes. This also enables to understand the dependencies among processes. The generic representation of business processes will enable to extend the models with different attributes to provide different views, like extending the model with time attributes will help in performance analysis.
Legend
B. Case Study Consider a small and simplified process given in Fig. 4 where five activities are executed to manufacture a product. In this process, first the parts are collected in activity A followed by activity B and activity C which are executed in parallel. These parallel activities assemble the specific parts of product independently from one another. After completion, the quality of assembled parts is checked in activity D. If the assembled parts meet the quality requirements, then product is shipped in activity E and the process is completed. If the assembled parts do not fulfill a desired level of quality, then activity F is executed which disassembles the parts. Assuming that there is no loss during disassembly process, some part of the process has to be repeated again until desired level of quality is achieved. Therefore, activity B and activity C will be executed again. This process is modeled in the Fig. 4 using business process modeling notation (BPMN) [2]. C. Extended Representation The BPMN process model of Figure 4 is abstract for process managers. This model does not provide what kind of
Assembler 2 Assembler 1
Assembling Team
Business process modeling notation (BPMN) is a standard defined by Object Management Group (OMG) for modeling business processes. BPMN graphical notations are used as a tool for communication between business and technical users. In BPMN specifications [2], BPMN graphical notations are divided into four main categories [2]. These categories are briefly discussed as follows. 1) Flow Objects 2) Connecting Objects 3) Swimlanes 4) Artifacts. Flow objects consist of activities of processes, control structure elements (such as XOR and AND) and different events that occur during execution of a process. Connecting objects as the name suggests are used to connect the activities and other elements with each other. This core set of elements define the control flow perspective of processes. Swimlanes are used to represent the participants of a process. Artifacts are used to provide additional information like annotations, documents and groups. There are several other modeling constructs in above mentioned categories, cf., [2].
OR
End
F
Quality Inspector
A. Business Process Modeling Notation
AND
Message
A
B Quality=’unsatisfied’
C
D
Shipping Agent
In this section, first we describe the basics of business process modeling notation (BPMN) [2]. We also provide some extensions of BPMN by considering challenges and characteristics of an analytical modeling language described in previous sections. Our proposed extensions ina BPMN process model are explained with the help of a case study.
Foreman
V. A N A NALYTICAL M ODELING L ANGUAGE
Quality=’satisfied’
E
Figure 4.
Product manufacturing example using BPMN
other business objects are involved in the process. In the Figure 7, we extend the model with representation of involved objects like material and courier. Similarly, representation of involved conditions are also important for analysis and understanding. Therefore, we denote the predicate with the connecting object. Availability of analytical data and records of business objects in business process execution provide the means to compute their performances. Activities, organizational resources, and other business objects can be classified into different classes. Different computations in terms of cost and time dimension can provide this information. Analysts can define the range of values based on which different classes like efficient (optimal or low costs), normal (medium), or non optimal (high cost) are specified. We do not go into details of computation in this paper. We proposed to use Swimlanes and colors to represent these categories for providing performance related representation in a business process model. Mostly, in literature, Swimlanes (pool and lane) are used to represent process participants and their interaction during a business process. However, in our proposed notation, activities and involved elements are aligned according to classes in a particular dimension. Figure 5 shows the alignment of activities in cost dimension with three classes. In this representation, we consider only the cost of activities and assume that different events and gateways play no role in cost computation. Therefore, if a certain element is represented under a particular class, then it is only for better readability with no cost consideration. Similarly, in Figure 6, we show “activity A” according to different attributes in time dimension. This figure shows that the actual operating time would be very less but with high waiting time. For simplicity and mirror image of
High
F C
Cost
Medium
Quality=’unsatisfied’
D
Low
Quality=’satisfied’
E
[1] R. S. Aguilar-Sav´en, “Business process modelling: Review and framework,” International Journal of Production Economics, vol. 90, no. 2, pp. 129–149, July 2004.
Medium
Idle time
A
A
[2] BPMI.org and OMG, “Business Process Modeling Notation Specification, Final Adopted Specification,” OMG Headquarters, Needham, MA 02494, USA, February 2006. [3] T. R. Browning, E. Fricke, and H. Negele, “Key concepts in modeling product development processes,” Syst. Eng., vol. 9, no. 2, pp. 104–128, 2006.
Low
High Medium Low
Figure 6.
R EFERENCES
Process model representation based on costs High
Figure 5.
Operating time
B
A
describe some other characteristics of an analytical modeling language and further extend the modeling languages. A tool support for generating such extended models from an information system logs files is also planned.
[4] M. Cumberlidge, Business Process Management with JBoss jBPM: A practical guide for business analysts. Packt Publishing, 2007.
Process model in time dimension and its attributes
same activity, we have not shown different other involved activities. Moreover, different dimensions and their attributes can be mixed with one to another for further business process analysis. We recommend that only few classes should be defined for less cognitive loads of process models. Colors can be used to distinguish between different classes. In our case study, optimal is represented with green (low cost), normal is represented with yellow shade, and non optimal (high cost) is represented with red shade. Different activities or organizational resources can be colored to get the analyst attention. Similarly, connecting objects can also be colored to show the enterprise best practices or different kinds of path. In the Figure 7, we have shown the color with optimal and non-optimal process participants and activities. We also color the optimal path of execution as well as non-optimal path. Similarly, different colors can be used to indicate the effect of business objects like green for optimal cost, blue for optimal time, and red for non-optimal paths. Although, the relation of cost and time is complex, as change in one dimension affects inversely effect the other dimension as discussed in [27]. VI. S UMMARY & O UTLOOK In this paper, we have discussed the limitations of modeling language for post execution analysis. We also discussed the characteristics of an analytical modeling language for business process analysis and improvement. Based on these characteristics, we tried to extend an analytical modeling language. We explained the proposed extensions of BPMN by using a case study. In the future, we will provide a survey of modeling language in post execution analysis context. We also want to
[5] B. Curtis, M. I. Kellner, and J. Over, “Process modeling,” Communications of the ACM, vol. 35, no. 9, pp. 75–90, 1992. [6] N. Damij, “Business process modelling using diagrammatic and tabular techniques,” B.P. Mgmt. Journal, vol. 13, no. 1, pp. 70–90, 2007. [7] D. Delen, N. P. Dalal, and P. C. Benjamin, “Integrated modeling: the key to holistic understanding of the enterprise,” Commun. ACM, vol. 48, no. 4, pp. 107–112, 2005. [8] M. Indulska, J. Recker, M. Rosemann, and P. Green, “Business process modeling: Current issues and future challenges,” in CAiSE 2009, Proc., ser. LNCS, P. van Eck, J. Gordijn, and R. Wieringa, Eds., vol. 5565. Springer, 2009, pp. 501–514. [9] Z. Irani, V. Hlupic, and G. Giaglis, “Editorial: Business process reengineering: A modeling perspective,” Int. J. of Flexible Manuf. Sys., vol. 13, no. 2, pp. 99–104, Apr. 2001. [10] S. Jablonski and C. Bussler, Workflow Management: Modeling Concepts, Architecture and Implementation. International Thomson Computer Press, 1996. [11] A. Khan, A. Lodhi, V. K¨oppen, G. Kassem, and G. Saake, “Applying process mining in SOA environments,” in ServiceOriented Computing ICSOC Service Wave 2009 Workshops, ser. LNCS, A. Dan, F. Gittler, and F. Toumani, Eds. Springer, 2010, vol. 6275, pp. 293–302. [12] A. Lodhi, V. K¨oppen, and G. Saake, “Post execution analysis of business processes: Taxonomy and challenges,” University of Magdeburg, Technical Report 9, 2010. [13] A. Lodhi, V. K¨oppen, and G. Saake, “Business process improvement framework and representational support,” in Proceedings of The Third International Conference on Intelligent Human Computer Interaction (IHCI), ser. AISC. Prague, Czech Republic: Springer, August 2011. [14] A. Lodhi, V. K¨oppen, and G. Saake, “Business process modeling: Active research areas and challenges,” University of Magdeburg, Techical Report 1, 2011.
Legend
Introdu Maturit Growth Decline ctory y Stage Stage Stage Stage Total Mark et Sale s Time
Material Statistics Logistics Cost
High
material
Medium
Low
diassemble parts
A Assembler 2
F
B
Assembler 1
Assembling Team
Foreman
Quality=’unsatisfied’
C
Quality Inspector
Introducto Growth ry Stage Stage
Maturity Stage
Decline Stage
Total Marke t Sales
Shipping Agent
D
Time
Quality=’satisfied’
E packed
Figure 7.
Performance based extended model with involved business objects
[15] R. Lu and S. Sadiq, “A survey of comparative business process modeling approaches,” in BIS, Poznan, Poland, April, 2007, Proceedings, ser. LNCS, W. Abramowicz, Ed., vol. 4439. Springer, 2007, pp. 82–94. [16] A. Macintosh, “The need for enriched knowledge representation for enterprise modelling,” in Artificial Intelligence (AI) in Enterprise Modelling, IEEE Colloquium (Digest No. 078). London: IEEE Computer Society, April 1993, pp. 3/1 – 3/3. [17] K. Phalp and M. Shepperd, “Quantitative analysis of static models of processes,” Journal of Systems and Software, vol. 52, no. 2-3, pp. 105–112, June 2000. [18] K. T. Phalp, “The CAP framework for business process modelling,” Information and Software Technology, vol. 40, no. 13, pp. 731–744, November 1998. [19] J. Recker and J. Mendling, “Adequacy in process modeling: A review of measures and a proposed research agenda,” in CAiSE 2007 Workshop Proceedings, (BPMDS 2007), B. Pernici and J. A. Gull, Eds., vol. 1, Trondheim, Norway, June 2007, pp. 235–244. [20] J. Recker, M. Rosemann, M. Indulska, and P. Green, “Business process modeling: A comparative analysis,” J. of the Association for Info. Sys., vol. 10, no. 4, pp. 333–363, 2009. [21] D. R. Shaw, C. P. Holland, P. Kawalek, B. Snowdon, and B. Warboys, “Elements of a business process management
system: theory and practice,” Business Process Management Journal, vol. 13, no. 1, pp. 91–107, 2007. [22] W. van der Aalst, “The application of Petri nets to workflow management.” The Journal of Circuits, Systems and Computers, vol. 8, pp. 21–66, 1998. [23] W. van der Aalst, H. A. Reijers, A. Weijters, B. van Dongen, A. Medeiros, M. Song, and H. Verbeek, “Business process mining: An industrial application,” Information Systems, vol. 32, no. 5, pp. 713–732, 2007. [24] W. van der Aalst, A. ter Hofstede, and M. Weske, “Business process management: A survey,” in Business Process Management, ser. LNCS, W. van der Aalst, A. ter Hofstede, and M. Weske, Eds., vol. 2678. Springer, 2003, pp. 1–12. [25] W. van der Aalst and K. van Hee, Workflow Management: Models, Methods, and Systems. Massachusets , UK: MIT Press, Cambridge, 2002. [26] K. Vergidis, A. Tiwari, and B. Majeed, “Business process analysis and optimization: Beyond reengineering,” Systems, Man, and Cybernetics, Part C: Applications and Reviews, IEEE Transactions on, vol. 38, no. 1, pp. 69–82, 2008. [27] M. J. Vullers, P. Kleingeld, M. Loosschilder, and H. A. Reijers, “Performance measures to evaluate the impact of best practices.” in Proceedings of Workshops and Doctoral Consortium (BPMDS). Tapir Academic Press Trondheim, 2007, pp. 359–368.