Vol. 93, No. 4. Printed in U.S.A.. Kinetics of Lethal Adsorption of Colicin E2 ... hypothetical model that assumed a single-hit mechanism of colicin action upon a ... represented diagramatically in Fig. 1. The colicin- organism reaction mixture was ...
Vol. 93, No. 4 Printed in U.S.A.
JOURNAL OF BACrERIOLOGY, Apr., 1967, p. 1353-1359 Copyright i 1967 American Society for Microbiology
Kinetics of Lethal Adsorption of Colicin E2 by Escherichia coli R. SHANNON AmD A. J. HEDGES Public Health Laboratory, Canynge Hall, and Department of Bacteriology, The Medical School, University of Bristol, Bristol, England
Received for publication 19 December 1966
The kinetics of lethal adsorption of colicin E2 by Escherichia coli C6 were studied by means of survivor plots. These were determined by a method which allowed rapid sampling of the reaction mixture and estimation of approximate confidence limits for the plotted data. The results were consistent with the predictions of a hypothetical model that assumed a single-hit mechanism of colicin action upon a bacterial population whose cells varied in their number of specific (lethal) receptors for colicin. The possibility of nonlethal adsorption is discussed. The lethal action of colicin on sensitive bacterial cells seems to occur in two distinct phases (11): (i) an apparently irreversible adsorption to specific receptors at the cell surface; and (ii) the lethal effect proper, which occurs some measurable time after completion of phase (i). The kinetics of the adsorption phase have usually been tollowed by means of survivor plots [i.e., log (fraction of population remaining viable when removed to a colicin-free environment) versus time]. Successful interpretation of such survivor plots in terms of hypothetical models depends largely on the sufficiency and precision of the data plotted. Much previously published data may be criticized on two main grounds (5, 11, 12). First, no estimates of precision were offered; secondly, a considerable fraction of the population may have been rendered nonviable in the period between the zero-time plot and the next reading obtained, especially under conditions of high colicin concentration. These features combine to lessen confidence in the plot of the initial region of the curve: a region of crucial importance in deciding between "single-hit" and "multi-hit" hypotheses of colicin action (5). The present paper is concerned with an attempt to offer data which meet the above objections and which allow the possibility of their interpretation in terms of a specific hypothetical model. MATERIALS AND METHODS
Media. Nutrient agar was prepared from dehydrated Blood Agar Base No. 2 (Oxoid). Peptonewater was prepared from Evans peptone as described by Cruickshank (2). Bacterial strains. The colicin-sensitive strain used
in all experiments described below was Escherichia coli C6 from P. Fredericq. The colicin-producing strain was Shigella sonnei P9 (0). This is a variant of Fredericq's strain P9, which was selected on the basis of colonial morphology by E. van Horn (M.Sc. Thesis, Univ. of Bristol, Bristol, England, 1961). S. sonnei P9(0) produces large amounts of colicin E2 with only occasional traces of the thermolabile colicin I. Colicin preparation. Colicin E2 was prepared by growing S. sonnei P9 (0) in peptone-water for 36 hr at 37 C with constant agitation. The culture was held at 60 C for 20 min to inactivate traces of colicin I, filtered through a cellulose ester membrane filter (Millipore Filter Corp., Bedford, Mass.) with an approximate pore diameter of 0.45 A, and stored at 4 C. The potency of neat preparations was usually between 0.2 X 10¹² and 2.0 X 10¹² lethal units per ml. Viable cowits. Counts were made with fourfold replication by the method of Miles and Misra (9). The diluent was quarter-strength Ringer's solution
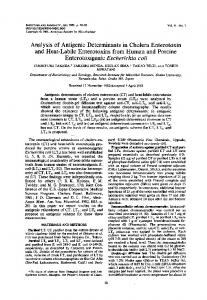
(Oxoid). Apparatus for kinetic experiments. This apparatus is represented diagramatically in Fig. 1. The colicinorganism reaction mixture was contained in a flask (A) and was kept in constant agitation by means of a magnetic stirrer (B) and rotating magnets (C). This stirring system simultaneously agitated the fluid in the water bath (D). Oxygen was admitted to the reaction flask from a cylinder (E), under the control of a screw valve (F), and the flow rate (milliliters per minute) was read from the flowmeter (G). The gas pressure caused expulsion of the reaction mixture through the delivery tube (H), such that a reading of 200 ml/min at the flowmeter corresponded to the delivery of 100 drops per min from the delivery tube when the volume of each drop was 0.06 ml. Since the volume of the delivery tube was 0.12 ml, it was completely emptied by delivery of 2 drops. The delivery tube was quickly flushed between samples by increasing the gas -flow
rate. 1353
1354
O_
SHANNON AND HEDGES
FIG. 1. Diagrammatic representation of the kinetic apparatus. (A) reaction flask, (B and C) magnetic stirrer, (D) constant-temperature water bath, (E) oxygen cylinder, (F) flow control valve, (G) flowmeter, (H) delivery tube, (I) Adams regulator (5 lb/inM), (J) cylinder pressure gauge.
Technique of kinetic experiments. A 6-hr peptonewater culture of the sensitive organism (7.5 X 10⁷ viable cells per milliliter) was placed in a water bath (Fig. 1, D) for 15 min to allow equilibration to the temperature used in the experiment. A sample of colicin was similarly treated. A 21-ml amount of the bacterial culture was placed in the reaction flask and kept in agitation. The flask was connected to the gassing device, and 16 drops were expelled from the delivery tube. The 17th drop was collected in 20 ml of diluent, and further 10-fold dilutions were made serially to a final dilution of 10-4. Single drops (volume, 0.02 ml) from each of the four 10-fold dilutions were placed on each of four nutrient agar plates. After incubation, the number of viable cells per unit volume in the reaction flask at zero-time was estimated by multiplication of the mean colony count by the appropriate dilution factor. This estimate was designated No. A 20-ml amount of the colicin sample was then added to the cell suspension in the reaction flask, and a photographic timer, fitted with a sweep second hand, was started. The delivery tube was flushed out and the dropping rate was then adjusted to 100 drops per min by means of the flowmeter. Drops were collected in 20 ml of diluent at 10-sec intervals. These suspensions were immediately diluted 1:10 to arrest colicin adsorption. Further dilutions and colony counts were made as described above. Estimates of the concentration of viable cells per unit volume in the reaction flask at the time of sampling (t) were called Nt. Population fractionation experiments. Samples of a 6-hr peptone-water culture of E. coli C6 were subjected to centrifugation for equal times but at various multiples of relative centrifugal force. The supernatant fluids were then removed, and from them were
J. BACrERioL.
prepared stained films for comparative photomicrometry. The deposits were heated at 60 C for 20 min to kill the cells while preserving the adsorbing power of their colicin receptors (8). Each supernatant fluid was then mixed with its corresponding deposit, and the reconstituted population was subjected to the technique of the kinetic experiments described above. During all manipulations the viable cells were held at 0 C. Estimation of variance of No and Nt. A broth culture of E. coli C6 was placed in the reaction flask of the kinetic apparatus. Single drops were expelled, as described above, into each of the three 20-ml volumes of diluent. From each of these were prepared three series of 10-fold dilutions to a final dilution of 10-4. Different pipettes were used at each stage of each dilution series. Single drops (volume, 0.02 ml) from each of the 36 10-fold dilutions were transferred to each of four nutrient agar plates. A separate dropping pipette was used for each dilution. After incubation, estimates of No were obtained as before. The magnitude of contributions to the variance of No estimates due to variation in sample drop size, diluting technique, and dropping pipettes was estimated by means of analysis of variance techniques. This procedure was carried out with cultures ranging in viable count from 1.58 X 10 to 7.92 X 10⁷, a range similar to that encountered in the kinetic
experiments.
RESULTS
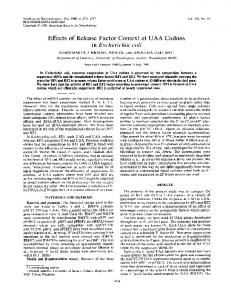
General form of survivor plots. The results of experiments with the kinetic apparatus and technique described above were plotted as log,o RI versus time, where Rt (the survivor ratio) is defined by: R, = N,/No . A large number of runs were carried out, and the data always fell into one of three main patterns, typical examples of which are presented in Fig. 2. Each plot in Fig. 2 was determined on a fresh culture of the sensitive organism, but the size of the original inoculum (No) was similar for each curve (7.5 X 10⁷ cells per milliliter). The cc 1- 0
TIME IN SECONDS
FIG. 2. Survivor plots obtained with different dilutions of colicin at 0 C. Symbols for colicin dilution: 0, 1:16; 0, 1:8; A, 1:4; A, 1:2.
KINETICS OF COLICIN ADSORPTION
VOL. 93, 1967
different plots were obtained from various dilutions of the same colicin preparation, and the water bath was held at 0 C throughout each run. Curves drawn by eye through the plotted data exhibited the following features. (i) The initial region always passed smoothly through the origin without any suggestion of a "shoulder" or point of inflexion. This feature, which agrees with the expectation of the singlehit hypotheses of colicin action (5), is examined more closely in the following section. (ii) Under conditions of either very high or very low colicin concentration, the subsequent course of the survivor plot was not suitable for further analysis. When the colicin concentration was very low, the plot soon became horizontal owing, presumably, to depletion of the free colicin by adsorption onto the bacterial cells. Under conditions of very high colicin concentration, adsorption of the lethal dose was so rapid that the survivor ratio quickly fell to levels at which the counting technique became unreliable. (iii) Between these extremes there was a region of colicin concentrations where the subsequent course of the survivor plot was linear. On the basis of the kinetic model described later, a linear plot would be expected only when colicin is present at concentrations in excess of the total available receptor sites. Such a plot is shown in Fig. 3 and is considered in more detail below. Statistical estimates ofprecision. An experiment was designed to allow statistical assessment of the contribution of various factors to the variability of estimates of No and Ni. The details of this experiment are reported earlier in this paper and the main conclusions, based on hierarchical analyses of variance of the data, were as follows. (i) The variations in both the sample drop volume and the diluting technique were insignificant compared with the variation found between colony counts on replicate plates. (ii) This last source of variation was almost constant within the range of colonies per drop used in the kinetic experiments. It was therefore possible to arrive at an approximate estimate of confidence limits appropriate to each plotted value of log Rt. If the total error in estimating Rt due to small errors in estimates of Nt and No is represented by the linear terms of Taylor series, and if these small errors are replaced by their expectations (3), we obtain Var (logl0 Rt)
0.4343 .
[Var(mt) /mt2 + Var
(mo)l/m2]
) is the variance of the bracketed where Var ( variate, and mo and mt are the mean colony
1355
-1
4
0 -J
TIME (10 sec. INTERVALS)
FIG. 3. Analysis of typical survivor plot. Solid circles indicate data obtained with 1:8 colicin at 0 C, and the parallel lines above and below the circles indicate 95% confidence limits for plotted data. The continuous curves are those predicted by the hypothetical model for populations having the' following distributions of specific (lethal) receptors per cell: A = 2, 14%; 10, 30%; 12, 50%; 15, 6%. B = 2, 14%; 4, 10%; 6, 10%; 8, 10%; 10, 10%; 12, 10%; 14, 12%; 16, 12%; 18, 12%. C = 2, 14%; 4, 20%; 8, 35%; 16, 20%; 32, 11%. D = 2, 14%; 3, 20%; 4, 14%; 5, 2%; 15, 2%; 16, 14%; 17, 20%; 18, 14%. counts obtained at time zero and time t, respectively. Because the variances appearing on the right-hand side of this equation are variances of independent sample means, it seems reasonable to suppose that the sampling characteristics of the distribution of log Rt approximate those of the normal distribution. Accordingly, 95% confidence limits for plotted values of log Rt were estimated as log Rt 4 to.o5 V\Var (log Rt) where to.o5 is Student's t for P = 0.05 with the degrees of freedom determined by the number of replicate colony counts. Estimates of Var (ml) and Var (mo) were obtained from the experimental data of Fig. 3, where the limits so calculated are shown for each value of log R,.
1356
SHANNON AND HEDGES
Examination of Fig. 3 with reference to these limits gives no cause for rejecting the hypothesis that the initial region passes smoothly through the origin without a shoulder or point of inflexion. In other words, the plot follows the course predicted by single-hit kinetic hypotheses (5). Interpretation in terms of a kinetic model. The general form of survivor plots exemplified by Fig. 3 is closely similar to that predicted by one of the hypothetical models examined by Hedges (5), which was termed "the single-hit case of the distributed receptor model." The basic assumptions made in setting up this model were: (i) each bacterial cell in the sensitive population has one or more specific (lethal) receptors for colicin; (ii) the occupation of a single (lethal) receptor by colicin is sufficient to lead to the subsequent death of the cell; (iii) the number of (lethal) receptors per cell is not uniform throughout the sensitive population; (iv) the combination of colicin with receptor is irreversible under the conditions of the kinetic experiments described in this paper; (v) cells may also have (nonlethal) receptors, the occupation of which does not lead to death of the cell, but (vi) colicin concentration is assumed to be sufficiently in excess so that adsorption to either type of receptor does not materially diminish the free colicin concentration in solution; and (vii) all (lethal) receptors are assumed to be mutually independent and equally effective in producing the lethal effect when occupied. Not only does the survivor plot predicted by this model (5) have the general form of that shown in Fig. 3, but, in particular, the ratio of its initial gradient to that of its subsequent linear region is 5/Sa, where S represents the average number of (lethal) receptors per cell, and S. , the least number of (lethal) receptors per cell in the sensitive population. Furthermore, if the linear region is extrapolated to zero-time, its point of intersection with the log Rt axis should be log fa , where f. is the fraction of the sensitive population having Sa (i.e., the least) receptors per cell. To determine what sort of distribution of receptors might, on the basis of the hypothetical model, give rise to the kinetic data shown in Fig. 3, we used the following procedure. A rough estimate of S was obtained from the experimental data of our colleague, Carolyn Shimeld. Estimates of f. and of the ratio 5/Sa were derived from a freehand curve drawn through the plotted points of Fig. 3. Four different hypothetical distributions were then drawn up, each of which possessed these estimated parameters or their equivalent. These data were
J. BACrERioL.
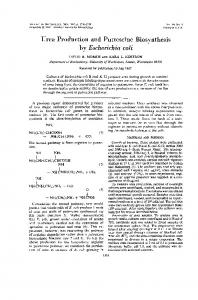
fed into a digital computer (Elliot 503) which had been programmed to compute survivor plots according to the predictions of the model. Of these four test distributions, only one gave a survivor plot which closely fitted the experimental results. The plots are shown in Fig. 3, along with details of the hypothetical distributions. The chief features of the distribution showing the best fit (curve A) were that most cells (86%) were assumed to possess numbers of receptors close to the modal value (12) but that a substantial fraction of the population (14%) possessed only onefifth of the mean number. It should be emphasized that the stated values of receptors per cell have no absolute significance but are used only in a comparative sense, since the other parameters used in computing the survivor plot were unknown. Population fractionation experiments. Although we were unable directly to determine the number of receptors on a sensitive cell, it seemed reasonable to suppose that this number might be a function of surface area. If this is so, then support for the hypothetical model might be obtained by performing survivor plots on populations of sensitive cells made progressively more homogeneous by removing larger cells from the supernatant fluid under conditions of increasing relative centrifugal force. Because we could not be certain that free colicin would be present in excess concentration during the kinetic experiments, the cells from the deposit were killed by heat under conditions found not to damage the adsorbing power of their receptors (8); these cells were then mixed with the viable cells from the supernatant fluid before addition of colicin. Under these conditions, the total adsorbing power of the population remained constant and, therefore, allowed a proper comparison of survivor plots. As part of these experiments, the distribution of cell sizes was determined in samples of the supernatant fluids as described in Materials and Methods. If a bacterial cell is assumed to be a perfect cylinder with perfectly hemispherical ends, then its surface area is ir dl, where d is the diameter, and I is the length of the cylinder. It was found that d was almost constant, so that surface area was directly proportional to 1. Several experimental runs were carried out and typical results are shown in Fig. 4. It can be seen that the survivor plots behave as would be expected if one assumes that the population of cells that remained suspended in the supematant fluid became more homogeneous with respect to receptors per cell on increasing relative centrifugal force. Histograms showing the dis-
VOL. 93, 1967
KINETICS OF COLICIN ADSORPTION
0
I
40
z
LLJ
0
a: w
-05
z Ul
wL
LUJ 40-
O0
-05
-0' LEGT
( )
TIME
30
60
IN SECONDS
LENGTH(y
FIG. 4. Data from population fractionation experiHistograms refer to frequency distributions of cell length; graphs are corresponding survivor plots. Upper set: original population; middle set: supernatant fluid after centrifugation at 1,500 X g for S min; lower set: supernatant fluid after centrifugation at 2,500 X g for S min. ments.
tribution of cells with different surface areas (represented as 1) also exhibited the expected increasing homogeneity of population. Because we do not know the exact relationship of the number of receptors per cell to the surface area, the division into groups shown in the histograms of Fig. 4 was necessarily arbitrary. However, if the first two columns of the histograms are taken to represent cells that have the least number of specific (lethal) receptors per cell (Sa), estimates are obtained for fa of 33, 43, and 78% for the successive stages of homogenization. Estimates for fa obtained from the corresponding survivor plots (see preceding section) are 48, 43, and ca. 100%. In view of the un-
1357
certainty involved in this comparison, the measure of agreement obtained was encouraging. Moreover, the histograms indicated a distribution of cell areas in the original population with the majority of cells having values close to the modal value; this feature characterized the hypothetical distribution of specific (lethal) receptors per cell discussed in the preceding section. DIscussIoN One of the problems posed by studies on lethal adsorption of bacteriocins by sensitive cells is reconciliation of the apparently single-hit kinetics indicated by survivor plots (5, 11) with reports that at LD50 the number of molecules adsorbed to a single cell may be in excess of 100 (6). The problem is made more acute by the suggestion that, at least in some cases, only a single molecule of bacteriocin is required to occupy a receptor (11). In view of the ambiguity of much of the published kinetic data (11, 12), it seemed that the first step in attempting to answer this problem should be critical examination of survivor-plot data to establish whether, after all, a multi-hit mechanism might be involved, as suggested by Fredericq and Delcour (4). It is now reasonably certain that at least two stages are involved in lethal adsorption: (i) an apparently irreversible attachment of the lethal dose to specific receptor(s) on, or near, the cell surface; (ii) the lethal effect proper, which follows only upon continued cell metabolism (13). The survivor plot as usually determined is concerned only with the first stage, since cells are removed to a bacteriocin-free environment at the sampling time t and are then allowed to metabolize. The survivor plot therefore indicates the fraction of the population that has received a lethal dose (but has not necessarily succumbed to its action) at time t. On the basis of these observations, Hedges (5) proposed a number of simple models which differed in two main respects: (i) the distribution pattern of specific (lethal) receptors among cells of the sensitive population; (ii) the number of such receptors per cell required to bind the lethal dose (i.e., multiplicity of hit). Predicted survivor plots were computed for each of the models, and it was shown that, ideally, it was possible to distinguish between some, but not all, of these models on the basis of their survivor plots. An unequivocal distinction could be made, however, only if the data were sufficiently precise and if the initial region of the plot could be drawn with sufficient confidence to exclude presence of a shoulder.
1358
SHANNON AND HEDGES
Accordingly, the present investigation was undertaken with a method which allowed (i) rapid sampling of the reaction mixture, and (ii) estimation of approximate confidence limits for the plotted data. The survivor plots obtained were entirely consistent with the predictions of one of the models examined by Hedges (5) and described in Results. The two chief features of this model are: (i) the number of specific (lethal) receptors per cell is not constant throughout the sensitive population; (ii) only one of a cell's receptors must be hit to deliver the lethal dose of bacteriocin (i.e., the kinetics are of the singlehit type). It can be seen from the original paper (5) that, if it is supposed that the majority of cells in a sensitive population require some multiplicity of hit to produce the lethal effect, then a shoulder is always produced in the initial region of the survivor plot. The extent of this shoulder depends on many factors, but the predictions of the various models examined show that the minimal value of the intercept produced by extrapolation of the subsequent part of the plot past the shoulder to zero-time is unlikely to be less than log s [s = mean value of specific (lethal) receptors per cell]. Examination of Fig. 3 shows that, if we missed an initial shoulder by using 10-sec sampling intervals, the value of any possible intercept obtained on extrapolation would indicate s to be much less than the value of 10 indicated as a minimum by results obtained in this laboratory. Therefore, we are confident that the survivor plot passes smoothly through the origin and is consistent with that predicted by assumption of single-hit kinetics. It should, perhaps, be stressed that the close fit observed between experimental data and the predictions of the model (Fig. 3) in no way proves the truth of the model. It is, indeed, possible to generate curves similar to those predicted by Hedges (5) by starting from quite different assumptions. For example, if one supposes a lognormal distribution of resistance to bacteriocin among the population of sensitive cells, irrespective of the multiplicity of hit, a family of survivor plots may be generated by assuming various numerical values for mean 'resistance' and its variance (see 15). Again, similar curves may be obtained by assuming that a reversible, ineffective adsorption competes with the lethal attachment (see 1). It is here that the population fractionation experiments have relevance. The experimental results show that, as the sensitive population became more homogeneous with respect to cell
J. BACTERIOL.
size, the corresponding survivor plots tended towards a straight line which had a gradient approaching that of the final region shown by the original heterogeneous population. Two factors likely to be correlated with cell size are: (i) number of specific (lethal) receptors per cell; (ii) degree of resistance to colicin, when it is assumed that small cells are most likely to be young cells. The second possibility, which would require young cells to have a higher resistance to colicin than that of older cells, is rendered unlikely as an explanation of the data when considered in conjunction with evidence of the two-stage nature of lethal adsorption (13), irreversibility of the specific (lethal) attachment (10), and the apparently superficial site of bacteriocin action (7). In other words, any apparent heterogeneity in resistance is more likely to be a reflection of difference in the number of specific (lethal) receptors per cell. We are therefore faced with the original problem: why should a cell which, on the basis of kinetic studies, requires only a single lethal hit adsorb a large number of molecules at LD5o (assuming the latter to be generally applicable). Various possible explanations of this discrepancy have been discussed by Reeves (11), one of which is that not all receptors are equally likely to lead to cell death on being hit. This possibility raises the question of whether bacteriocins may be bound, irreversibly or reversibly, to sites other than those which we have called specific (lethal) receptors. Under conditions of excess bacteriocin concentration, this nonlethal binding would not be expected to influence the form of survivor plot (5) but would, of course, influence the number of bacteriocin molecules bound to a cell at any instant of time. Such nonspecific, or nonlethal, binding could explain the observations of Smarda (14) that colicin El is adsorbed by Staphylococcus aureus, and that saturation by colicin E2 interferes with binding of colicin D, although the specific (lethal) receptors for these colicins are quite different. The authors propose to study this possibility in future work. ACKNOWLEDGMENTS We wish to thank H. R. Cayton, Director of the Public Health Laboratory (Bristol), for granting us facilities to carry out the experimental work; Norman Bishop and John Edwards for technical assistance; and Jack Washer for preparation of the figures. We express our gratitude to Anna Mayr-Harting for her infectious enthusiasm concerning all aspects of the study of bacteriocins.
VOL. 93, 1967
KINETICS OF COLICIN ADSORPTION
LITERATURE CITED 1. CHRISTENSEN, J. R. 1965. The kinetics of reversible and irreversible attachment of bacteriophage Ti. Virology 26:727-737. 2. CRUICKSHANK, R. 1965. Medical microbiology, 11th ed., p. 745. E. & S. Livingstone Ltd., Edinburgh. 3. DEMING, W. E. 1948. Statistical adjustment of data, p. 39. John Wiley & Sons, Inc., New York. 4. FREDERICQ, P., AND G. DELCOUR. 1953. Sur la cinetique de l'action bactericide des colicines E et K. Compt. Rend. 147:1310-1313. 5. HEDGES, A. J. 1966. An examination of single-hit and multi-hit hypotheses in relation to the possible kinetics of colicin adsorption. J. Theoret. Biol. 11:383-410. 6. HOLLAND, I. B. 1961. The purification and properties of megacin, a bacteriocin from Bacillus megaterium. Biochem. J. 78:641-648. 7. MAEDA, A., AND M. NOMURA. 1966. Interaction of colicins with bacterial cells. I. Studies with radioactive colicins. J. Bacteriol. 91:685-694.
1359
8. MAYR-HARTING, A. 1964. The adsorption of colicine. J. Pathol. Bacteriol. 87:255-266. 9. MILES, A. A., AND E. M. MISRA. 1938. The estimation of the bacteriocidal power of the blood. J. Hyg. 38:732-749. 10. NOMURA, M. 1964. Mechanism of action of colicines. Proc. Natl. Acad. Sci. U.S. 52:15141521. 11. REEVES, P. 1965. The bacteriocins. Bacteriol. Rev. 29:24-45. 12. REEVES, P. 1965. The adsorption and kinetics of killing by colicin CA42-E2. Australian J. Exptl. Biol. Med. Sci. 43:191-200. 13. REYNOLDS, B. L., AND P. REEVES. 1963. Some observations on the mode of action of colicin F. Biochem. Biophys. Res. Commun. 11:140145. 14. SMARDA, J. 1966. Some problems of the immediate action of colicines on susceptible bacteria. Antimicrob. Agents and Chemotherapy1965, p. 345-348. 15. VAs, K., AND G. PROSZT. 1957. Observations on the heat destruction of spores of Bacillus cereus. J. Appl. Bacteriol. 21:431-441.