Vol. 12 no. 6 1996 Pages 507-510
CABIOS
LALNVIEW: a graphical viewer for pairwise sequence alignments Laurent Duret, Elisabeth Gasteiger and Guy Perriere1 Abstract
Introduction The detection of similarities with other sequences is often the first step in the identification of relevant features in a new nucleic acids or protein sequence. Many different programs have been developed to search for similarities between biological sequences. Generally, the results are displayed as a 'sequence alignment' in text format. This textual representation is sufficient to analyse similarities between sequences that can be aligned over their entire length. However, in many cases, it is not possible to display a global alignment, e.g. when comparing sequences sharing only discrete regions of similarity, sequences containing internal repeats, or recombined sequences (e.g. mRNA vs. genomic, alternatively spliced transcripts, etc.). In such cases, it is necessary to use local similarity search algorithms. Such searches produce lists of local alignments that are all the more difficult to analyse as the sequences are longer and the repeats more numerous. Another solution to display similarities between Department of Medical Biochemistry, University of Geneva, I rue Michel Servet, CH-1211 Geneva 4, Switzerland and ' Laboratoire de Biometrie. Genitique et Biologie des Populations, UMR 5558 CNRS. Universite Claude Bernard, 43 Bd du 11 Novembre 1918, 69622 Villeurbanne cedex, France E-mail:
[email protected]
© Oxford University Press
System and methods LALNVIEW was written in ANSI C using the SUIT (Simple User Interface Toolkit) library (Conway, 1992). LALNVIEW runs on UNIX workstations (SUN SPARC, Silicon Graphics, DEC Alpha, IBM RS/6000, HP), Macintosh, PC and compatibles, and requires a colour screen. Calculation of local alignments LALNVIEW does not calculate the alignments itself: it uses the output of local alignment programs. LALNVIEW is able to read alignments from three widely used software: LFASTA, LALIGN and SIM. LFASTA uses the FASTA heuristic to find local regions of similarity between two sequences quickly (Pearson and Lipman, 1988). SIM and LALIGN are two different implementations of the rigorous algorithm of Huang and Miller (1991) (LALIGN is distributed by William Pearson along with the FASTA package). The Huang and Miller algorithm guarantees to find the iV-best local alignments between two sequences. Its main drawback is that it is much slower than LFASTA (> 100-fold slower for the comparison of two sequences of 3000 residues each). If sequences are relatively short (< 1000 residues) or if calculation time is not limiting, then the Huang and Miller algorithm should be preferred to LFASTA.
507
Downloaded from bioinformatics.oxfordjournals.org by guest on July 12, 2011
LALNVIEW is a graphical program for visualising local alignments between two sequences (protein or nucleic acids). Sequences are represented by coloured rectangles to give an overall picture of their similarities. LALNVIEW can display sequence features (exon, intron, active site, domain, propeptide, etc.) along with the alignment. When using LALNVIEW through our Web servers, sequence features are automatically extracted from database annotations (SWISS-PROT, GenBank, EMBL or HO VERG EN) and displayed with the alignment. LALNVIEW is a useful tool for analysing pairwise sequence alignments and for making the link between sequence homology and what is known about the structure or function of sequences. LALNVIEW executables for UNIX, Macintosh and PC computers are freely available from our server (http:// expasy.hcuge.chlsprotllalnview.html).
two sequences is to use graphical dot-plots. Dot-plot representation is efficient to give an overall picture of discrete and/or repeated regions of similarity between sequences, and some excellent tools have recently been developed (e.g. Schwartz et al., 1991, Sonnhammer and Durbin, 1995). However, in some cases, a linear representation of local similarities between sequences is clearer and easier to interpret than the bidimensional dot-plot representation. We present here a new tool intended to give a global picture of local similarities between two aligned sequences: LALNVIEW (Local ALigNment VIEWer). By giving an overall view of the similarities encountered between two sequences, LALNVIEW provides an efficient aid to their interpretation.
L.Duret, E.Gasteiger and G.Perriere
Intron
Blocks of similarity \
Bum
\
' 'V
\ Nothi
tajnviewij)
SIMILARITY SCALE
20*
30% 40%\50%
60% 70% 80% 90% 100% Identity 0 5000
Features
ttWWWH
Fugu_DHST_gene
Human_DHST_gene Features 5000
10000
20000
15000
Fug U_DHST 83 8 CATTTTCCCTTCTGGTACCTCAGCTGCT GCCGAGGCTGCTCC Human_DHST 11635 CATATACTTTTCTTGTTTTTCAGCTGCTCCTGCTAAGGCCAAGCCGGCTGAAGCTCCTGC
F ug U_DHST 880 TTCCTCAGTCACAGAACCGGTGACTGCAGCCCCTCCTCCTCCTCCTCCTCCTGTTTCAGC Human_DHST 11695 TGCTGCAGCCCCAAAAGCAGAACCTACAGCAGCGGCAGTTCCTCCCCCTGCAGCACCCAT * •
• •* * ** • * * *
• * • •»*
*
*
****** *** * *
*
rfe. 2« R
ZOOM
!d«ntit\
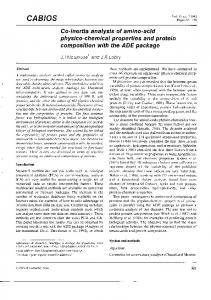
SaneAKgnmaste i Beeinve Faatuns | Fig. 1. Comparison of the human dihydrohpoamide succinyltransferase (DHST) gene with its homologue from the tish h. rubipes (CienBank accession numbers D26535 and U40758). Genomic sequences were aligned with SIM, using default parameters. Green boxes in the feature lines correspond to protein-coding regions.
Sequence alignment display Sequences are represented by coloured rectangles to give an overall picture of their similarities. Blocks of similarity between the two sequences are coloured according to the degree of identity between the two segments (Figure 1). LALNVIEW displays all the local alignments with a similarity score greater than a given threshold value. This threshold can be changed by the user to find the best compromise between sensitivity and selectivity and thus increase the signal/noise ratio. By clicking on a block, the user can align the two
sequences according to this anchor point and visualise the corresponding local alignment (textual format) in a second window (Figure 1). A given block (or domain) may be repeated several times in a sequence (Figure 2). Iterative clicking on one block allows the user to successively display all the similar blocks that occur in the other sequence. Output facilities The user can save in a text file the alignments that have been considered as significant. He can also save the picture
EGF-Vkc domain 100 i i
200
300
400
500
Features FA9_HUMAN
EGF_H0MAN L
Features
c 600
700
800
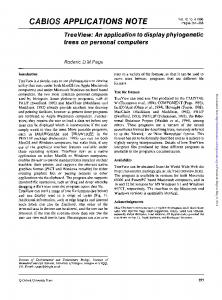
Fig. 2. Comparison of human epidermal growth factor (EFG) and coagulation factor IX proteins (SWISS-PROT accession numbers P01133 and P00740). Protein sequences were aligned with SIM, using the matrix BLOSUM65. Brown boxes in the feature lines correspond to EGF-like domains.
508
Downloaded from bioinformatics.oxfordjournals.org by guest on July 12, 2011
FugU_DHST 9 4 0 CCXICACTGCTATGCCTTCAGTGCCCCCAGTGCCGACACAGGCTCTCCAGGCCAAACCAGG Human DHST 1 1 7 5 5 ACCCACTCAGATGCCACCGGTGCCCTC GCCCTCACAGCCTCCTTCTGGCAAACCTGG
LALNVIEW: a viewer for pairwise sequence alignment
of the sequence alignment as it appears on the screen. It is stored in PostScript format, suitable for printing. Graphical display of sequence features information LALNVIEW is also able to display sequence features (active site, domain, motif, propeptide, intron, exon, promoter, etc.) along with the alignment. This option is useful because it allows one to make the link between sequence similarity and what is known about the structure or the function of a sequence. These sequence features are schematically represented by coloured boxes. By clicking on a box, the user can access a short text giving information on this particular sequence (Figure 2). Using LALNVIEW
through the Web
Figures 1 and 2 give two examples of applications of LALNVIEW. Figure 1 displays the comparison of the human dihydrolipoamide succinyltransferase (DHST) gene with its homologue from the fish Fugu rubripes. This figure shows that during the evolution of this gene, only the protein-coding regions, but not the introns, have remained conserved. It also demonstrates that the Fugu DHST gene is much more compact than its human homologue, due to shorter introns. Figure 2 displays the comparison of human epidermial growth factor (EGF) with coagulation factor IX. Regions of similarity between the two proteins correspond to EGFlike domains that are repeated nine and two times, respectively, in EGF and factor IX proteins. In both examples, it is clearly not possible to compute a global alignment between the two sequences, and hence, it is necessary to use a local alignment search software. The two main features of LALNVIEW are: (i) to allow the user to visualise in a single picture all the regions of similarities between the two sequences and to inspect all the local alignments; (ii) to give, along with the alignment, a graphical representation of what is known about the structure of this sequence (positions of exons, introns, regulatory elements, active sites, domains etc.). The advantage of using LALNVIEW through the ExPASy and WWW-Query Web servers is that sequence information is automatically extracted from the annotations available in databases. Thus, when comparing a new sequence to an already known one, LALNVIEW displays all the information necessary for the interpretations of their similarities.
Comparison with existing software Different programs have been recently developed to display local sequence similarities using dot-plots (e.g. LAD/LAV: Schwartz et al., 1991; DOTTER: Sonnhammer and Durbin, 1995). However, as already mentioned, a linear representation is sometimes preferable to a dot-plot. The Macaw program (Schuler et al., 1991) uses boxes and lines to give a linear representation of sequence similarities. It has the advantage over LALNVIEW to be able to display multiple sequence alignments, and not only pairwise alignments. However, this program is not available for UNIX computers and, unlike LALNVIEW, LAD/LAV or DOTTER, does not allow one to display sequence features. Indeed, the main originality of LALNVIEW is the automatic display of sequence features, as implemented on our Web servers. To ensure that everyone can take advantage of this facility, LALNVIEW is
509
Downloaded from bioinformatics.oxfordjournals.org by guest on July 12, 2011
We have implemented SIM on the ExPASy Web server (Appel et al., 1994) and LFASTA on the WWW-Query Web server (Perriere and Thioulouse, 1996). The pages allowing the use these programs can be accessed at URLs: http:/expasy.hcuge.ch/sprot/sim-prot.html and http://acnuc.univ-lyonl.fr/lfasta.html The user can either provide sequences or accession numbers of sequences from one of the following databases: SWISSPROT or TREMBL (Bairoch and Apweiler, 1996), GenBank (Benson et al., 1996), EMBL (RodriguezTome et al., 1996) or HOVERGEN (Duret et al., 1994). Thus the user can compute the alignments on one of these two servers and analyse the results on his local computer with LALNVIEW. The user can declare LALNVIEW as a helper application for his Web Browser (with the MIME type: chemical/x-aln2). This allows the alignment to be automatically displayed with LALNVIEW from the Web Browser. These Web servers not only provide the alignments, but also sequence features extracted from the annotations available in databases. Automatic extraction of annotations from nucleic sequence databases is not trivial because information relative to one gene can be dispersed in several entries of the database. For example, it is frequent to find genes for which only the exons, but not the introns, have been sequenced. In such cases, each exon corresponds to one entry in the database, but the description of sequence features (protein coding region, transcribed regions, etc.) is given only in one of these entries (generally the one corresponding to the last exon). To solve this problem, we have used the ACNUC sequence database management system (Gouy et al., 1985) that easily handles information relative to sequence structure (location of intron/exon boundaries, of coding regions, etc.) and allows one to retrieve the relationships between sequences corresponding to different parts of the same locus.
Discussion
L.Duret, E.Gastelger and G.Perriere
supported for UNIX, Macintosh and PC computers, whereas the programs cited above are available for only one platform. Availability
LALNVIEW executables are available by anonymous FTP (expasy.hcuge.ch/pub/lalnview), World Wide Web (ftp://expasy.hcuge/ch/pub/lalnview) or by sending an e-mail to
[email protected]. Acknowledgements We thank the Glaxo Institute for Molecular Biology (Geneva) for hardware and software support. Many thanks to Nicolas Guex and Anne Danckaert for their help in porting LALNVIEW to Mac and PC, and to Amos Bairoch for his suggestions. This work was supported by a FEBS long terra fellowship to L.D.
References
Received on April II. 1996; revised on July 17. 1996, accepted on Julv 22, 1996
510
Downloaded from bioinformatics.oxfordjournals.org by guest on July 12, 2011
Appel.R.D., Bairoch,A. and Hochstrasser,D.F. (1994) A new generation of information retrieval tools for biologists; the example of the ExPASy WWW server. Trends Biochem. Sci., 19, 258-260. Bairoch.A. and Apwriler.R. (1996) The SWISS-PROT protein sequence data bank and its new supplement TREMBL. Nucleic Acids Res., 24, 21-25. Benson.D.A., Boguski,M., Lipraan,D.J. and OstellJ. (1996) GenBank. Nucleic Acids Res., 24, 1-5. Conway.M.J. (1992) Suit: The Simple Interface Toolkit Version 2.3 Reference Manual. University of Virginia, Charlottesville, VA, 162pp. Duret.L., Mouchiroud.D. and Gouy.M. (1994) HOVERGEN: a database of homologous vertebrate genes. Nucleic Acids Res., 22, 2360-2365. Gouy.M., Gautier,C.,Attimonelli,M.,Lanave,C and Di Paola.G (1985) ACNUC—a portable retrieval system for nucleic acid sequence databases: logical and physical designs and usage. Comput. Applic. Biosci., 1, 167-172. Huang.X. and Miller.W. (1991) A time-efficient, linear-space local similarity algorithm. Adv. App. Math., 12, 337-357. Pearson,W.R. and Lipman.D.J. (1988) Improved tools for biological sequence comparison. Proc. Natl. Acad. Sci. USA, 85, 2444-2448. Perriere.G. and ThioulouseJ. (1996) On-line tools for sequence retrieval and multivariate statistics in molecular biology, Comput. Applic. Biosci., 12, 63-69. Rodriguez-Tome,P., Stoehr,PJ., Cameron.G.N. and Flores.T.P. (1996) The European Bioinformatics Institute (EBI). Nucleic Acids Res., 24, 6-12. Schuler,G.D., Altschul.S.F. and Lipman.D.J. (1991) A workbench for multiple alignments construction and analysis. Proteins, 9, 180-190. Schwartz,S., Miller,W., Yang.C.M. and Hardison,R.C. (1991) Software tools for analysing pairwise alignments of long sequences. Nucleic Acids Res., 19, 4663-4667. Sonnhammer.E.L.L. and Durbin.R. (1995) A dot-matrix program with dynamic threshold control suited for genomic DNA and protein sequence analysis. Gene, 167, GC1-10.