Appears in ACM SIGCSE Technical Symposium on Computer Science Education (SIGCSE ’99), Copyright ACM,
Cache Conscious Programming in Undergraduate Computer Science Alvin R. Lebeck Department of Computer Science Duke University Durham, North Carolina 27708 USA
[email protected] Abstract The wide-spread use of microprocessor based systems that utilize cache memory to alleviate excessively long DRAM access times introduces a new dimension in the quest to obtain good program performance. To fully exploit the performance potential of these fast processors, programmers must reason about their program’s cache performance. Heretofore, this topic has been restricted to the supercomputer, multiprocessor, and academic research community. It is now time to introduce this topic into undergraduate computer science curriculum. As part of the CURIOUS project at Duke University, we are in the initial stages of incorporating cache performance issues into an undergraduate course on software design and implementation. Specifically, we are introducing students to the notion of a cache profile that maps cache behavior to source lines and data structures, and providing a cache profiler that can be used along with other performance debugging tools. In the end, we hope to produce cache conscious programmers that are able to exploit the full performance potential of today’s computers. 1 Introduction As VLSI technology improvements continue to widen the gap between processor and main memory cycle times, cache performance becomes increasingly important to overall system performance. Cache memories help alleviate the cycle time disparity, but only for programs that exhibit sufficient spatial and temporal locality. Programs with unruly access patterns spend much of their time transferring data to and from the cache. To fully exploit the This work supported in part by NSF-CDA-9634475 and NSF CAREER Award MIP-97-02547, DARPA Grant DABT63-98-1-0001, NSF Grants CDA-97-2637 and CDA-95-12356, Duke University. .
performance potential of fast processors, programmers must explicitly consider cache behavior, restructuring their codes to increase locality. As fast processors proliferate, techniques for improving cache performance must move beyond the supercomputer, multiprocessor, and academic research communities and into the mainstream of computing. To expedite this transfer of knowledge, as part of the CURIOUS (Center for Undergraduate education and Research: Integration thrOUgh performance and viSualization) project at Duke we are introducing undergraduate students to the concept of a cache profile—a mapping of cache performance to source code, similar to an execution time profile. To accomplish this, we are incorporating CProf [8], a cache profiler, into an undergraduate course on software design and implementation. The potential benefits of CProf were established in previous work [8] that examined some of the techniques that programmers can use to improve cache performance. We showed how to use CProf to identify cache performance bottlenecks and gain insight into their origin. This insight helps programmers understand which of the well-known program transformations are likely to improve cache performance. Using CProf and a “cookbook” of simple transformations, our previous studies showed how to tune the cache performance of six of the SPEC92 [40] benchmarks. By restructuring the source code, we greatly improve cache behavior and achieve execution time speedups ranging from 1.02 to 3.46. Our previous efforts to introduce cache profiling into mainstream computing were successful—CProf has been distributed to over 100 sites worldwide. In addition, many of our results were included in a graduate level textbook on computer architecture [3]. However, those efforts were focussed on experienced programmers, and now we must concentrate on novice programmers. By educating undergraduate computer scientists about the benefits of programming for locality, we hope to produce a steady stream of cache conscious programmers ready to excel in the fastpaced, competitive software industry. The remainder of this paper outlines the steps necessary to introduce undergraduates to the potential advantages of reasoning about their programs’ cache behavior, and is organized as follows. The first step, Section 2, is to pro-
vide an overview of cache operation. This is followed, in Section 3, by a presentation of a cache profile, and how it differs from a traditional execution time profile. We then describe CProf, our cache profiler, in Section 4. The lesson on programming for locality culminates (Section 5) when students are able to use CProf as an additional tool for analyzing their program’s performance. Section 6 concludes this paper. 2 The Basics of Cache Memory It is essential that students understand the basic operation of caches, and fully appreciate the disparity between cache access times and main memory access times. This section provides an overview of a simple one-level cache memory hierarchy. This material can be used as the basis for lecturing on the fundamental aspects of cache operation. Cache memories [12] sit between the (fast) processor and (slow, inexpensive) main memory, and hold regions of recently referenced main memory. References satisfied by the cache—called hits—proceed at processor speed; those unsatisfied—called misses—incur a cache miss penalty to fetch the corresponding data from main memory. Today’s processors have clock cycle times of a few nanoseconds, while main memory (DRAM) typically has a minimum 60ns access time. In this scenario, each cache miss could introduce an additional 30 cycle delay. We note that this miss penalty is optimistic for today’s computers. Caches work because most programs exhibit significant locality. Temporal locality exists when a program references the same memory location multiple times in a short period. Caches exploit temporal locality by retaining recently referenced data. Spatial locality occurs when the program accesses memory locations close to those it has recently accessed. Caches exploit spatial locality by fetching multiple contiguous words—a cache block—whenever a miss occurs. Caches are generally characterized by three parameters: associativity (A), block size (B), and capacity (C). Capacity and block size are in units of the minimum memory access size (usually one byte). A cache can hold a maximum of C bytes. However, due to physical constraints, the cache is divided into cache frames of size B that contain a cache block. The associativity A specifies the number of different frames in which a memory block can reside. If a block can reside in any frame (i.e, A = C/B), the cache is said to be fully associative; if A = 1, the cache is directmapped; otherwise, the cache is A-way set associative. Because of finite cache size and limited associativity, the computation order and data layout of an application can have significant impact on the effectiveness of a particular cache. We can use the above three parameters (A,B,C) to reason about cache behavior, similar to the way
asymptotic analysis is performed. Assume that a specific element of an array, Y(i), requires b bytes of linear memory storage, and that all bytes of the array must be accessed. In this case, each element occupies b/B cache blocks, and the application will incur a minimum of b/B cache misses. The number of cache misses increases if the computation order is unable to reuse Y(i) while it is in the cache. Consider an application that is simply required to multiply each element of array a[k] by the corresponding element of array b[k]. Then the corresponding element of array c[k] is added to the result, which is stored back into array a. There are two different ways to implement this application. First, we can use two separate loops: one that computes a[k] = a[k] * b[k], followed by one that computes a[k] = a[k] + c[k], as shown below. for (k = a[k] for (k = a[k]
0; k < = a[k] 0; k < = a[k]
size; k++) * b[k]; size; k++) + c[k];
Alternatively, we can use one loop that performs all allowable computations on each element, as shown below. for (k = 0; k < size; k++) { a[k] = a[k]*b[k] + c[k]; } Although the arithmetic complexity of these two code segments is equivalent, the second version produces approximately a 9% speedup over the first version on a 300Mhz Sun Ultra10 workstation1. A potential second source of additional cache misses is a result of limited associativity. For example, in a directmapped cache when two distinct elements Y(i) and Y(j) needed simultaneously by the computation map to the same cache frame. In the above examples, if the arrays are allocated contiguously and are a multiple of the cache size, then the cache blocks containing the kth element of each array map to the same cache frame. Since the cache is direct-mapped, it can contain only one of the cache blocks, and it cannot exploit the spatial locality in the access patterns to the various arrays. The above examples are generally sufficient for students to understand cache behavior and how it impacts program performance. The next step is to provide students 1. These numbers were obtained for size = 500,000 and each code segment executed 10 times. The programs are compiled with gcc and optimization level -O2.
with the tools necessary to analyze the cache performance of large programs. 3 A Cache Profile Like asymptotic analysis, mentally simulating cache performance is effective for certain algorithms, however analyzing large complex programs is very difficult. Instead of performing asymptotic analysis on entire programs, programmers often rely on an execution-time profile to isolate problematic code sections, and then apply asymptotic analysis only on those sections. Unfortunately, traditional execution-time profiling tools, e.g., gprof [2] are generally insufficient to identify cache performance problems. For the first code sequence in the above example, an execution-time profile would identify the source lines as a bottleneck. The programmer might erroneously conclude that the floating-point operations were responsible, when in fact, the program is suffering unnecessary cache misses. In this case, programmers can benefit from a profile that focuses specifically on a program’s cache behavior [8,1,11,10], identifying problematic code sections and data structures. A simple cache profile that annotates source lines with the number of cache misses it incurs is certainly beneficial. However, for students to learn various techniques for improving their programs’ performance, a cache profile should also provide insight into the cause of cache misses. This insight can then help a programmer determine appropriate program transformations to improve performance. A cache profile can provide this insight by classifying misses into one of three categories [4]1: 1. A compulsory miss is caused by the first reference to a memory block. These can be eliminated by prefetching either with explicit instructions or implicitly by packing more data into a single cache block. 2. A reference that is not a compulsory miss but misses in a fully-associative cache with LRU replacement is classified as a capacity miss. Capacity misses are caused by referencing more memory blocks than can fit in the cache. Programmers can reduce capacity misses by restructuring the program to re-use blocks while they are in cache. 3. A reference that hits in a fully-associative cache but misses in an A-way set-associative cache is classified as a conflict miss. A conflict miss to block X indicates 1. Hill defines compulsory, capacity, and conflict misses in terms of miss ratios. When generalizing this concept to individual cache misses, we must introduce anti-conflict misses which is a miss in a fully-associative cache with LRU replacement but a hit in an A-way set-associative cache. Anti-conflict misses are generally only useful for understanding the rare cases when a set-associative cache performs better than a fully-associative cache of the same capacity.
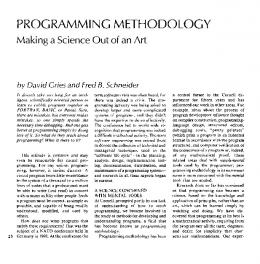
that block X has been referenced in the recent past, since it is contained in the fully-associative cache, but at least A other memory blocks that map to the same cache set have been accessed since the last reference to block X. Eliminating conflict misses requires transforming the program to change either the memory allocation and/or layout of the two arrays (so that contemporaneous accesses do not compete for the same sets) or the manner in which the arrays are accessed. These miss types provide insight because program transformations can be classified by the type of cache misses they eliminate. Conflict misses can be reduced by array merging, padding and aligning structures, structure and array packing, and loop interchange [11]. The first three techniques change the allocation of data structures [7,6], whereas loop interchange modifies the order that data structures are referenced. Capacity misses can be eliminated by program transformations that reuse data before it is displaced from the cache, such as loop fusion [11] (as done in the previous example), blocking [5, 11], structure and array packing, and loop interchange. 4 CProf: Another Tool in the Toolbox This section provides an overview of the CProf implementation, and how it provides insight for improving cache performance. More details on CProf can be found in our original paper [8]. CProf is composed of a cache simulator and a user interface. As part of CURIOUS, we reimplemented CProf’s user interface using Java, leveraging object oriented design, and providing machine independence. The user interface reads files generated by the cache simulator. Currently, CProf uses Fast-Cache [9] on SPARC processors—the same machines used by undergraduates for most computer science courses at Duke—to perform cache simulation. We plan to implement the necessary simulators on other platforms in the future. The cache simulator produces a detailed list of cache misses per source line and data structure. The cache misses are categorized into compulsory, capacity, and conflict. Figure 1 shows the CProf user interface. It is composed of three sections: the top section displays source files annotated with the corresponding number of cache misses per source line. The middle section displays either a list of source lines or data structures, sorted in descending order by number of cache misses. The bottom section refines the cache misses for a given source line or data structure into its constituent components. Figure 1 corresponds to an actual cache profile obtained from the split loop example described in Section 2. From CProf we see that two source lines account for 90% of the cache misses. Furthermore we see that these source lines are incurring capacity misses. This tells us that we should try to reuse data while it is in the
Figure 1: CProf User Interface cache. By examining the requirements of the application, we can determine that the two separate loops can be fused together, allowing us to perform all operations on each element of array a before moving to the next element. Typically, users will sort the source lines, and select one of them which causes the corresponding source file to appear in the top section, and the miss classifications to appear in the bottom section. Further selection of a specific miss type in the bottom section displays cache miss information for the data structures referenced in the initially selected source line. A similar cross-link between data structures and source lines exists.
5 Using CProf in a Course The previous sections outlined the steps necessary to make students aware of cache behavior as a potential performance inhibitor, and introduce them to a few techniques for improving their program’s cache behavior. Those sections achieve the primary goal of this paper: educating undergraduate programmers that cache performance can have a significant effect on overall program performance. I believe that discussions of program cache behavior should occur in many undergraduate courses, including computer architecture, algorithms, and numerical analysis. However, our initial emphasis is on incorporating the concept of programming for locality into an undergraduate course on software design and implementa-
tion. The primary focus of the course is on techniques for the design and construction of reliable, maintainable and useful software systems. The subtopics include programming paradigms and tools for medium to large projects. For example, revision control, UNIX tools, performance analysis, GUIs, software engineering, testing, and documentation. Typically, students are given the description of a desired application and are required to first develop a functionally correct implementation, and second to performance tune their implementation. Cache profiling enters into the curriculum during performance analysis. We plan to follow the steps outlined in sections 2-4 by first ensuring that students have an adequate understanding of caches and how their behavior can affect their program’s performance. To achieve this, we plan to use one lecture reviewing/discussing basic cache operation, similar to the material covered in Section 2. To further facilitate this discussion, as part of the CURIOUS project, we are also developing tools for visualizing cache operation. This discussion will also emphasize the impact of cache performance on overall performance, and can include other examples, such as cache conscious heap allocation. The second step is to introduce cache profiling as an additional performance debugging tool. This requires an overview of the tool and a demonstration of its use. If necessary, students can be required to complete a short programming assignment using CProf. At this point, students are ready to performance tune their programs. Some students may write cache friendly programs based only on the discussions of cache performance. Other students program’s may require extensive analysis using CProf to achieve good cache performance. The goal is not to force students to use CProf, but rather to encourage them to reason about their program’s cache behavior and provide CProf as another option in their performance debugging toolbox. 6 Conclusion As processor cycle times continue to decrease faster than main memory cycle times, memory hierarchy performance becomes increasingly important. This paper argues that undergraduates should be trained to consider the impact of cache behavior on their program’s overall performance. As part of the CURIOUS project in the Computer Science Department at Duke University, we are making initial efforts to achieve this goal. Our approach is to incorporate cache profiling into an undergraduate course on software design and implementation. By explaining the potential pitfalls of ignoring cache performance, and providing students with a cache profiler as an additional tool in their performance toolbox, we hope to produce cache conscious programmers that are able to
write programs that exploit the enormous computing potential of today’s microprocessor based computers. 7 Acknowledgements I would like to thank Kelly Shaw for porting the CProf GUI to Java, also Susan Rodger, Owen Astrachan, Mike Fulkerson and the anonymous reviewers for comments on this paper. 8 References [1]
Aaron J. Goldberg and John L. Hennessy. Mtool: An Integrated System for Performance Debugging Shared Memory Multiprocessor Applications. IEEE Transactions on Parallel and Distributed Systems, 4(1):28–40, January 1993. [2] Susan L. Graham, Peter B. Kessler, and Marshall K. McKusick. gprof: A Call Graph Execution Profiler. ACM SIGPLAN Notices, 17(6):120–126, June 1982. Proceedings of the SIGPLAN ’82 Conference on Programming Language Design and Implementation. [3] John L. Hennessy and David A. Patterson. Computer Architecture: A Quantitative Approach. Morgan Kaufmann, 2 edition, 1995. [4] Mark D. Hill and Alan J. Smith. Evaluating Associativity in CPU Caches. IEEE Transactions on Computers, C38(12):1612–1630, December 1989. [5] Monica S. Lam, Edward E. Rothberg, and Michael E. Wolf. The Cache Performance and Optimizations of Blocked Algorithms. In Proceedings of the Fourth International Conference on Architectural Support for Programming Languages and Operating Systems (ASPLOS IV), pages 63–74, April 1991. [6] Anthony LaMarca and Richard E. Ladner. The Influence of Caches on the Performance of Heaps. The ACM Journal of Experimental Algorithmics, 1:Article 4, 1996. Also available as Technical Report UW CSE TR# 96-02-03. [7] Anthony LaMarca and Richard E. Ladner. The Influence of Caches on the Performance of Sorting. In Eighth Symposium on Discrete Algorithms (SODA), pages 370–379, January 1997. [8] Alvin R. Lebeck and David A. Wood. Cache Profiling and the SPEC Benchmarks: A Case Study. IEEE COMPUTER, 27(10):15–26, October 1994. [9] Alvin R. Lebeck and David A. Wood. Active Memory: A New Abstraction for Memory System Simulation. ACM Transactions on Modeling and Computer Simulation (TOMACS) an extended version of a paper that appeared in Proceedings of the 1995 ACM Sigmetrics Conference on Measurement and Modeling of Computer Systems., 7(1):42–77, Jan 1997. [10] M. Martonosi, A. Gupta, and T. Anderson. MemSpy: Analyzing Memory System Bottlenecks in Programs. In Proceedings of the 1992 ACM SIGMETRICS Conference on Measurement and Modeling of Computer Systems, pages 1–12, June 1992. [11] A. K. Porterfield. Software Methods for Improvement of Cache Performance on Supercomputer Applications. PhD thesis, Rice University, May 1989. Also available as Rice COMP TR 89-93. [12] Alan J. Smith. Cache Memories. ACM Computing Surveys, 14(3):473–530, 1982.