BENCHMARKS
BENCHMARKS CalcDalton: a tool for multiplex genotyping primer design for single-base extension reactions using cleavable primers Holger Kirsten, Steffen Dienst, Frank Emmrich, and Peter Ahnert University of Leipzig, Leipzig, Germany BioTechniques 40:158-162 (February 2006) doi 10.2144/000112115
Matrix-assisted laser desorption/ ionization time-of-flight mass spectrometry (MALDI-TOF MS) is now one of the most automated and efficient single nucleotide polymorphism (SNP) detection methods. It delivers highly accurate results with exceptional reliability (1). However, one problem in MALDI-TOF MS nucleic acid detection arises from the negatively charged sugar phosphate backbone leading to adducts with cations. Established methods to overcome this problem include cleavage of the genotyping primer at a specific site. The site is defined by incorporating a cleavable linker within the primer during synthesis. Various linker chemistries exist (2–4), and depending on the type of linker, cleavage can occur by photo-optical or chemical means. This releases a smaller product for measurement with a decreased number of charges. Additionally, analysis of smaller fragments increases sensitivity, resolution, and accuracy in mass spectrometry (5). Several methods using this approach have been described (2–4). Another advantage of cleavable sites is the possibility to flexibly space the signals of primers and primer extension products in MALDI-TOF MS detection. The size of the fragments to be detected is directly related to the position of the cleavable linker. Higher multiplexing of genotyping reactions increases throughput and cuts down costs. Determination of optimal linker positions—especially for higher multiplex numbers—is simple in principle but cumbersome and daunting in practice, due to the many parameters to be considered. These include resolution and mass range of the MALDI-TOF MS device, adducts 158 BioTechniques
of fragments with cations, matrix effects, and preferred usage order of the photolinkers. To our knowledge, up until now, no software tool is available to make this challenge amenable to the user. We have developed a Java™based program called CalcDalton. The aim of CalcDalton is to identify optimized linker positions in a set of primers and to assign these to appropriate multiplexes. The program is entirely written in Java 1.4 and available via Java WebStart at www.uni-leipzig. de/~ahnert/calcdalton.htm. It is distributed under the GNU public license. Minimum requirements are an installed Java Runtime Environment of at least version 1.4 (www.java.com). The program was tested under Linux, Microsoft® Windows 98, 2000, and XP. The design applies the JGoodies Looks package (www.jgoodies.com/freeware/ looks), and the graphical output is generated using the JFreeChart package (www.jfree.org/jfreechart/index.php). A help document with detailed explanations of all functions and sample data and settings can be found at www.unileipzig.de/~ahnert/calcdalton.htm and also as supplementary material available online at www.BioTechniques.com. The program has an easily and intuitively usable graphical interface (Figure 1A). The user can specify the applied cleavable linker, maximum and minimum mass ranges of the MALDI-TOF MS device, and excluded mass ranges (e.g., important for mass ranges where matrix signals are expected to occur). The resolution of the instrument is taken into account by the specification of a minimal peak distance. To avoid interference with cationic adducts, excluded distances
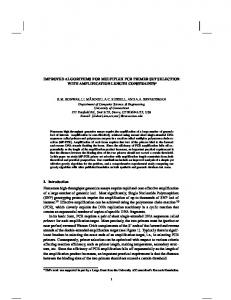
between peaks can be defined. The available mass range can be used more efficiently by allowing the MALDITOF MS signals of the primers, but not of the genotyping products, to be within excluded peak distances. A favored usage order of linker positions, as well as predefined fixed linker positions, can be specified. Preconfigured settings make the choice between three previously published types of assays (2–4) with different cleavable primers more convenient. Figure 1B shows the overlay of a mass spectrometry trace from the measurement of an 11-plex with the predictions for the same 11plex. Since absolute masses are used in the prediction, the calculated results are accurately reflecting the measurements to within the accuracy limits of the mass spectrometer. Concrete peak heights and individual genotypes are not predicted by CalcDalton. CalcDalton is designed to first attempt to find an optimal linker position assignment in which all primers can be included in one multiplex. This is done by testing all possible linker assignments via brute force. Internally, CalcDalton is performing a depth-first traversal of the solution tree (6). Branches of the solution tree are pruned if these subtrees represent worse solutions than those already identified. In comparison to a standard brute force algorithm without pruning, this strategy decreases calculation time. Multiple optimized solutions are presented to the user. They are equal in respect to the favored photolinker order. To allow inspection of the suitability of the solutions, all mass differences occurring in a solution are displayed in a table, and a preview of the corresponding MALDI-TOF mass spectrum is generated. Given certain settings, it is sometimes not possible to include all primers in a single multiplex. CalcDalton will then seek a solution where all primers can be included in a minimal number of multiplexes. The underlying problem in achieving this goal is equivalent to partitioning a graph into a minimal number of disjoint cliques (7). In the graph, vertices represent possible primers, and connecting edges represent incompatibilities between them. Partitioning such a graph is a so-called NP-complete problem; Vol. 40, No. 2 (2006)
no known algorithms provide exact solutions in a justifiable time scale for more complex problem instances (8). To deal with this problem, we apply exact algorithms with restricted central processing unit (CPU) calculation times, leading to approximate solutions. The user can choose between two algorithms to place all primers in a minimal number of multiplexes. In the first approach, the reverse of the entire graph is generated, and a maximum clique algorithm (9) separates this reverse graph. In the second approach,
a standard naive force graph coloring algorithm (7), acting on the original graph, is applied. Which algorithm gives the best results depends on the number and properties of the primers and the user defined settings. Best results may be obtained by choosing the algorithm empirically. The performance of CalcDalton may be judged from the task of assigning the primers for 60 randomly chosen SNPs to a minimum number of multiplexes. Under Microsoft Windows 2000, running on a machine with an
AMD Sempron 2400+ processor and 512MB RAM, default settings, and the maximum clique algorithm, approximately 10 min are needed to find the solution for assigning the 60 primers into four multiplexes (7–22 primers per multiplex). If the calculation time was limited to 5 min, a solution with five multiplexes (1–22 primers each) was found. Dividing the same 60 primers into two sets of 30, it takes about 1 min to assign each set into two multiplexes (11 and 19 primers each). When the graph-coloring algorithm was applied to the same task as above and under the same conditions, only solutions with larger numbers of multiplexes were obtained. However, for different sets of primers and settings, the graphcoloring algorithm may give better results. In principle, the number of primers and the size of multiplexes are not limited. The quality of the results depends on the settings required by the user, the performance of the computer, the properties of the primers, and the preset calculation time. In our hands, CalcDalton saves substantial amounts of time in designing linker positions, allows higher multiplexing, and facilitates the inclusion of existing primers in new multiplexes. ACKNOWLEDGMENTS
Figure 1. Screenshot of CalcDalton software and comparison with real data. (A) Input and output screens for the determination of positions for cleavable linkers in genotyping primers are shown. Primer sequence information is loaded or typed into the input mask. Expected genotypes and fixed linker positions may be specified. Pressing the Calculate button generates the Result window showing one of several possible solutions with all expected and possible products. To get an intuitive grasp of the results, a table of all mass differences (Diffs for result 1) and a graphical representation of the expected mass spectrum (MALDI Preview) can be generated. Short peaks (below 1000 rel. units) in the graph indicate the positions of cation adducts. (B) A comparison of the graphical representation of the calculated masses with a real mass spectrum is shown. The mass spectrum resulted from the genotyping of 11 homo- or heterozygous loci using primers with photocleavable linkers. For details of the 11-plex, please refer to www.uni-leipzig.de/~ahnert/cdhelp.pdf. rel units, relative units. Vol. 40, No. 2 (2006)
We thank Anke Steiner and Grit Wolfram for the CalcDalton-based design and preparation of the 11-plex and Drs. Markus Kostrzewa and Kristina Fahr from Bruker Daltonics for very helpful advice on general design issues of cleavable primers. This project was supported by grant no. 7692/1187 from the Saechsische Aufbaubank–Förderbank, by grant no. 4212/04-04 from the European Fund for Regional Development (EFRE), and by the Hochschul- und Wissenschaftsprogramm of the German Federal Ministry for Education and Research. COMPETING INTERESTS STATEMENT
The authors declare no competing interests. BioTechniques 159
BENCHMARKS REFERENCES 1. Tost, J. and I.G. Gut. 2005. Genotyping single nucleotide polymorphisms by MALDI mass spectrometry in clinical applications. Clin. Biochem. 38:335-350. 2. Wenzel T., T. Elssner, K. Fahr, J. Bimmler, S. Richter, I. Thomas, and M. Kostrzewa. 2003. Genosnip: SNP genotyping by MALDITOF MS using photocleavable oligonucleotides. Nucleosides Nucleotides Nucleic Acids 22:1579-1581. 3. Shchepinov, M.S., M.F. Denissenko, K.J. Smylie, R.J. Worl, A.L. Leppin, C.R. Cantor, and C.P. Rodi. 2001. Matrixinduced fragmentation of P3′-N5′ phosphoramidate-containing DNA: highthroughput MALDI-TOF analysis of genomic sequence polymorphisms. Nucleic Acids Res. 29:3864-3872. 4. Li, J., J.M. Butler, Y. Tan, H. Lin, S. Royer, L. Ohler, T.A. Shaler, J. Hunter, et al. 1999. Single nucleotide polymorphism determination using primer extension and timeof-flight mass spectrometry. Electrophoresis 20:1258-1265. 5. Pusch, W., J.H. Wurmbach, H. Thiele, and M. Kostrzewa. 2002. MALDI-TOF mass spectrometry-based SNP genotyping. Pharmacogenomics 3:537-548. 6. Cooper, S.B. 2004. Computability Theory. Chapman & Hall/CRC Press, Boca Raton. 7. West, D.B. 2001. Introduction to Graph Theory, 2nd ed. Prentice Hall, Upper Saddle River, NJ. 8. Garey, M.R. and D.S. Johnson. 1979. Computers and Intractability: A Guide to the Theory of NP-Completeness. W.H. Freeman, San Francisco. 9. Coudert, O. 1997. Exact coloring of reallife graphs is easy. Proceedings of the 34th Annual Conference on Design Automation. June 1997, p.121-126.
Received 21 September 2005; accepted 5 December 2005. Address correspondence to Peter Ahnert, University of Leipzig, Faculty of Medicine, IKIT/BBZ, Center for Biotechnology and Biomedicine, Johannisallee 30, 04103 Leipzig, Germany. e-mail: peter.
[email protected]
To purchase reprints of this article, contact
[email protected]
160 BioTechniques
Vol. 40, No. 2 (2006)