Florida International University, Department of Construction Management, Miami, Florida 33174 ... level was then correlated to the typical project cost and schedule results that these organizations ... firms; 10 information systems (IS) firms; and 3 high-tech manufacturing (HTM) companies. ... its industry class or otherwise.
Calculating Project Management’s Return on Investment C. William Ibbs, University of California, Department of Civil and Environmental Engineering, Berkeley, California 94720 USA
Young H. Kwak, Florida International University, Department of Construction Management, Miami, Florida 33174 USA
Abstract This paper describes a procedure that can help managers measure their return on investment for project management (PM/ROI). Current PM processes and practices of 38 different companies and government agencies in 4 different industries or application areas were quantitatively examined. A PM benchmarking procedure was developed and used to assess the PM process maturity of these different organizations. A 5-level Berkeley PM process maturity model is introduced. This information is used to measure the relative sophistication and maturity of different organizations and industries. Keywords: return on investment; benchmarking; maturity model
PM has been very popular in corporate America during the past decade, with specific PM techniques and practices of organizations growing increasingly sophisticated. The advantages of this particular management style have led many organizations to projectize their operations. PM tools and practices appeal to companies in many industries and application areas because they offer real help in meeting today’s timeto-market, highly competitive business environment. At the same time, senior managers are beginning to demand that the investment in PM tools, systems, and practices, what we call the PM Return on Investment (PM/ROI), be justified financially. Research literature reveals very little objective and reliable information on this subject. Many of these publications are personal estimates by the authors of PM/ROI, and are presented in a qualitative and anecdotal manner (AlSedairy, 1994; Boznak, 1988; Bu-Bushait, 1989; CII, 1990; Cleland, 1993; Deutsch, 1991; Gross & Price, 1990; Kerzner, 1987; Ziomek & Meneghin, 1984). Others discuss the productivity impact of applying a projectdriven organizational structure and do not really address many of the other benefits of PM (Donnelly & Kezsbom, 1993; Gobeli & Larson, 1986; Larson & Gobeli, 1989; Lundin & Soderholm, 1994; McCollum & Sherman, 1991; Might & Fischer, 1985). Yet, neither of these two groups of studies really answers the important question of how to estimate PM/ROI (McFarlin, 1995). The principal goal of this study was to develop a tool for measuring the financial benefits that organizations might incur from implementing new or enhancing existing PM tools, processes, and practices. As a starting point, the authors benchmarked organizations in terms of their PM maturity. This PM maturity level was then correlated to the typical project cost and schedule results that these organizations experienced. For the purposes of this paper, PM maturity is defined as the level of sophistication of an organization’s current PM practices and processes. This is not to say that an organization must use the most advanced PM techniques on every project. Rather, it describes how broad ranging an organization’s existing PM toolkit is.
Such information will help managers better understand and respond to queries from top management about the cost effectiveness of PM. It will also help them make more prudent PM investment decisions. This paper is one of a series of articles that the authors have written for Project Management Journal and PM Network. It focuses on the calculation procedure developed to measure ROI. Other articles describe in more detail the benchmark results.
Study Scope This study views PM in broad industry and applications terms. After careful consideration, the authors decided to investigate PM processes, procedures, and systems in four different industries and application areas: 15 engineering-construction (E-C) companies; 10 information management and movement (IMM) firms; 10 information systems (IS) firms; and 3 high-tech manufacturing (HTM) companies. One of these organizations was a public agency; the others were for-profit companies. The study was empirical. Both private- and public-sector organizations were examined. PM processes were normally investigated at a department level from the perspective of a manager of project managers.
Research Methodology PM Processes and PM Knowledge Areas In this study, PM is defined as the application of knowledge, skills, tools, and techniques to project activities in order to meet or exceed stakeholders’ needs and expectations from a project. A Guide to the Project Management Body of Knowledge (PMBOK® Exposure Draft) (Project Management Institute Standards (PMI) Committee, 1994) was used as a reference. An additional PM process called the ProjectDriven Organization Environment was added, which supports sustaining project-driven organizations. These six PM processes and eight PM knowledge areas were used as the basis of the benchmarking tool (see Figure 1). Project Lifecycle Phases
Initiate
Define & Organize
Track & Manage
Plan
Project-Driven Organization Environment
Close Out
ZOOM IN
PMBOK
Scope Management
Time Management
Cost Management
Quality Management
Human Resource Management
Figure 1. Benchmarked PM Phases and Knowledge Areas
Communication Management
Risk Management
Procurement Management
Research Hypothesis The study hypothesis was: Hypothesis H0: There is a positive correlation between an organization’s PM maturity level and its actual project performance. There are other important quantitative relationships related to the benefit of PM, but the authors believed that this particular hypothesis was testable and represented the principal objective of the study.
Berkeley PM Process Maturity Model To better understand an organization’s PM sophistication, this research developed and applied a fivelevel PM process maturity model. The objective of developing the Berkeley PM Process Maturity Model was to pinpoint an organization’s current PM maturity level. This Model was developed by adapting work from Crosby (1979), SEI (1993), McCauley (1993), and Microframe (1997). This Model illustrates a series of steps to help an organization incrementally improve overall PM effectiveness. Each level of the Model subdivides PM processes and practices into the eight knowledge areas and six PM processes shown in Figure 1. This allows an organization to determine PM strengths and to focus only on the weak areas to achieve higher PM maturity. Figure 2 presents an overview of the Model.
Sustained level 5 Integrated level 4 Managed level 3
Planned level 2 Ad-hoc level 1
Continuous PM Process Improvement
Integrated Multi-Project Planning and Control
Systematic Project Planning and Control
Individual Project Planning
Basic PM Process
Figure 2. Berkeley PM Process Maturity Model The Model evolves from a functionally driven organization to a project-driven organization. Use of the Model allows determination and positioning of any organization’s maturity relative to other organizations in its industry class or otherwise. It consists of major characteristics, factors, and processes. The primary purpose of the Model is for use as a reference point or a yardstick for an organization applying PM processes. It can lead to suggestions about an organization’s application expertise and its use of technology, or produce recommendations on how to hire, motivate, and retain competent staff. It can also
provide and guide necessary processes and requirements for what is needed to achieve a higher maturity level. Level 1: Ad-Hoc Stage At the Ad-Hoc Stage, there are no formal procedures or plans to execute a project. The project activities are poorly defined and cost estimates are inferior. PM-related data collection and analysis are not conducted in a systematic manner. Processes are unpredictable and poorly controlled. There are no formal steps or guidelines to ensure PM processes and practices. As a result, utilization of PM tools and techniques is inconsistent and applied irregularly, if at all, even though individual project managers may be very competent. Level 2: Planned Stage At the Planned Stage, informal and incomplete processes are used to manage a project. Some of the PM problems are identified, but these problems are not documented or corrected. PM-related data collection and analysis are informally conducted but not documented. PM processes are partially recognized and controlled by project managers. Nevertheless, planning and management of projects depend largely on individuals. An organization at Level 2 is more team oriented than at Level 1. The project team understands the project’s basic commitments. This organization possesses strength in doing similar and repeatable work. However, when the organization is presented with new or unfamiliar projects, it confronts major chaos in managing and controlling the project. Level 2 PM processes are efficient for individual project planning, but not for controlling the project or any portfolio of projects. Level 3: Managed Stage At the Managed Stage, PM processes become more robust and demonstrate both systematic planning and control characteristics. Most of the problems regarding PM are identified and informally documented for project control purposes. PM-related data are collected across the organization for project planning and control. Various types of analyzed trend data are shared by the project team to help it work together as an integrated unit throughout the duration of the project. This type of organization works hard to integrate cross-functional teams to form a project team. Level 4: Integrated Stage At the Integrated Stage, PM processes are formal, with information and processes being documented. The Level 4 organization can plan, manage, integrate, and control multiple projects efficiently. PM processes are well defined, quantitatively measured, understood, and executed. PM process data are standardized, collected, and stored in a database to evaluate and analyze the process effectively. Also, collected data are used to anticipate and prevent adverse productivity or quality impacts. This allows an organization to establish a foundation for fact-based decision-making. In addition to effectively conducting multiple project planning and control, the organization exhibits a strong sense of teamwork within each project and across projects. PM training is fully planned and is provided to the entire organization, according to the respective role of project team members. Integrated PM processes are fully implemented at this level. Level 5: Sustained Stage Companies at the Sustained Stage continuously improve their PM processes using, for instance, formal lessons-learned programs. Problems associated with applying PM are fully understood and addressed on an ongoing basis to ensure project success. PM data are collected automatically to identify the weakest process elements. These data are then rigorously analyzed and evaluated to select and improve the PM processes. Innovative ideas are also vigorously pursued, tested, and organized to improve processes.
Organizations at Level 5 are involved in the continuous improvement of PM processes and practices. Each project team member spends effort to maintain and sustain the project-driven environment. Project teams are dynamic, energetic, and fluid in a Level 5 project-centric organization. Discussion of the Model With this Model, an organization evolves from a less PM-sophisticated organization to a highly projectoriented organization. This does not necessarily mean that at Level N+1, all the characteristics of Level N are fully implemented. Rather, at Level N+1, an organization has the capability to choose the proper and eligible PM practices or tools that are suitable for a given project. For example, assume that scheduling techniques evolve from drawing simple bar charts to developing project network diagrams, to conducting a complex simulation for resource optimization. An organization that has a high PM level does not always have to conduct expensive simulation or resource leveling to find an optimal schedule and resources using highly sophisticated PM tools. At a higher PM level, an organization can apply eligible sets of PM processes and requirements based on the nature or complexity of a project. That is why we referred to “broad ranging an organization’s PM toolkit” earlier in the paper. Benchmarking Tool The next step of the research was to develop a rigorous and comprehensive PM benchmarking methodology, which could be used to assess and evaluate maturity of PM processes and practices among different industries. The benchmarking methodology made use of a very comprehensive and detailed questionnaire for data collection. Integrated Project Systems (IPS), an established PM consulting firm based in San Carlos, CA, donated its benchmarking questionnaire (IPS, 1995; McCauley, 1993). The researchers at the University of California at Berkley reviewed and amended it to fit the needs of the study. The three-part PM benchmarking tool was used to effectively and efficiently collect information about the company’s general organizational and sales profile, its PM maturity level, and cost and schedule performance from one of its recent representative projects. The tool enabled the capture of the essence of an organization’s PM processes. The PM maturity levels are defined as a 1 to 5 Likert scale, with a 1 being the lowest level of PM maturity and a 5 being the highest level. Some of the information collected in Part 1 included organizational information such as its size, product focus, and years of PM practice. Part 2 consisted of 148 multiple-choice questions. Its intent was to measure the maturity of the organization’s standard PM processes. An example of the detail and rigor of each question is illustrated in Figure 3.
Question #56: How is a schedule’s critical path identified? No critical path calculation done. Each sub-project identifies critical tasks independently and sets work priorities……...…...……………………………….………..…………….1 Critical path based on committed milestone dates. No CPM calculation performed, or CPM used on individual sub-projects..………………….………………………..…..………..2 Key critical tasks identified through non-quantifiable means, and used to drive the critical path calculation………...………………………...………………….…………………..3 Critical path calculated through integrated schedule, but only key milestone dates communicated back to sub-projects…………………………..………………………….4 All critical tasks identified and indicated in each individual sub-project schedule. Critical path determined through integrated schedule...……..……………………………..…….5 Figure 3. Example of Part 2 Multiple-Choice Process Maturity Questions To calculate the overall PM maturity, the average score of all 148 questions was computed for each company. An important, underlying assumption is that, since all questions were weighted equally, they contributed equally to the organization’s process maturity. In reality, there might be questions that are more important for one company or industry than another, but the authors did not feel that there was a basis to make that judgment. By eliminating variable weighting factors for each question, this study achieved nonbias circumstances to specific variables.
Benchmarking Overall PM Maturity Thirty-eight, large international companies from four industries participated in the study. Overall PM maturity ranged from a low of 3.1 for IS to a high of 3.4 for E-C, with an average for all companies of 3.3. Since the rating scale ranged from 1 to 5, there was still a substantial opportunity for improvement of PM practices for all four industries. The results are presented and discussed in more detail in other articles (Ibbs & Kwak, 1997a; Ibbs & Kwak, 1997b; Ibbs & Kwak, 1998; Kwak, 1997; Kwak & Ibbs, 2000). Further details are shown in Tables 1 and 2.
PM Knowledge Areas Scope Time Cost Quality Human Resources Communications Risk Procurement Overall PM Knowledge Areas Maturity
E-C 3.53 3.6 3.7 2.9 3.2 3.5 2.9 3.3 3.3
IMM 3.5 3.4 3.2 3.2 3.2 3.5 2.9 3.0 3.2
Table 1. PM Maturity of the Eight Knowledge Areas
IS 3.3 3.0 3.2 2.9 2.9 3.2 2.7 2.9 3.0
HTM 3.4 3.5 4.0 3.3 3.2 3.5 2.8 3.3 3.4
All Companies 3.4 3.8 3.5 3.1 3.1 3.4 2.9 3.1 3.2
PM Processes Initiating Maturity Planning Maturity Executing Maturity Controlling Maturity Closing Maturity Project-driven Org. Environment Maturity Overall Average PM Processes Maturity
E-C 3.6 3.6 3.3 3.6 3.3 3.1
IM M 3.3 3.5 3.3 3.3 3.4 3.0
3.4
3.3
IS
All Companies
3.6 3.4 2.9 3.0 2.9 2.7
HT M 3.6 3.6 3.3 3.3 3.1 3.3
3.1
3.3
3.3
3.4 3.5 3.2 3.3 3.2 3.0
Table 2. PM Maturity of the Six Processes In general, IS had the lowest PM Maturity score and E-C had the highest. HTM’s overall PM results should be deemphasized, though, because the sample size was small. To complement and substantiate analysis of the data, a series of lengthy, detailed interviews were conducted with representatives of the organizations that participated in the study. Generally those interviewed were “managers of project managers.”
Project Performance Results Performance Definitions Project cost and schedule data were collected from Part 3 of the benchmarking tool. Project cost is divided into two parts: direct and indirect costs. Direct costs are the cost of resources required to conduct a project, including labor, material, and equipment. Indirect costs are the amortization of the overhead costs associated with completing a project. These include clerical, utility, administrative, and miscellaneous expenses. The quotient of original budget and actual cost was used to calculate the cost index (CI). Project performance indexes were used to assess the cost and schedule performances on the project considered to be representative of the company being benchmarked. The CI and schedule index (SI) are defined in Equations 1 and 2.
Cost Index, CI=
Schedule Index, SI=
Actual Project Costs Original Budget
Actual Project Duration Original Project Duration
Note that CI and SI are different from the PMBOK® Guide Exposure Draft’s (PMI Standards Committee, 1994) cost performance index (CPI) and the schedule performance index (SPI). In this study, a project finishing under budget or ahead of schedule would have a CI or SI < 1. The original estimate or schedule values were those set at the time of official project authorization.
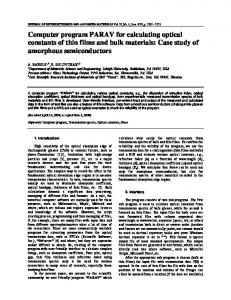
Not all 38 participating organizations provided useful project performance data. Some would not disclose information because they treat it confidential. Others stated that they do not collect and store schedule and cost information in the form that was requested for this study, or they do not maintain an archive for such information. Only 17 organizations provided cost information, and 15 organizations provided schedule information. The small sample size impeded the data analysis. Of course, there is a possibility that companies will select projects that reflects well on their performance, and we were sensitive to this possible bias. However, we stressed to these companies that the study would only be as good as the data that they provided. We believe that the data provided is good data. Regression Analysis Regression analysis was used to find the best-fit line between an organization’s PM maturity and its actual representative project performance. Microsoft Excel was used to test for regressions among linear, logarithmic, power, and exponential functions. In this study, the highest R2 regression model was selected among these four different functions to find a best-fit regression line. R2 is the coefficient of determination, which is a measure of the goodness fit of a regression model. It measures the strength of the correlation between the given data and the regression. A value of 1.00 indicates that the given data and the regression correlate perfectly; a value of 0.00 indicates that there is no correlation whatsoever. PM Maturity Versus CI and Versus SI Figure 4 illustrates the quantitative statistical relationship between the overall PM maturity for these organizations and their CIs. The heavier line is the best-fit regression equation, and the two lighter-colored lines are the +/– 10% control limits. The upper and lower control limit lines are intended to convey the sense that an envelope, rather than a precise relationship, exists between the variables of PM maturity and cost performance. Though the data do not show a strong relationship (the R2 = 0.2337 is not statistically significant), possibly because of the small sample size, they are still interesting and useful. The equation in the diagram, y = -1.4701Ln(x) + 2.9099, is the computed regression line. 3.5 CI
3
CI
2.5
10% -10%
y = -1.4701Ln(x) + 2.9099 R2 = 0.2337
2
Best Fit Line
1.5
1 0
0.5
1
1.5
2
2.5
3
0.5
0
Overall PM Maturity
Figure 4. PM Maturity versus CI (n = 17)
3.5
4
4.5
5
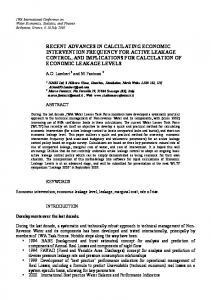
Figure 5 portrays the statistical relationship between the overall PM maturity level for 15 organizations and their SIs. As before, the heavier line is the best-fit regression equation, and the two lighter-colored lines are the +/- 10% control limits. This relationship is somewhat stronger than that for the CI, but still not statistically significant. (The R2 = 0.4922 is too low.) SI 5 4.5 4 3.5 SI 3
10%
y = 7.5992x -1.5494 R2 = 0.4922
2.5
-10% Best Fit Line
2 1.5 1 0
0.5
1
1.5
2
2.5
3
3.5
4
4.5
5
0.5 0
Overall PM Maturity
Figure 5. PM Maturity Versus SI (n = 15) Several observations can be made about these two curves: • Neither of the relationships were statistically significant. Part of the reason may be the scarcity of data points, 17 for CI and 15 for SI. However, these figures clearly show that there are some positive tendencies between higher PM maturity levels and better CI or better SI. It is always difficult to obtain statistically significant results in research on managerial issues. The general tendencies determined in these figures are at least reassuring, because they don’t refute the hypothesis. • The slopes of the curves indicate that higher levels of PM maturity are associated with better cost and schedule performance on projects. This encourages an ever-increasing projectizing of operations and maturity of PM teams. Even if outlying data points are excluded, a nonlinear downward-sloping curve is still the best fit, thus reaffirming this key point. • The nonlinearity of the functions (y = –1.4701Ln(x) + 2.9099 and y = 7.5992 x–1.5494) indicates that there are diminishing returns on higher levels of PM maturity. Even if outlying, anomalistic data points are excluded, then the curves are still nonlinear and downward sloping. This last point is especially important because it suggests that there is such a thing as too much PM maturity. • There are two outliers in both Figures 4 and 5. Though there is no sound, technical reason to exclude them from the analysis, the authors did so and found that the general shape of the curve for Figure 4 was still nonlinear and sloping downward. So the conclusions about CI-PM maturity are still relevant. On the other hand, eliminating the two outliers in Figure 5 leads to a regression fit that essentially overlaps the horizontal axis of the figure. In other words, most of the projects were driven to finish on schedule. Looking at Figures 4 and 5 together, it’s concluded that, in general, companies are allowing project expenditures to overrun budgets in order to meet schedule. As a parenthetical note, an important distinction exists between construction contractors and other types of firms when referring to “project cost.” Construction contractors are usually working in a situation where cost savings translate directly into profit gains. Most other types of comp anies see cost in a different light (i.e., the project is an intermediate step toward a profit-making initiative). For example, a research and
development project may result in a better telephone, which in turn leads to more revenue and profit for the telephone manufacturer. Thus, there are major differences in how companies apply PM and what they emphasize.
PM/ROI Calculation Procedure Using the quantitative relationships presented earlier, a tool that will allow an organization to calculate its PM/ROI on an order-of-magnitude basis is introduced and demonstrated. The algorithm is: 1. The organization first identifies its current project cost index (CIcurrent) and its current profit margin (P%current) from an analysis of recent projects, and its current PM maturity (PM current) from the benchmarking procedure described earlier. 2. The organization should select a target PM maturity level that it seeks to attain (PM desired). 3. At that targeted PM maturity level (PM desired), the organization would use the CI-PM maturity curve in Figure 4 to identify what CIforecast might be realized. 4. From CIforecast the organization can calculate a new estimated project profit return (P%predicted) using the formula in Equation 3.
P%predicted =
CI current x P% current CI forcast
This is the estimated new profit margin (in percentage) that can be achieved by moving to a different PM maturity level. To estimate the PM/ROI, multiply the P%predicted by the annual sales derived by the organization from projectized operations, and then divide by the estimated costs of moving from PM current to PM desired. Cost Index, CI Poor CI Best-Fit Regression Line
CI current
CI forecast Good CI Low P% current
Profit
Figure 6. CI Versus Project Profit (%)
P% predicted
Project Profit, % High Profit
5. To forecast the annual PM/ROI, multiply (P%predicted – P%current) by the annual sales derived by the organization from projectized operations. Then divide by the estimated annualized PM expenditures of moving from PM current to PM desired (see Equation 4).
PM/ROI
=
(P% predicted - P% current) × Annual Project Revenues Annualized PM Expenditures
In a similar fashion, an organization’s SI can be estimated using PM maturity versus SI graph (see Figure 5). The discussions with the various companies in this study suggest that today they are more time driven than cost driven, and this second type of analysis may actually be more appropriate to their PM investment decisions. A Case Study for PM/ROI Calculations This section provides a step-by-step scenario for calculating an order-of-magnitude PM/ROI estimate. An actual case study is cited, in which a company wanted to improve its PM maturity from PM current = 2.1 to PM desired = 3.3. It was currently achieving a profit margin of P%current = 5%. Next, the regression line from the PM maturity versus CI graph in Figure 4 was used as a basis. If PM current = 2.1 for this organization, then its estimated CIcurrent = 1.6. (If the organization has reliable project records, it may be able to calculate its own typical CI value and substitute that in place of CIcurrent.) The next step is to compute a CIforecast from Figure 4. In this case, given a desired shift to PM desired = 3.3, the CIforecast = 1.3. The new P%predicted would be calculated from Equation 5.
P% predicted =
CIcurrent x P%current CIforecast
P% predicted = (1.6 X 0.05)/1.3 = 6.2%
The PM/ROI realized by upgrading from PM current to PM desired is shown in Equation 6.
PM/ROI
=
(P% predicted - P% current) × Annual Project Revenues Annualized PM Expenditures
In this particular case, the organization had $10 million in annual project revenues, and the costs for upgrading from PM current = 2.1 to PM desired = 3.3 were $400,000 annually. Then the PM/ROI realized by upgrading from PM current to PM desired is shown in Equation 7.
PM/ROI =
(6.2% - 5.0%)x $10,000,000 $400,000
PM/ROI
=
29%
Because the data are inexact, we have included +/– 10% curves in Figure 4. Using those upper and lower bounds, this procedure would yield a PM/ROI ranging between 15% and 41%.
Caveats A few caveats need to be mentioned. First, profit and profit margins are difficult to associate with project-related operations for many organizations. Many businesses do not have accounting systems that permit identifying project-related profits, P%current, the annual project revenues, or the annualized PM expenditures. Their accounting systems are still functionally based, which would complicate or impede calculating these quantities. Secondly, annualized PM expenditures are difficult to calculate. In the course of this study, the authors did not find one organization that measured these expenditures in a manner regarded as thorough. In fact, many companies had not even attempted to measure them. As a starting point, the following checklist is suggested for the types of costs that might be included in such a computation: • Salaries and benefits of PM personnel • PM consultant expenses • PM systems, procedures, and tools on an annualized basis • Computer hardware and software acquisition, maintenance and upgrade costs on an annualized basis • Support staff, such as clerical, administrative, and technical personnel • PM training on an annualized basis, whether provided by in-house staff or consultants • Certification expenses, such as PMP® and ISO • Recruitment and hiring expenses • Travel, meeting, and coordination expenses • Supplies and material costs • Rent and other facility management expenses • Telephone, fax, and networking expenses • Moving and storage costs and temporary office expenses • Utility expenses. Another caveat is what is meant by the definition of “profit.” Sometimes cost savings are equally important. Any PM/ROI computations should reflect that management may be just as concerned about cost savings as profit generation. Finally, a focus on the project’s CI using its budget, as was the case in this study, may really be secondary. In other words, the project is only a step toward developing a revenue-generating service or product. Far greater profits can be realized by a telecommunications company developing and eventually selling call waiting, as an example, to millions of customers, than can be realized from the “profit” of finishing a project economically. So, using the CI as a measure for the ROI on a project is not always the best measure, but there was no other option in the case of this research project.
Summary, Conclusions, and Recommendations This research provides solid, comparative studies on PM practices across industries and among peer companies within any one industry. There are, admittedly, insufficiencies with this study, for example, the small sample size and lack of statistically significant results. But statistically significant results are difficult to achieve in studies of complex situations, such as PM practices. Despite these insufficiencies, the authors hope that readers and companies will view this study positively and as a step toward better understanding PM’s value. And, as a result of this study, it is hoped that they will step forward to participate in further studies like this. By comparing and correlating the organizational aspect of PM practices to actual project performance data, this research has found that:
• The quantitative PM Maturity Process Benchmarking Model that was developed for this study works. It provides a means for identifying and measuring different PM maturity levels by combining PM processes with quantitative project information. This PM benchmarking system can be easily applied, and should be further modified to assess different aspects of PM practices in more detail. • An organization’s PM maturity level and actual project cost and schedule performance data were correlated based on the collected information from participating companies. These relationships (see Figures 4 and 5) can be used to forecast the potential gains possible by moving to a different PM maturity level. These data and experiences should be interpreted to encourage managers to pursue improved PM processes. • These relationships can be used to predict a PM/ROI that is characteristic to the individual organization. These data and exp eriences also can be interpreted to encourage managers to pursue improved PM processes. In this paper, the PM Maturity Process Benchmarking Model was shown to be successful, and should be applied to other industries and companies to improve our understanding of PM. It should also be reapplied to companies that participated in the first year’s study to determine the impacts of improvements that have been implemented during the past year. By collecting and sharing this information, all PM organizations can benefit. An impartial organization should conduct this benchmarking, so that the PM/ROI and other important data can be reported to the PM community at large. This information would be very helpful to managers who are struggling to improve their organizations’ overall PM practices. Furthermore, an “Excellence in Project Management Practices Award” should be established and awarded on an annual basis. PMI and other organizations such as ASCE, IEEE, and the U.S. Department of Commerce have recognized the value of competitions for projects of the year and Total Quality Management Awards. These competitions have established highly successful rivalries and enhanced the stature of the respective professions. This proposed best PM practices award would focus on and recognize organizations (government, business, nonprofit, education) that have superior PM practices. This award would advance the recognition of PM as an important and timely professional discipline. Designing and implementing this award process would require a substantial amount of effort. Factual, rationally collected information like this will enable us to understand PM and to manage our organizations better. This type of information can help managers better understand the PM practices in their companies and promote their use throughout their organizations.
Acknowledgments This research was sponsored by the PMI Educational Foundation and PMI’s Northern California Chapter. In particular, we thank Dan Ono, Jim McFarlin, Mike McCauley, Paul Nelson, Bill Ruggles, Ahmet Taspinar, Bob Thompson, and Cathy Tonne. We also appreciate the participation received from the 38 people and companies that provided the data. References
Al-Sedairy, Salman T. (1994, Dec.). Project management practices in public sector construction: Saudi Arabia. Project Management Journal, 37–44. Boznak, Rudolph G. (1988). Project management—Today’s solution for complex project engineering. IEEE. Bu-Bushait, K.A. (1989, June). The application of project management techniques to construction and R&D projects. Project Management Journal, 17–22. Cleland, David. (1993, Sept.). The future of project management. PM Network, 6–8. Construction Industry Institute (CII). (1990, April). Assessment of owner project management practices and performance. Special CII Publication. Deutsch, Michael S. (1991, Nov.). An exploratory analysis relating the software project management process to project success. IEEE Transactions on Engineering Management, 38 (4). Donnelly, Richard G., & Kezsbom, Deborah S. (1993). Overcoming the responsibility-authority gap: An investigation of effective project team leadership for a new decade. AACE Transactions. Gobeli, David H., & Larson, Erik W. (1986). Matrix management: More than a fad. Engineering Management International, 4.
Gross, Robert L., & Price, David. (1990). Common project management problems and how they can be avoided through the use of self-managing teams. 1990 IEEE International Engineering Management Conference. Ibbs, C.W., & Kwak, Young Hoon. (1997a). The benefits of project management: Financial and organizational rewards to corporations. Upper Darby, PA: Project Management Institute. Ibbs, C.W., & Kwak, Young Hoon. (1997b). Measuring project management’s return on investment. PM Network, pp. 36–38. Ibbs, C.W., & Kwak, Young Hoon. (1998, Feb.). Benchmarking project management organizations. PM Network, pp. 49–53. Integrated Project Systems (IPS). (1995). Organizational Maturity Assessment Questionnaire. Kerzner, Harold. (1987). In search of excellence in project management. Journal of Systems Management, pp. 30–39. Kwak, Young Hoon. (1997, May). A systematic approach to evaluate quantitative impacts of project management. Ph.D. dissertation, Department of Civil Engineering, University of California, Berkeley. Kwak, Young Hoon, & Ibbs, C. William. (2000). Assessing Organization’s Project Management Maturity. Project Management Journal, 31 (1), 32–43. Larson, Erik W., & Gobeli, David H. (1989, May). Significance of project management structure on development success. IEEE Transactions on Engineering Management, 36 (2). Lundin, Rolf A., & Soderholm, Anders. (1994, Oct.). Conceptualization and learning—The black environment of PM. Proceedings of the 25th Project Management Institute 1994 Annual Seminars & Symposium. Vancouver, Canada. McCauley, Mike. (1993, Sept.). Developing a project -driven organization. PM Network, pp. 26–30. McCollum, James K., & Sherman, J. Daniel. (1991, Feb.). The effects of matrix organization size and number of project assignments on performance. IEEE Transactions on Engineering Management, 38 (1). McFarlin, James. (1995, May). PM tools: Where is the payback? PM Network, pp. 31–34. Might, Robert J., & Fischer, William A. (1985, May). The role of structural factors in determining project management success. IEEE Transactions on Engineering Management, 32 (2). Project Management Institute (PMI) Standards Committee. (1994). A Guide to the Project Management Body of Knowledge Exposure Draft. Upper Darby, PA: Project Management Institute. Project Manage ment Institute (PMI) Standards Committee. (1996). A Guide to the Project Management Body of Knowledge (PMBOK® Guide). Upper Darby, PA: Project Management Institute. Ziomek, N.L., & Meneghin, G.R. (1984, Aug.) Training—A key element in implementing project management. Project Management Journal, pp. 76–83.
C. William Ibbs, Ph.D., is a professor of project management in the Department of Civil and Environmental Engineering at the University of California at Berkeley. Ibbs’s research and consulting activities include strategic planning, project management, and design and implementation of management systems. He received generous sabbatical support from Massachusetts Institute of Technology (MIT) during the time he wrote this paper. Dr. Ibbs has been a PMI member for 20 years. Young H. Kwak, Ph.D., is currently an assistant professor at the Project Management Program at The George Washington University (GWU). He received his M.S. and Ph.D. in project management at the University of California at Berkeley. He also spent a year at MIT as a post-doctoral scholar, and was a visiting professor at Florida International University before joining GWU. His main areas of interest include project management maturity model, project management and control, construction management, and management of technology. Text cut from Abstract Then actual cost and schedule information are collected from these organizations for recently completed, representative projects. A positive association is shown to exist between a company’s PM maturity and its project cost and schedule performance. These data are used to develop curves that show predicted cost and schedule performance levels for a specific PM maturity level. These curves can then be used by the individual organization to estimate what project performance gains might reasonably be expected if the organization takes steps to improve its PM maturity. That information, in turn, can be used to estimate its specific PM/ROI. This research was sponsored by the Project Management Institute (PMI) Educational Foundation and PMI’s Northern California Chapter.