Pathophysiology of Haemostasis andThrombosis
Received: February 3, 2003 Accepted: April 12, 2003
Pathophysiol Haemost Thromb 2003;33:4–15 DOI: 10.1159/000071636
Calibrated Automated Thrombin Generation Measurement in Clotting Plasma H. Coenraad Hemker a Peter Giesen a Raed Al Dieri a Véronique Regnault b Eric de Smedt a Rob Wagenvoord a Thomas Lecompte b Suzette Béguin a, b a Synapse b INSERM
BV, Cardiovascular Research Institute, University of Maastricht, Maastricht, The Netherlands; ERIT-M 0323 et EA 3452, Faculté de Médecine, Université Henri Poincaré, Nancy, France
Key Words Antithrombotics W Activated protein C W Hypercoagulability W Hypocoagulability W Resistance W Thrombin generation W Thrombomodulin
Abstract Calibrated automated thrombography displays the concentration of thrombin in clotting plasma with or without platelets (platelet-rich plasma/platelet-poor plasma, PRP/ PPP) in up to 48 samples by monitoring the splitting of a fluorogenic substrate and comparing it to a constant known thrombin activity in a parallel, non-clotting sample. Thus, the non-linearity of the reaction rate with thrombin concentration is compensated for, and adding an excess of substrate can be avoided. Standard conditions were established at which acceptable experimental variation accompanies sensitivity to pathological changes. The coefficients of variation of the surface under the curve (endogenous thrombin potential) are: within experiment F3%; intra-individual: ! 5% in PPP, !8% in PRP; interindividual 15% in PPP and 19% in PRP. In PPP, calibrated automated thrombography shows all clotting factor deficiencies (except factor XIII) and the effect of all anticoagulants [AVK, heparin(-likes), direct inhibitors]. In PRP, it is diminished in von Willebrand’s
ABC
© 2003 S. Karger AG, Basel 1424–8832/03/0331–0004$19.50/0
Fax + 41 61 306 12 34 E-Mail
[email protected] www.karger.com
Accessible online at: www.karger.com/pht
disease, but it also shows the effect of platelet inhibitors (e.g. aspirin and abciximab). Addition of activated protein C (APC) or thrombomodulin inhibits thrombin generation and reflects disorders of the APC system (congenital and acquired resistance, deficiencies and lupus antibodies) independent of concomitant inhibition of the procoagulant pathway as for example by anticoagulants. Copyright © 2003 S. Karger AG, Basel
Introduction
The thrombin generation curve (thrombogram) is an old and established tool in blood coagulation research [1– 4]. It reflects much, if not all, of the overall function of the blood clotting system [5]. In platelet-poor plasma (PPP), it shows all clotting factor deficiencies with the exception of factor XIII [6–8], and it is sensitive to the action of oral anticoagulation, heparins of all types [9], direct thrombin inhibitors [10] and in fact all anticoagulant drugs tested. Hyperprothrombinemia [11] and lack of antithrombin [12], protein S or protein C as well as activated protein C (APC) resistance increase thrombin generation. Thrombin generation and a derivative test, the end level of ·2macroglobulin-thrombin (·2-M-T) in the ‘serum’ of defi-
H.C. Hemker, MD, PhD Synapse BV CARIM, POB 616 NL–6200MD Maastricht (The Netherlands) Tel. +31 43 3881 675, Fax +31 43 3884 570,
[email protected]
brinated plasma, have been shown to be sensitive indicators of congenital [13] and acquired [14–16] defects in the APC pathway. In platelet-rich plasma (PRP), the thrombogram also reveals the part played by platelets and hence the effect of von Willebrand factor [17], hypofibrinogenemia [17], thrombopenia [18] and Glanzmann’s [17] and BernardSoulier’s thrombopathies [Béguin, submitted] as well as the effect of anti-platelet drugs [19, 20], GPIIb/IIIa antagonists included [21]. Agents that increase platelet reactivity (e.g. arachidonic acid, epinephrine and collagen [22]) accelerate thrombin generation in PRP. Despite its potential value for clinical diagnosis, drug monitoring and epidemiology, thrombin generation has not found universal application, primarily because of technical reasons: with the established subsampling techniques it takes about 1 h for a skilled laboratory worker to acquire one to four curves. The use of a slow-reacting fluorogenic substrate enables continuous measurement of thrombin generation in fibrin(ogen)-containing media which makes it possible to use PRP and to test the influence of platelets on thrombin generation [23, 24]. However, it raises the question of how to convert the velocity of a fluorescence change (dF/dt) into a thrombin concentration [25]. For various reasons, during the course of the experiment, the relationship between dF/dt and thrombin concentration varies as fluorescence increases. We calculate thrombin activity as a function of time by comparing the fluorescent signal from the thrombin-generating sample to that from a known stable concentration of thrombin activity measured simultaneously in a parallel sample. We developed software to combine the data from the two experiments and display the concentration of thrombin in the coagulating sample in real time during the experiment. Using a 96-well plate fluorescent reader, up to 48 samples can thus be run.
Materials and Methods Chemicals Recombinant relipidated tissue factor (rTF) not containing polybrene or Ca2+ was a kind gift from Dade Behring (Marburg, Germany). Phospholipid vesicles consisted of 20 mol% phosphatidylserine, 20 mol% phosphatidylethanolamine and 60 mol% phosphatidylcholine. Hepes-buffered saline comprised 20 mM Hepes, 140 mM NaCl, pH 7.35 (prepared as described [12]). Fluorogenic substrate, Z-Gly-Gly-Arg-AMC, was obtained from Bachem (Bubendorf, Switzerland). Upon splitting by thrombin, it releases the fluorescent AMC (7-amino-4-methylcoumarin), which is measured by a 390-nm-excitation and a 460-nm-emission filter set.
Calibrated Automated Thrombography
A fresh mixture of fluorogenic substrate and CaCl2 was prepared for each experiment as follows: to 875 Ìl of buffer (Hepes 20 mM, pH 7.35) containing 60 g/l BSA (Sigma, A-7030), 100 Ìl of 1 M CaCl2 was added. At 37 ° C, 25 Ìl of a 100 mM DMSO solution of the fluorogenic substrate was squirted in and immediately vigorously mixed. The resulting clear solution, referred to as FluCa, thus is 2.5 mM in fluorogenic substrate and 100 mM in CaCl2. The chromogenic thrombin substrate was S2238 (Chromogenics, Mölndal, Sweden). Heparin was unfractionated heparin from LEO (Copenhagen, Denmark). APC was purified according to Regnault et al. [26]. As a thrombomodulin (TM) preparation we used recombinant human TM, a kind gift of Asahi (Japan). Blood and Plasma Blood was obtained through antecubital venipuncture (1 volume trisodium citrate 0.13 M to 9 volumes blood) from healthy individuals who consented to participate in this study. Free flow or minimal suction was employed; vacuum containers were avoided. PRP was collected from the upper 3/4 volume of plasma supernatant after centrifugation at 265 g for 10 min at room temperature. The platelets were counted (Beckman Coulter counter) and adjusted to 150 ! 109 platelets/l with autologous PPP, prepared by centrifuging twice at 2,900 g for 10 min at room temperature. PRP was always used within 1 h after venipuncture. In order to avoid contamination with procoagulant microparticles from aging platelets, PPP is preferably prepared within 30 min after venipuncture. Preparation of the Calibrator In order to obtain a stable thrombin-like activity in plasma, we used ·2 macroglobulin-thrombin complex (·2M-T). A crude ·2Mcontaining fraction was isolated from citrated bovine plasma by precipitation with 12% (w/v) PEG-20,000; the pellet was dissolved in 1/10 vol 100 mM NaCl, 20 mM Hepes (pH 7.9) (modified from Barrett [27]). To this solution we added 12 ÌM bovine prothrombin, 6 mM CaCl2, 50 ÌM phospholipid vesicles (20% brain phosphatidylserine, 80% egg yolk phosphatidylcholine), 5 nM bovine factor Xa and 0.78 nM bovine factor Va. The mixture was stirred for 30 min at room temperature and then kept overnight at 4 ° C. The formed fibrin was removed and the preparation was applied to a Sephacryl column equilibrated with 100 mM sodium citrate, 20 mM Hepes (pH 7.4) and 0.02% NaN3. The ·2M-T that had formed eluted as a sharp peak before contaminating proteins. The concentration of ·2M-T is measured by its activity towards S2238 and adjusted to the activity of 600 nM human thrombin; 100 nM bovine antithrombin and 2 U/ml heparin are added in order to prevent coagulation of the plasma sample upon use. The material is lyophilized and used as a calibrator after reconstitution with sterile water. Automated Fluorogenic Measurement of Thrombin Generation under Standard Conditions The thrombograms are measured in a 96-well plate fluorometer (Ascent reader, Thermolabsystems OY, Helsinki Finland) equipped with a 390/460 filter set (excitation/emission) and a dispenser. Immulon 2HB, round-bottom 96-well plates (Dynex) are used. Each experiment needs two sets of readings, one from a well in which thrombin generation takes place (TG well) and a second one from a well to which the calibrator has been added (CL well). The color of the plasma can influence the fluorescence intensity, therefore
Pathophysiol Haemost Thromb 2003;33:4–15
5
Table 1. Kinetic constants of thrombin and ·2M-T
Kinetic constants
·2M-T in buffer
·2M-T in plasma
Thrombin (buffer)
Thrombin (plasma)
Km, ÌM kcat, M –1 W s –1
292B44 0.95B0.1
310B34 0.89B0.1
305B46 1.86B0.26
280B57 ND
n = 12. The Km of thrombin in plasma was measured indirectly as the Ki of the inhibition of thrombin decay.
each plasma needs to be compared to its own calibrator measurement. If the same plasma is used under different conditions (different triggers, addition of APC or TM, addition of substances to be tested), the experiments can share the same calibrator. PPP and PRP from the same individual can also share the same calibrator. Usually experiments are carried out in quadruplicate, i.e. a set of 4 TG wells is compared to a set of 4 CL wells. A dedicated software program (Thrombinoscope, Synapse BV, Maastricht, The Netherlands) enables the identification of the (sets of) wells and determines the duration of the experiment and the sampling rate (usually 4/min). To each well, 80 Ìl of plasma is added. The TG wells receive 20 Ìl of buffer, containing the trigger but no Ca2+, and the CL wells 20 Ìl of the ·2M-T solution. For PPP, the trigger is 30 pM of rTF and 24 ÌM phosphatidylserine/posphatidylcholine/phosphatidylethanolamine vesicles in Hepes-buffered saline. For PRP the trigger is 20 Ìl of 3 pM of rTF without added PL. The plate is placed in the fluorometer and allowed to warm to 37 ° C (minimally 5 min). The dispenser of the fluorometer is flushed with warm 100 mM CaCl2 solution, emptied, and then flushed with warm FluCa. At the start of the experiment, the instrument dispenses 20 Ìl of FluCa to all the wells to be measured, registers this as zero time, shakes them for 10 s and starts reading. During the measurement, the program compares the readings from the TG and the CL wells, calculates thrombin concentration and displays the thrombin concentration in time.
Experimental Results
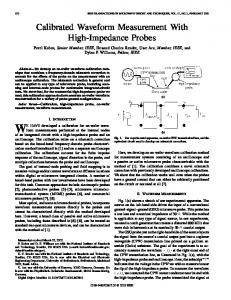
Fig. 1. The effect of constant thrombin activity on the fluorescent signal production in plasma. a The fluorescent traces of a range of
·2M-T concentrations with the tangents at t = 0 (initial velocity). b Relation between initial velocity and ·2M-T concentration. c Dif-
ference between tangents and curves of the top frame plotted as a function of the measured fluorescence.
6
Pathophysiol Haemost Thromb 2003;33:4–15
From Fluorescent Intensity to Thrombin Activity Free thrombin activity rapidly decays in plasma, so, in order to investigate the effect of constant thrombin activity on substrate consumption in plasma we used the ·2M-T complex that splits the signal substrate like thrombin does but that is not affected by plasma inhibitors. Under test conditions, its amidolytic activity in plasma, as tested by subsampling on S2238, remained constant for over 3 h (results not shown). The kinetic constants of ·2M-T were compared to those of thrombin (table 1). The Km of thrombin and ·2M-T is identical within the limits of experimental error. Therefore, the variation in the reaction velocity with decreasing substrate concentration will
Hemker/Giesen/Al Dieri/Regnault/ de Smedt/Wagenvoord/Lecompte/Béguin
Fig. 2. Thrombograms obtained at differ-
ent substrate concentrations (PPP, standard conditions). a Total thrombin. b Free thrombin. Substrate concentrations (from top to bottom): 0.4, 0.3, 0.2, 0.1 and 0.05 mM.
be practically identical. The turnover velocity of ·2M-T (kcat) is half that of thrombin. To compensate for this difference, we express henceforward the concentration of ·2M-T in ‘thrombin equivalents’, i.e. as the concentration of free thrombin that gives the same reaction velocity, i.e. at half the actual concentration. Figure 1a demonstrates that constant ·2M-T activities do not cause a constant rate of fluorescence increase. The initial rates, measured as the tangents to the curves at t = 0, are proportional to the enzymatic activity added (fig. 1b). The curvature is due to substrate consumption and to the non-linearity of fluorescence intensity with increasing concentration of fluorescent molecules (the ‘inner filter effect’) [28]. Both effects increase with the amount of product formed and hence with the level of fluorescence. We calculated the difference between the ideal fluorescence intensity (Fi), i.e. the value that would have been obtained experimentally if the initial velocity would have been maintained and the experimentally measured fluorescence (Fe), i.e. the vertical distance between the bold and the thin lines in figure 1a. The plot of Fi-Fe against Fe superimposes for the lines obtained at the six different thrombin activities (fig. 1c), demonstrating that the deviation from the initial velocity is indeed only dependent on the level of fluorescence. Therefore, every fluorescence level requires a different calibration factor to convert the velocity of the fluorescence increase (dF/dt) into thrombin activity (in nM). This calibration factor can be read from the graph obtained with a known calibrator concentration. The calibration factor is not only a function of the fluorescence level attained, it also depends upon the instrument used, the age of lamp and filters, and the color of the
plasma; therefore, each group of experiments that is carried out with the same plasma requires its own calibration experiment.
Calibrated Automated Thrombography
Pathophysiol Haemost Thromb 2003;33:4–15
Influence of the Fluorescent Substrate on the Course of Thrombin Generation The more substrate is present, the more thrombin molecules are occupied by the substrate and the less are they available for interaction with the natural antithrombins [29]. This effect is not corrected for by calibration, because the calibrator does not react with antithrombins. Therefore, the measured thrombogram increases with increasing concentrations of the fluorescent substrate (fig. 2a). When the amount of free thrombin is calculated (= total thrombin W [Km/(Km + [substrate])], the influence of the substrate concentration becomes negligible (fig. 2b), showing that the fluorogenic substrate has little or no influence on the mechanism of prothrombin conversion. The Effect of Fibrinogen Previous techniques for automatic determination of the thrombogram used chromogenic substrates and required defibrination with coagulating snake venom enzymes in order to prevent turbidity changes [29]. We observed that the removal of fibrinogen has a profound influence on the thrombogram: In the absence of fibrinogen, the fluorescent technique shows a lower thrombin peak and a higher ·2M-T end-level than in its presence (fig. 3a). By adding increasing concentrations of fibrinogen to afibrinoginemic plasma, fibrinogen dose-dependently decreases the amount of thrombin found in a subsampling experiment and increases the amount of thrombin in a fluorometer experiment (fig. 3b).
7
Fig. 3. The influence of fibrinogen on the thrombogram. a Course of amidolytic activity (expressed as thrombin equivalents) in normal pooled plasma before (A) and after (B) defibrination. Means B 2 SD, n = 24. b ETP of the
plasma from an afibrinoginemic patient with increasing amounts of fibrinogen added. P = Fluorogenic method; [ = subsampling method.
Standard Conditions In PPP we chose a final concentration of 5 pM of rTF together with 4 ÌM of procoagulant phospholipids. At this concentration of rTF, thrombin generation is dependent upon factors VIII and IX (fig. 4) but not on factor XI, the influence of which is only seen at TF concentrations below 1 pM [8, and results not shown]. In the 3 pM range and above, thrombin generation in PPP is not critically dependent on the rTF concentration, whereas around 1 pM it is. rTF does not normally carry enough procoagulant phospholipids to ensure optimal prothrombin conversion. Thrombin generation is phospholipid dependent in the 0 to 2 ÌM range and reaches a plateau at F3 ÌM. At F10 ÌM, the contact activation properties of negatively charged PPL start to play a role [8], we therefore used 4 ÌM PPL. In the absence of traces of rTF, the lag phase of thrombin generation in PRP is long and variable, probably influenced by endogenous TF and contact activation. Adding 0.5 pM (final concentration) of rTF largely abolishes this variability. It is essential that no PL is added; thus the test is critically dependent upon the PL coming from the activated platelets. Under these conditions, thrombin generation is dependent upon the platelet number in the range of 0–100 ! 109/l; above 200 ! 109/l dependence is minimal. In our experience, at 150 ! 109/l a useful equilibrium establishes between the independence of small fluctuations in the platelet count and the sensitivity to platelet inhibitors.
8
Pathophysiol Haemost Thromb 2003;33:4–15
In PRP, under these conditions, thrombin generation is dependent upon platelet function (and hence on the level of von Willebrand factor [7]) as well as upon the concentration of factors VIII, IX and XI; the effect of activated factor VII is readily seen (results not shown). The thrombogram reflects the action of all anticoagulants tested, alone or in combination. In the case of heparin, release of platelet factor 4 causes the inhibitory effect to be significantly smaller in the presence of platelets than in PPP (fig. 5). In the case of oral anticoagulation, a concomitant inhibition of the protein C system is readily seen. Normal Values and Variability The experimental variability in the main parameters of the thrombogram is shown in table 2. (The lag time is arbitrarily defined as the moment that 10 nM thrombin is formed.) The variation measured in identical parallel experiments in one 96-well plate is low (3–5%) and even lower when an occasional apparently aberrant curve, usually due to the presence of a floating bubble or accidental miss-pipetting, is left out. The intra-individual CV was measured by making thrombograms of 4 healthy subjects once in 9 consecutive weeks. The CV of the endogenous thrombin potential (ETP) for each individual was around 8% (7.4, extremes 6–11). The interindividual variability determined based on the means of the 9 individual experiments was 17.5%. The combination of relatively stable day-to-day values and large interindividual variation is further illustrated in
Hemker/Giesen/Al Dieri/Regnault/ de Smedt/Wagenvoord/Lecompte/Béguin
Fig. 4. Influence of TF concentration on thrombin generation in normal and hemophilia A and B plasma. From left to right: Normal plasma; hemophilia A plasma; hemophilia B plasma. rTF concentrations in decreasing peak height: 15, 10 and 5 pM rTF.
Fig. 5. Influence of heparin administration on thrombin generation
in PPP and PRP. At t = 0, 7,000 aXa units of enoxaparin were injected subcutaneously. Thin line = PPP, t = 0; bold line = PPP, t = 4 h; ++: PRP, t = 0; [[ = PRP, t = 4 h. Time axis truncated at t = 30.
figure 6 (a representative selection is shown so as not to overload the figure). Part of the variation in PRP must be due to the variation in von Willebrand factor, the lower curve in figure 6, for example, is from an individual with a mild von Willebrand factor deficiency (ristocytin cofactor activity 49%, factor VIII:c 72%). Influence of Added APC and TM Figure 7 demonstrates that thrombin generation is considerably decreased by the addition of APC or TM. PRP is significantly less sensitive to APC than PPP is. The sensitivity to TM does not show this large difference between PPP and PRP. The degree of inhibition observed is dependent upon both the TF concentration and the concentration of APC and TM. Under our standard conditions the inhibitions shown in table 3 are observed. Because the effect of APC or TM is compared to the same plasma to which no activator of the PC system is added, its effects can be observed independent of concomitant inhibition of thrombin generation as for example under antithrombotic treatment and/or in the presence of lupus anticoagulants [16].
Fig. 6. Intra- and interindividual variability in the PRP thrombogram. From the experiments used to establish the intra- and interindividual variability, the curves are given of three authors, determined four times at 2-week intervals. The line type is varied per individual. [ = Mild von Willebrand factor deficiency.
Measuring the hemostatic function of the blood is important both in bleeding and thrombotic disorders. Nevertheless, there is no universal test of this function
available to the clinician. Clotting times of different types do not indicate a thrombotic tendency of unknown origin or mild hemostatic disorders. Different clotting assays are needed for different types of anticoagulant (oral anticoagulation/heparin), and for some types of antithrombotic therapy no adequate function test is available (e.g. heparin likes).
Calibrated Automated Thrombography
Pathophysiol Haemost Thromb 2003;33:4–15
Discussion
9
Fig. 7. Effect of the protein C system on normal plasma. a PPP. b PRP. Drawn line = Control; ++ = TM added (10 nM ); [ [ = APC added (10 nM in PPP, 6 nM in PRP). Inhibition of the ETP: PRP-TM: 64%; PRP-APC: 29%; PPP-TM: 76%; PPP-APC: 87%.
The thrombin generation test is a time-honored tool in coagulation research [1–4], and its wide scope is easily understood from the focal place of thrombin in the hemostatic-thrombotic mechanism [5]. On the one hand, scores of factors influence its formation, and on the other hand, it has numerous actions on blood and vessel components. The ensemble of pro- and anticoagulant factors determines thrombin generation in PPP, where a standard amount of procoagulant phospholipids is normally added. In PRP, thrombin generation is also dependent upon platelet function because platelets provide the necessary phospholipids, clotting factor V and, presumptively, clotting factor receptors. Thrombin generation in PRP thus reflects the major part of the physiological clotting system. Ideally, the contribution of white and red cells and the vessel wall should be included, and flow conditions created. To date, this is not yet technically possible although the vessel wall can be partly represented by adding TF and TM. In the older literature thrombin generation is used both as a diagnostic test and as a tool in basic research [1–4, 18]. Its use in modern, large-scale, clinical, epidemiological or pharmacological studies is hampered by its extreme labor-intensiveness. With the conventional subsampling techniques, even when optimally streamlined [30], it takes about 1 h of a skilled technician to obtain one to four thrombograms. Therefore, we developed the test presented here, which allows a throughput of up to 48 single thrombin-time graphs per hour in an automated procedure.
10
Pathophysiol Haemost Thromb 2003;33:4–15
In this test, the thrombin concentration in the sample is calculated from the conversion velocity of a slow-reacting fluorogenic thrombin substrate. The principle of this approach has been developed with chromogenic substrates [29]. Unlike optical density measurements, the fluorescent signal is not influenced by the turbidity of the emerging clot, so fibrinogen-containing plasma and PRP can be used. With fluorogenic substrates, however, constant thrombin activity does not cause a constant increase in the output signal, and thus the first derivative of the signal produced does not directly reflect thrombin concentrations. As seen in figure 1, the velocity of the fluorescence increase diminishes as the level of fluorescence increases. It is also seen that (i) the initial velocities are proportional to the amount of enzyme added (fig. 1b) and (ii) that the decrease in signal production is a function of the level of fluorescence but not of time or of the thrombin activity per se (fig. 1c). The two phenomena that cause this nonlinearity are (i) non-linearity of fluorescence with the concentration of fluorescent molecules [28] and (ii) substrate consumption. In practice, the effect of substrate consumption – with any substrate – cannot be overcome by adding the substrate in excess. The more substrate is added, the more thrombin molecules are bound to it and thus protected from the action of antithrombin. This not only prolongs the experiment beyond reasonable limits but also increases substrate consumption and consequently the inner filter effect.
Hemker/Giesen/Al Dieri/Regnault/ de Smedt/Wagenvoord/Lecompte/Béguin
Fig. 8. Thrombogram in a patient under stable oral anticoagulant treatment (INR 2.5). a PPP. b PRP. + = Normal plasma: top curve (drawn) no TM, lower curve with TM; [ = normal plasma: top curve (drawn) no TM, lower curve with TM. Concentrations as in figure 8. Time axis truncated at t = 30.
Moreover, the substrate is a competitive inhibitor of physiological feedback reactions and thus may interfere with the development of prothrombinase: figure 2 shows that at the concentration of substrate used in our standard procedure, no significant inhibition of thrombin formation is observed. The effect of non-linearity cannot be solved by comparing thrombin generation in an experimental sample to that in standard plasma. In an inhibited sample less product is formed than in the standard so substrate consumption and the inner filter effect are low and more signal will be obtained per unit of thrombin activity than in the control. Thus inhibition is underestimated. Inversely, in samples where the activity is higher than normal, the mean signal production per unit thrombin activity will be higher than in the control so that activation is also underestimated. From the data in figure 1 we calculated the magnitude of such errors, both as a percentage of the normal control and as a percentage of the actual value and found that they transgress acceptable limits as soon as the deviation from the standard becomes significant (fig. 9).
Fig. 9. Error induced by calculating inhibition or activation by comparison of the uncorrected ETP to that in a normal control. The thin line error is shown in percent of the normal control, the bold line error in percent of the measured value.
Fibrinogen In subsampling experiments, where the thrombin concentration in the fluid phase is determined, 30–50% more thrombin is found in defibrinated plasma than in plasma from which the fibrin has not been removed [31]. In fluorescence experiments, significantly more thrombin activity is found in the presence of fibrin than in its absence (fig. 3). Therefore, thrombin bound to fibrin must be co-
estimated in the fluorescent experiment. This is not without importance because it has been shown that thrombin bound to fibrin can activate factors V, VIII and XI as well as platelets [31]. Also, antithrombin (and hence heparins) are reported not to inhibit fibrin-bound thrombin, whereas heparin cofactor II (and thus dermatan sulfate) and direct thrombin inhibitors do [32–34]. Our previously reported study showing that in PRP the presence of fibrinogen is essential for normal thrombin generation [17] has
Calibrated Automated Thrombography
Pathophysiol Haemost Thromb 2003;33:4–15
11
been confirmed with the fluorogenic technique presented here (results not shown). Another important effect of fibrin(ogen) is that it diminishes the amount of ·2M-T formed during the experiment (fig. 3). The high end-level attained in defibrinated plasma (or in the presence of polymerization inhibitors, results not shown) suggests that polymerizing fibrin prevents the interaction between thrombin and ·2-M. Therefore, correction of the ·2M-T end-level is minimal, and the traces of amidolytic activity obtained during the experiment practically represent the course of free thrombin. This implies that the use of the ·2M-T end level as a means to estimate ETP [29, 15] is not only dependent on the level of ·2-M in the plasma but also on the level of fibrinogen. For unknown reasons, the experimental error in defibrinated plasma is higher than in non-defibrinated plasma (fig. 3b) Standard Conditions The form and magnitude of the thrombogram is dependent upon the trigger used. An excess of tissue factor (11 nM, as in a thromboplastin time estimation) will cause the mechanism of prothrombinase formation to take the extrinsic pathway, i.e. involve factors VII, V, X and TF pathway inhibitor. Decreasing the TF concentration changes the pathway of thrombin formation to include first factors VIII and IX and then factor XI [for a review, see ref. 36]. In the absence of any TF but with sufficient procoagulant phospholipids added, contact activation (‘intrinsic pathway’) will cause a burst of thrombin formation after F10 min. Even though plastics are used throughout, contact activation cannot be entirely avoided unless blood is taken on citrate-containing corn trypsin inhibitor (results not shown). In samples with a high content of circulating TF [37], thrombin generation can be seen even in the presence of corn trypsin inhibitor (results to be published). If in PPP the test is run without added phospholipids, thrombin generation becomes dependent upon non-sedimentable PL present in the plasma, i.e. upon the presence of circulating procoagulant microparticles, which in the first place helps to check pre-analytical conditions. Variable amounts of PL can be introduced by the use of vacuum tubes, by insufficient centrifugation, by storing PRP, especially in the cold. Consequently, the conditions of centrifugation as given in the methods section should be strictly observed. Thrombin generation is dependent upon the concentrations of PL and TF added. In the lower ranges, the relation is practically linear, to approach an upper limit at
12
Pathophysiol Haemost Thromb 2003;33:4–15
higher values. The concentrations chosen in our standard procedure are such that the upper ranges of thrombin generation are attained but not exceded. Thus, the method is insensitive to small experimental variations in trigger, whereas an excess of trigger will not overrule modest inhibitions. The number of platelets was chosen on the basis of the observation that between 0 and 75 ! 109 platelets/l there is an almost linear increase in thrombin generation with increasing platelet count, which levels off subsequently to reach a plateau near 150 !109 platelets/l. Higher platelet numbers hardly increase thrombin generation [18, 38], but thrombin generation is less sensitive to the influence of platelet-based mechanisms and their inhibitors. Normal Values, Normal Effects of Addition of APC or TM The normal values under our standard conditions are shown in table 2. Of note, the thrombin peak is much lower in PRP than in PPP, whereas the ETP is not significantly different. This is most likely explained by the fact that platelet procoagulant activity gradually develops in the course of the activation process, whereas in PPP the added procoagulant phospholipids are present at recalcification, i.e. at zero time. The inhibitory effect of APC and TM on the thrombin generation curve (table 3) is significantly diminished in dysfunctions of the APC system, such as the use of oral contraceptives or factor V Leiden [to be published, 39]. A comparison of thrombin generation in the presence or absence of TM or APC enables to assess the function of the APC system even if the coagulation process is impaired. In figure 8, for example, thrombin generation is diminished by oral anticoagulation, which concomitantly affects the APC mechanism, resulting in a diminished response to the addition of TM. It also has been shown that in the presence of the lupus anticoagulant severe resistance to APC and TM is accompanied by a considerably prolonged lag time (clotting time) [16]. The experimental variation is within acceptable limits (table 2) and similar between the three instruments at two locations used in the experiments reported here. In our experience, the fluorescence intensity of an identical product solution (AMC) can differ severalfold between fluorometers, even if they are of the same type. This variation is compensated for by the use of the calibrator. The variation in the population is much higher than the day-to-day variation per individual. Thus, some individuals generate more thrombin than others. A correlation between the clotting factor level and the occurrence
Hemker/Giesen/Al Dieri/Regnault/ de Smedt/Wagenvoord/Lecompte/Béguin
Table 2. Normal values and variability
Average (n = 36)
SD
CV interindividual
intraindividual
experimental
PPP
ETP, nM W min Peak, nM Time lag, min
1,879 458 3.1
284 60 1.4
15 13 47
4.5 5.5 8.1
2.5 4.5 5
PRP
ETP, nM W min Peak, nM Time lag, min
1,648 118 8.1
315 41 1.9
19 34 24
7.4 10.3 9.4
3 3.5 7
The intra-individual day-to-day variation was measured on 9 different days in 4 individuals. Experimental CV was determined on 36 identical samples measured simultaneously.
of venous and/or arterial thrombotic disease has been reported for various clotting factors [40, 41], which strongly suggests a relationship between the thrombin generation capacity and thrombotic disease. Measurement of overall thrombin generation enables the assessment of simultaneous effects of numerous small changes, which may either reinforce each other (e.g. in pregnancy [42]) or compensate each other (e.g. a bleeding tendency and factor VLeiden [43–45]). Hemorrhagic Diatheses It has been shown before [for a review, see ref. 5] that thrombin generation is diminished in hemophilia and rare clotting disorders [6–8]. Also, in PRP, it is diminished if von Willebrand factor is low [17] and increases upon DDAVP treatment [7]. As can be seen from figure 4 and 6, calibrated automated thrombography shows these effects as well as subsampling techniques do. In an accompanying article by Turecek et al. [46] it is shown that in hemophilia, the effect of inhibitor bypassing therapy can be seen in uncalibrated fluorescence experiments, thus enabling the quantification by calibrated automated thrombography.
Table 3. Effect of TM and APC supplementation
Plasma
PPP PRP
TM APC TM APC
Concentration nM
Inhibition, %
SD, %
3 6.5 10 25
34.4 47.5 69.7 71.8
4.9 5.1 5.8 5.5
Anticoagulant Treatment We hypothesize that in anticoagulant therapy diminished thrombin generation is essential. All anticoagulant drugs have this effect in common although they may achieve it in completely different ways: decreased prothrombin and prothrombin conversion (AVK), increased thrombin inactivation (heparin) or direct inhibition (hirudin, argatroban and melagatran). There is no single clotting test that reacts similarly to these different types of anticoagulants. Clotting tests measure the length of the
initiation stage of thrombin formation, i.e. the time during which no significant amount of thrombin (!5 nM) is formed. Clotting occurs at the end of this initiation phase and is complete when 195% of all thrombin is still to appear. That the amount of thrombin forming in the clot is essential for thrombosis and hemostasis can be derived from comparisons of laboratory and clinical observations. Heparin, for example, has a minimal effect on the TFinduced clotting time (‘quick time’) but has an undeniable antithrombotic effect. Defects in the protein C system have a recognized prothrombotic effect, nevertheless this system only comes into action after APC is formed by the TM-thrombin complex, i.e. in the later stages of thrombin formation, long after the clot has formed. In figures 7 and 8, the effect of added TM is seen in the second half of the thrombin generation curve. In fact the use of clotting times is restricted to those cases where the length of the initiation phase indicates the amount of thrombin to come, which is far from being a general rule. Some observations that are liable to be of clinical importance will readily escape our attention unless thrombin generation curves are made. It is logical, for example, that AVK treatment impairs the function of the
Calibrated Automated Thrombography
Pathophysiol Haemost Thromb 2003;33:4–15
13
APC system as well as of the clotting system. A net anticoagulant effect must remain to explain the antithrombotic effect, but assessment of the combined effect remained difficult. In figure 8 it is not only seen that TM resistance accompanies oral anticoagulation, the effect can also be quantified. Another example is seen in figure 5. Thrombin generation in PRP is far less influenced by heparin than thrombin generation in PPP. This must be ascribed to the effect of platelet factor 4 [30]. We recently demonstrated that in PPP all heparins have the same mode of action, independent of their molecular weight. Nevertheless, there may be important molecular-weight-dependent differences among heparins when tested in PRP – and hence in vivo. As a third example (not illustrated here), we mention that there are essential differences between irreversible (hirudin) and reversible (argatroban and melagatran) direct thrombin inhibitors in that the first act primarily on the lag time, but the second also have a strong inhibitory effect on the thrombin peak. Alternative Methods Depending on Clot Formation Several methods exist that measure the moment of clot formation and ensuing changes in the mechanical or optical properties of the clot and/or retraction of that clot through activated platelets, such as thrombelastography
[47], resonance thrombography: [48], roTEG coagulation analysis [49], the sonoclot analyzer [50], measurement of platelet-mediated force development during clot formation [51] and free oscillation rheometry [52]. The results of such methods sometimes show a superficial similarity to thrombin generation curves [53]. These methods can often be applied to whole blood, which is an important practical advantage. The disadvantage of clot-based methods is that they depend upon thrombin formation as well as on properties such as fibrinogen content and quality, fibrin polymerization, crosslinking and fibrinolysis [49]. These two aspects may counteract each other, e.g. in a febrile patient (high fibrinogen) under anticoagulant or other antithrombotic treatment (e.g. aspirin). Clot formation is only one of the many functions of thrombin and not necessarily the most important one, as can be judged from the mild bleeding syndrome in hypofibrinemia. Through selection of the right substrate and comparing the fluorescent signal to that of a calibrator with fixed activity we can obtain a correct estimate of the course of thrombin concentration in clotting plasma. Fibrinogen as a substrate is quickly exhausted and the signal from its product – i.e. one or the other mechanical or optical property – cannot be unequivocally related to the amount of thrombin formed.
References 1 Biggs R, Macfarlane RG: Human Blood Coagulation and its Disorders. Oxford, Blackwell, 1953. 2 Macfarlane RG, Biggs R: A thrombin generation test. J Clin Pathol 1953;6:3–7. 3 Pitney WR, Dacie J: A simple method of studying the generation of thrombin in recalcified plasma. J Clin Pathol 1953;6:9–13. 4 Seegers WH: A personal perspective on hemostasis and thrombosis (1937–1981). Semin Thromb Hemost 1981;7:177–307. 5 Hemker HC, Béguin S: Phenotyping the clotting system. Thromb Haemost 2000;84:747– 751. 6 Al Dieri R, Peyvandi F, Santagostino E, Giansily M, Mannucci PM, Schved JF, Béguin S, Hemker HC: The thrombogram in rare inherited coagulation disorders: Its relation to clinical bleeding. Thromb Haemost 2002;88:576– 582. 7 Keularts IM, Hamulyak K, Hemker HC, Béguin S: The effect of DDAVP infusion on thrombin generation in platelet-rich plasma of von Willebrand type 1 and in mild haemophilia A patients. Thromb Haemost 2000;84:638– 642.
14
8 Keularts IMLW, Zivelin A, Seligsohn U, Hemker HC, Béguin S: The role of factor XI in thrombin generation induced by low concentrations of tissue factor. Thromb Haemost 2001;85:1060–1065. 9 Al Dieri L, Wagenvoord R, van Dedem GWK, Béguin S, Hemker HC: The inhibition of blood coagulation by heparins of different molecular weight is caused by a common functional motif – The C-domain. J Thromb Haemost 2003; 1:907–914. 10 Sarich TC, Eriksson UG, Mattsson C, Wolzt M, Frison L, Fager G, Gustafsson D: Inhibition of thrombin generation by the oral direct thrombin inhibitor ximelagatran in shed blood from healthy male subjects. Thromb Haemost 2002;87:300–305. 11 Kyrle PA, Mannhalter C, Béguin S, Stumpflen A, Hirschl M, Weltermann A, Stain M, Brenner B, Speiser W, Pabinger I, Lechner K, Eichinger S: Clinical studies and thrombin generation in patients homozygous or heterozygous for the G20210A mutation in the prothrombin gene. Arterioscler Thromb Vasc Biol 1998;18:1287– 1291.
Pathophysiol Haemost Thromb 2003;33:4–15
12 Wielders S, Mukherjee M, Michiels J, Rijkers DT, Cambus JP, Knebel RW, Kakkar V, Hemker HC, Béguin S: The routine determination of the endogenous thrombin potential, first results in different forms of hyper- and hypocoagulability. Thromb Haemost 1997;77: 629–636. 13 Duchemin J, Pittet JL, Tartary M, Béguin S, Gaussem P, Alhenc-Gelas M, Aiach M: A new assay based on thrombin generation inhibition to detect both protein C and protein S deficiencies in plasma. Thromb Haemost 1994;71: 331–338. 14 Rotteveel RC, Roozendaal KJ, Eijsman L, Hemker HC: The influence of oral contraceptives on the time-integral of thrombin generation (thrombin potential). Thromb Haemost 1993;70:959–962. 15 Rosing J, Tans G, Nicolaes GA, Thomassen MC, Van Oerle R, van der Ploeg PM, Heijnen P, Hamulyak K, Hemker HC: Oral contraceptives and venous thrombosis: Different sensitivities to activated protein C in women using second- and third-generation oral contraceptives. Br J Haematol 1997;97:233–238.
Hemker/Giesen/Al Dieri/Regnault/ de Smedt/Wagenvoord/Lecompte/Béguin
16 Regnault V, Béguin S, Wahl D, de Maistre E, Hemker HC, Lecompte T: Thrombinography shows acquired resistance to activated protein C in patients with lupus anticoagulants. Thromb Haemost 2003;89:208–212. 17 Béguin S, Kumar R, Keularts I, Seligsohn U, Coller BS, Hemker HC: Fibrin-dependent platelet procoagulant activity requires GPIb receptors and von Willebrand factor. Blood 1999;93:564–570. 18 Eagle H: Studies on blood coagulation. I. The role of prothrombin and of platelets in the formation of thrombin. J Gen Physiol 1934;18: 531–545. 19 Kessels H, Béguin S, Andree H, Hemker HC: Measurement of thrombin generation in whole blood – The effect of heparin and aspirin. Thromb Haemost 1994;72:78–83. 20 Herault JP, Dol F, Gaich C, Bernat A, Herbert JM: Effect of clopidogrel on thrombin generation in platelet-rich plasma in the rat. Thromb Haemost 1999;81:957–960. 21 Reverter JC, Béguin S, Kessels H, Kumar R, Hemker HC, Coller BS: Inhibition of plateletmediated, tissue factor-induced thrombin generation by the mouse/human chimeric 7E3 antibody. Potential implications for the effect of c7E3 Fab treatment on acute thrombosis and ‘clinical restenosis’. J Clin Invest 1996;98:863– 874. 22 Altman R, Scazziota A, Rouvier J, Gonzalez C: Effect of sodium arachidonate on thrombin generation through platelet activation – Inhibitory effect of aspirin. Thromb Haemost 2000; 84:1109–1112. 23 Ramjee MK: The use of fluorogenic substrates to monitor thrombin generation for the analysis of plasma and whole blood coagulation. Anal Biochem 2000;277:11–18. 24 Hemker HC, Giesen PL, Ramjee M, Wagenvoord R, Béguin S: The thrombogram: monitoring thrombin generation in platelet-rich plasma. Thromb Haemost 2000;83:589–591. 25 Chantarangkul V, Clerici M, Bressi C, Tripodi A: Thrombin generation assessed as endogenous thrombin potential (ETP) in patients with hyper- or hypo-coagulability. Effects of phospholipids, tissue factor and residual platelets on the measurement performed in plateletpoor and platelet-rich plasma. Haematologica 2003;88:547–554. 26 Regnault V, De Maistre E, Geschier C, Briquel ME, André E, Stoltz JF, Lecompte T: A new fast one-step immunopreparation for activated protein C. Thromb Haemost 1995;73:136. 27 Barrett AJ: Alpha2-macroglobulin. Methods Enzymol 1981;80:737–754. 28 Udenfriend S: Fluorescence Assay in Biology and Medicine. New York, Academic Press, 1996, vol 1, pp13, 118, vol 2, pp182–185. 29 Hemker HC, Wielders S, Kessels H, Béguin S: Continuous registration of thrombin generation in plasma, its use for the determination of the thrombin potential. Thromb Haemost 1993;70:617–624.
Calibrated Automated Thrombography
30 Béguin S, Lindhout T, Hemker HC: The effect of trace amounts of tissue factor on thrombin generation in platelet rich plasma, its inhibition by heparin. Thromb Haemost, 1989;61: 25–29. 31 Kumar R, Béguin S, Hemker HC: The influence of fibrinogen and fibrin on thrombin generation – Evidence for feedback activation of the clotting system by clot bound thrombin. Thromb Haemost 1994;72:713–721. 32 Bendayan P, Boccalon H, Dupouy D, Boneu B: Dermatan sulfate is a more potent inhibitor of clot-bound thrombin than unfractionated and low molecular weight heparins. Thromb Haemost 1994;71:576–580. 33 Weitz JI, Hudoba M,Massel D,Maraganore J, Hirsh J: Clot-bound thrombin is protected from inhibition by heparin-antithrombin III but is susceptible to inactivation by antithrombin III-independent inhibitors. J Clin Invest 1990;86:385–391. 34 Okwusidi JI, Anvari N, Kulczycky M, Blajchman MA, Buchanan MR, Ofosu FA: Fibrin moderates the catalytic action of heparin but not that of dermatan sulfate on thrombin inhibition in human plasma. J Lab Clin Med 1991; 117:359–364. 35 Eisenberg PR, Siegel JE, Abendschein DR, Miletich JP: Importance of factor Xa in determining the procoagulant activity of whole-blood clots. J Clin Invest 1993;91:1877–1883. 36 Hemker HC: Thrombin generation, an essential step in haemostasis and thrombosis; in Bloom AL, Forbes CD, Thomas DP, Tuddenham EGD (eds): Haemostasis and Thrombosis. Edinburgh, Churchill Livingstone, 1994, pp 477–490. 37 Giesen PL, Rauch U, Bohrmann B, Kling D, Roque M, Fallon JT, Badimon JJ, Himber J, Riederer MA, Nemerson Y: Blood-borne tissue factor: Another view of thrombosis. Proc Natl Acad Sci USA 1999;96:2311–2315. 38 Butenas S, Branda RF, van’t Veer C, Cawthern KM, Mann KG: Platelets and phospholipids in tissue factor-initiated thrombin generation. Thromb Haemost 2001;86:660–667. 39 Curvers J, Thomassen MC, Rimmer J, Hamulyak K, van der Meer J, Tans G, Preston FE, Rosing J: Effects of hereditary and acquired risk factors of venous thrombosis on a thrombin generation-based APC resistance test. Thromb Haemost 2002;88:5–11. 40 Mercier E, Quere I, Chabert R, Lallemant JG, Daures JP, Berlan J, Gris JP: The 20210A allele of the prothrombin gene is an independent risk factor for perception deafness in patients with venous thromboembolic antecedents. Blood 1999;93:3150–3152. 41 Redondo M, Watzke HH, Stucki B, Sulzer I, Biasiutti FD, Binder BR, Furlan M, Lammle B, Wuillemin WA: Coagulation factors II, V, VII, and X, prothrombin gene 20210G→A transition, and factor V Leiden in coronary artery disease: High factor V clotting activity is an independent risk factor for myocardial infarction. Arterioscler Thromb Vasc Biol 1999;19: 1020–1025.
42 Eldor A: Thrombophilia, thrombosis and pregnancy. Thromb Haemost 2001;86:104–111. 43 Escuriola Ettingshausen C, Halimeh S, Kurnik K, Schobess R, Wermes C, Junker R, Kreuz W, Pollmann H, Nowak-Gottl U: Symptomatic onset of severe hemophilia A in childhood is dependent on the presence of prothrombotic risk factors. Thromb Haemost 2001;85:218– 220. 44 Vianello F, Belvini D, Dal Bello F, Tagariello G, Zanon E, Lombardi AM, Zerbinati P, Girolami A: Mild bleeding diathesis in a boy with combined severe haemophilia B (C(10400)→T) and heterozygous factor V Leiden. Haemophilia 2001;7:511–514. 45 Tizzano EF, Soria JM, Coll I, Guzman B, Cornet M, Altisent C, Martorell M, Domenech M, del Rio E, Fontcuberta J, Baiget M: The prothrombin 20210A allele influences clinical manifestations of hemophilia A in patients with intron 22 inversion and without inhibitors. Haematologica 2002;87:279–285. 46 Turecek PL, Va´radi K, Keil B, Negrier C, Berntorp E, Astermark J, Bordet J-C, Morfini M, Linari S, Schwarz HP: Factor VIII inhibitor-bypassing agents act by inducing thrombin generation and can be monitored by a thrombin generation assay. Pathophysiol Haemost Thromb 2003;33:16–22. 47 Hartert H: Blutgerinnungsstudien mit der Thrombelastographie, einem neuen Untersuchungsverfahren. Klin Wochenschr 1948;26: 577–583. 48 Hartert H: Resonance-thrombography: Theoretical and practical elements. Biorheology 1981;18:693–701. 49 Calatzis A, Fritzsche P, Kling M, Hipp R, Stemberger A: A comparison of the technical principle of the roTEG coagulation analyzer and conventional thrombelastographic systems (abstract). Ann Haematol 1996;72(suppl 1): P90. 50 Laforce WR, Brudno DS, Kanto WP, Karp WB: Evaluation of the SonoClot Analyser for the measurement of platelet function in whole blood. Ann Clin Lab Sci 1992;22:30–33. 51 Carr ME, Zekert SL: Measurement of plateletmediated force development during plasma clot formation. Am J Med Sci 1991;302:13– 18. 52 Ramstrom S, Ranby M, Lindahl TL: The role of platelets in blood coagulation – Effects of platelet agonists and GPIIb/IIIa inhibitors studied by free oscillation rheometry. Thromb Res 2002;105:165–172. 53 Sorensen B, Johansen P, Christiansen K, Woelke M, Ingerslev J: Whole blood coagulation thrombelastic profiles employing minimal tissue factor activation. J Thromb Haemost 2003,1:551–558. 54 De Cristofaro R, Landolfi R: Measurement of plasma fibrinogen concentration by the prothrombin-time-derived method: Applicability and limitations. Blood Coagul Fibrinolysis 1998;9:251–259.
Pathophysiol Haemost Thromb 2003;33:4–15
15