American Mineralogist, Volume 96, pages 1100–1106, 2011
Calibrating Ti concentrations in quartz for SIMS determinations using NIST silicate glasses and application to the TitaniQ geothermobarometer Whitney M. Behr,1,* Jay B. thoMas,2 and richard L. hervig3 1 Department of Earth Sciences, University of Southern California, 3651 Trousdale Parkway, Los Angeles, California 90089-0740, U.S.A. Department of Earth and Environmental Sciences, Rensselaer Polytechnic Institute, Jonsson-Rowland Science Center, 1W19 110 8th Street, Troy, New York 12180, U.S.A. 3 School of Earth and Space Exploration, Arizona State University, 550 East Tyler Mall, Tempe, Arizona 85287, U.S.A.
2
aBstract The recently developed titanium-in-quartz (TitaniQ) geothermobarometer of Wark and Watson (2006) and Thomas et al. (2010) has the potential to be applied to a wide range of igneous and metamorphic rocks. For Ti concentrations > ∼10 ppm, the concentrations can be measured using an electron microprobe, but lower concentrations are below detection limits and require techniques such as laser ablation inductively coupled plasma mass spectrometry (LA-ICP-MS) or secondary ion mass spectrometry (SIMS). SIMS is ideal for this purpose as it maximizes lateral and depth resolution. We used SIMS to analyze synthetic quartz crystals characterized for Ti concentration by electron probe (18–813 ppm Ti) and compare this calibration to the commonly available NIST 61X glasses using both high mass resolution (HMR) and conventional energy filtering (CEF) techniques. We used a primary beam of 16O– ions and detected positive secondary ions. During HMR sessions, the mass spectrometer was operated at a mass resolving power (M/∆M) of ~2000 to separate molecular ions from elemental Ti peaks. For CEF analyses, the instrument detected secondary ions sputtered from the sample with excess kinetic energies of 75 ± 20 eV. Titanian quartz measurements reveal general homogeneity and a linear increase in Ti+/Si+ ion ratios with increasing Ti concentrations. Background signals represent 0–1 ppm. The slopes of the calibration curves for the titanian quartz crystals are ∼70% of the curves constructed using NIST glasses, indicating a much higher ion yield for Ti from the glasses compared to the simple oxide of silicon. We demonstrate, however, that a simple correction factor allows NIST glasses to be used to quantitatively determine the Ti concentrations of quartz (with 3.8% error using HMR, and 8.2% error using CEF) until homogenous, well-characterized samples of SiO2 become generally available. Keywords: SIMS calibration, NIST silicate glass, titanium-in-quartz (TitaniQ), geothermobarometry
introduction Geothermobarometric techniques involving local equilibria between stable mineral assemblages have been applied to both igneous and metamorphic rocks for several decades (e.g., Boyd 1973). One of the recurring difficulties in geothermobarometry is that many igneous and metamorphic terranes lack the minerals necessary to apply suitable thermobarometers. Quartzo-feldspathic igneous and metamorphic rocks, for instance, may lack sufficient Al to produce the metamorphic index minerals (garnet, kyanite, andalusite, sillimanite, etc.) common to metapelites. Another difficulty is that many minerals become closed to reequilibration at ~500 °C, below which elemental diffusion is too sluggish unless recrystallization is pervasive. This leaves a gap in applicable thermobarometers for lower greenschist to lower amphibolite facies conditions, and yet the majority of exhumed lower crustal rocks experienced these metamorphic conditions at some point during their exhumation histories. * E-mail:
[email protected] 0003-004X/11/0007–1100$05.00/DOI: 10.2138/am.2011.3702
The recent development of a titanium-in-quartz (TitaniQ) geothermobarometer, based on the pressure and temperature dependence of Ti substitution for tetrahedral Si in quartz (Wark and Watson 2006; Thomas et al. 2010), largely circumvents both of these issues. Not only is quartz a common mineral in most igneous and metamorphic rocks, it is also one of the weakest minerals and deforms plastically under nearly all metamorphic conditions. Specifically, crystal-plastic deformation in quartz may occur down to temperatures of ~280 °C, whereas other common minerals such as feldspar cease to deform plastically below ~450 °C (Behrmann and Mainprice 1987; Stipp and Kunze 2008). Additionally, the plastic deformation mechanisms that occur in quartz at low temperatures (e.g., volatile-assisted diffusion creep, or dislocation creep) may facilitate Ti equilibration, even at conditions where static diffusion of Ti is predicted to be slow (e.g., Cherniak et al. 2007). TitaniQ is thus a very promising thermobarometer for estimating the pressure-temperature conditions for rocks deformed under lower greenschist to mid-amphibolite facies, particularly for felsic rocks that lack aluminous phases.
1100
BEHR ET AL.: SIMS CALIBRATION OF TITANIUM-IN-QUARTZ USING NIST GLASSES
For Ti concentrations > ∼10 ppm, concentrations can be measured using electron probe microanalysis (EPMA) (e.g., Spear and Wark 2009). However, the lower equilibration temperatures of greenschist to lower amphibolite facies rocks results in Ti concentrations in quartz below EPMA detection limits (Thomas et al. 2010). These measurements thus require techniques with higher sensitivity, such as laser ablation inductively coupled plasma mass spectrometry (LA-ICP-MS) or secondary ion mass spectrometry (SIMS). SIMS is ideal for this purpose for two reasons: (1) it provides sufficient lateral resolution to measure Ti concentration zoning patterns within crystals (i.e., on a scale of ~10 µm) and to explore differences between Ti concentrations of different generations of quartz growth and recrystallization (as identified petrographically) (e.g., Behr and Platt 2011); and (2) it shows a high “useful yield,” detecting up to 3% of the Ti atoms sputtered from a sample (Hervig et al. 2006). One of the first applications of the TitaniQ thermobarometer using SIMS was to estimate crystallization temperatures in felsic volcanic rocks of the Plateau Rhyolites on the margins of the Yellowstone caldera (Vazquez et al. 2009). These analyses were conducted on a SIMS using National Institute of Standards and Technology (NIST) 610 glass as a standard assuming no matrix correction. More recently, Spear and Wark (2009) and Kohn and Northrup (2009) examined lower temperature metamorphic rocks by measuring Ti concentrations on a SIMS using synthetic Ti-infused quartz grains from the TitaniQ calibration experiments of Thomas et al. (2010) as standards. Synthesis of additional quartz crystals with homogeneous and well-characterized Ti concentrations would be a worthwhile investment, but few institutions possess the proper experimental facilities. For this reason, it is desirable to explore other standard materials that are readily available to the community for calibrating Ti measurements using various analytical instruments. In this paper, we use SIMS to analyze synthetic quartz crystals characterized for Ti concentration by electron probe (18–800 ppm Ti) and compare this calibration with one obtained on the commonly available National Institute of Standards and Technology Standard Reference Material (NIST SRM) 61X glasses to evaluate the effect of changing matrix on the yield of Ti ions. We demonstrate that NIST 610, 612, and 614 glasses may be used as Ti-in-quartz standards on the SIMS using both high mass resolution and energy filtering techniques.
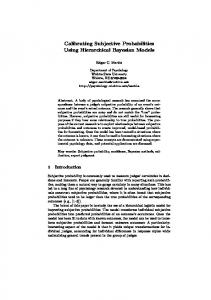
saMpLes and saMpLe preparation Synthetic samples analyzed include fragments of NIST 610, 612, and 614 silicate glasses, and four grain mounts of synthetic quartz with different Ti concentrations. Table 1 lists the average measured Ti concentration and standard deviation on the measurements for the synthetic quartz crystals and NIST glasses. Individual NIST glass fragments were embedded in 100 000 to 6000), but we have seen no evidence for the presence of this molecular ion. Analyses of the NIST glasses present more molecular ion interferences because of the presence of significant amounts of Na, Ca, Al, and the various dopants, but these interferences are also resolved at the same conditions as used for analyses of quartz (Fig. 1). An alternative method to using high mass resolution (HMR) to remove molecular ions from the mass spectrum is conventional energy filtering (CEF) (Shimizu et al. 1978; Zinner and Crozaz 1986). This technique works by only allowing ions ejected from the sample surface with excess kinetic energy into the mass spectrometer. The atomic collisions in the near surface of the sample that occur during sputtering result in the emission of ions with tens to hundreds of electron volts of excess energy. Most molecular ions are broken apart by these collisions, so that limiting the secondary ion beam to those ions ejected with, for example, 50–80 eV energy gives a relatively clean mass spectrum. However, energy filtering is most effective for removing those molecular species containing 3 or more atoms. Dimers are not effectively removed (Zinner and Crozaz 1986), nor does this approach remove multiply charged ions. However, if the molecular interferences on titanium isotopes in quartz are composed of complex molecular ions, energy filtering can be used to collect titanium ion intensities. Our analysis session detected secondary ions sputtered from the sample with excess kinetic energies of 75 ± 20 eV. The same primary species and current was used for all SIMS analysis sessions. However, the two analytical conditions led to different sensitivities to Ti. For example, the number of ions detected per atom of Ti sputtered decreases from the maximum value (∼3%) by a factor of ∼3–5 when operating at a mass resolving power of ∼2000, and by a factor of ∼40 using CEF (Hervig et al. 2006). In addition, the signal will be further reduced by a factor of ∼10 to 14 when a minor isotope of Ti is detected (47Ti and 49Ti represent 7.4 and 5.4% of the total Ti in a sample, respectively) compared to the more abundant 48Ti isotopes.
Table 2. Potential interfering isotopes on Mass 46 Ti
Ti
46–50
Interferences MRP* 28 18 Si O 2000 29 17 Si O 2000 30 16 Si O 2000 46 Ca 43 400 47 29 18 Ti Si O 2000 30 17 Si O 2000 48 30 18 Ti Si O 2000 96 2+ Mo 10 900 49 48 Ti TiH 6000 48 CaH 3700 98 Mo2+ 10 100 50 50 Ti Cr 36 700 * Mass resolving power required to separate interferences from Ti peaks.
figure 1. Mass spectrum of NIST 610 glass conducted at a mass resolving power of ∼2000, which is sufficient to separate 49Ti from common molecular ions.
Analysis setup We monitored both 48Ti and 49Ti isotopes for our analyses of NIST glass and quartz standards. By monitoring these two isotopes, we could compare quartz standards with bulk-analyzed materials containing calcium. We consider 49Ti to be the best analyte isotope as it has fewer potential interferences than the more abundant 48Ti. During analyses of quartz, the apparent signal for titanium may be increased if the analytical crater overlaps other minerals included in quartz. For example, if the analysis intersects a calcium-rich inclusion, the minor isotopes 46Ca and 48Ca will interfere with 46Ti and 48Ti, and 50Ti has a potential interference from 50 Cr in the event of overlap on a Cr-rich opaque mineral. The elemental isobars cannot be easily resolved by mass differences or eliminated by energy filtering, so the analyses should be designed to test for the presence of non-quartz phases in the analyzed volume. Thus, for quartz analyses, secondary ion intensities should be collected for 27Al, 30Si, 40Ca, 48Ti, and 49Ti. The 27Al and 40Ca signals can be used to monitor for microinclusions as described by Kohn and Northrup (2009). The Au and C coat deposited on the surface of samples to prevent charging is a potential source of Ti contamination. As an initial test for surface contamination we sputtered an area and monitored the changes in Ti count rate over time. Count rates for both 48Ti and 49Ti decreased slightly and systematically as the conducting coats were removed, but leveled out after ~200 s of sputtering. We therefore set the pre-sputter time to 300–400 s for all other analyses. Each analysis consisted of 20 measurement cycles and took ∼10 min to complete, including pre-sputter time. Secondary ion intensities were examined for systematic trends or fluctuations in Ti (or other elements) within each cycle of measurement. To test for potential instrumental contamination within the SIMS, we analyzed a Si wafer as a Ti blank. No instrumental Ti background was detected on the Cameca 7f, whereas the Cameca 6f exhibited a minor Ti background of ∼1 ppm.
resuLts of the caLiBration Calibration using high mass resolution Figure 2 shows the results of the Ti measurements on the titanian quartz grains and NIST glasses in terms of 49Ti/30Si ratios collected using HMR. Measurements from both SIMS instruments are combined. As described in above, crystals from experiment QTiP-39 have wide rims with an average Ti concentration of 813 ppm Ti (Table 1) and small cores with lower Ti/ Si ratios. Only measurements from the volumetrically dominant high Ti rims were used in the SIMS calibration—these exhibit clustered 49Ti/30Si ratios. The other three synthetic quartz samples exhibit only small variations in 49Ti/30Si ratios with low analytical
BEHR ET AL.: SIMS CALIBRATION OF TITANIUM-IN-QUARTZ USING NIST GLASSES
6
−3
x 10
y = 9.372
+/-0.170
6
e-6x
−3
x 10 1
y = 6.264+/-0.0359e-6x
5
5
inset
−3
x 10
0.9
synthetic quartz NIST glass # of analyses
0.8
5
5
0.7 0.6 0.5
11
4
3 5
2
1
inset
−3
x 10
0.9
Ti+/30Si+ * XSiO2
14
49
Ti+/30Si+ * XSiO2
0.4
49
1103
0.8 0.7
0.3
4
4
0.2 0.1 0
4
5
0
50
100
4
3 4
2
8
0.6
6
0.5 0.4
1
150
0.3
y = 5.583+/-0.220e-6x
1
15
y = 3.946+/-0.0402e-6x
0.2
0
see inset
0
100
200
10
0.1 0
300
400 500 Ti (ppm)
0
8
50
600
100
700
150
800
900
figure 2. Analyses of titanian quartz and NIST glass standard reference materials by SIMS using high mass resolution techniques. Titanium concentrations of the NIST glasses are the preferred values from the GEOREM database (Jochum et al. 2005). The 49Ti+/30Si+ ion ratios of the glasses were corrected for the difference in silica content compared to quartz by multiplying by the weight fraction of silica (0.7 for NIST 610 and 0.72 for NIST 612 and NIST 614). The main figure represents all data whereas the inset figure emphasizes the low-Ti materials. Numbers next to the symbols indicate the number of analyses. The solid line in the figures is a least-squares, linear regression for the quartz analyses, whereas the dashed line is a regression through the NIST glasses. Both regressions are constrained to pass through the origin. Only errors in Ti/Si ratio that are larger than the symbol size are shown.
uncertainties. The fragments of NIST 610 and 612 glass (derived from different wafers) show a variation in 49Ti/30Si ratios, of ~10% (relative) whereas low-Ti NIST 614 glass shows a larger % variation. Note that the ion ratios of the glasses were corrected for different silica concentrations.
0
see inset
0
100
discussion Using NIST glasses as standards for measuring Ti in quartz by SIMS NIST glasses define a different calibration for titanium than quartz crystals (Figs. 2 and 3; see also Tables 3 and 4). In Figure 2, the approach of high mass resolution gives a slope for quartz crystals about 67% of the curve constructed using NIST
300
400 500 Ti (ppm)
600
700
800
900
figure 3. Analyses of titanian quartz and NIST glass standard reference materials by SIMS using conventional energy filtering techniques. Titanium concentrations of the NIST glasses are the preferred values from the GEOREM database (Jochum et al. 2005). The 49Ti+/30Si+ ion ratios of the glass were corrected for the difference in silica content compared to quartz by multiplying by the weight fraction of silica (0.7 for NIST 610 and 0.72 for NIST 612 and NIST 614). See Figure 2 caption for explanation and symbols.
glasses, whereas using energy filtering generated a calibration with a slope on the regression curve 71% of that indicated by the glasses. These differing slopes suggest that sputtering (nearly) pure silica results in a lower probability of titanium ion production compared to sputtering the more complex NIST matrices. However, by comparing the ion signals for each matrix during the same analysis session, a correction for this matrix effect can be made as follows:
Calibration using conventional energy filtering Calibration curves for titanium using the energy-filtered titanium ion signals are shown in Figure 3. As in earlier analysis sessions, QTiP-39 showed variation in the Ti signal. The crystal had been polished to remove the earlier SIMS analysis craters and 11 new analyses revealed a 30% variation in Ti between core and rim. Similar to the high mass resolution session, four analyses of the rim showed the highest Ti ion intensities, and only these were used in constructing the calibration plot.
200
5
synthetic quartz NIST glass # of analyses
Tiquartz =
Ti+ 30 Si+ quartz
49
CmNIST
where Tiquartz is the concentration of Ti in the quartz unknown in parts per million, 49Ti+/30Si+ is the ratio of ions measured in the quartz unknown, mNIST is the slope of a linear regression of NIST glasses measured on the same instrument and corrected for silica concentration, and C is a correction factor that accounts for the difference in slope between the NIST glass and synthetic quartz calibrations (i.e., C = 67% for HMR and C = 71% for CEF; see Table 5). Errors in both 49Ti+/30Si+ ratios and Ti concentrations were used to estimate the uncertainty in slope for each regression using the method of York et al. (2004) and propagated into the correction factor, C. The correction factors and corresponding percent error on the calculated Ti concentrations for the two analysis methods (HMR and CEF) are given in Table 5.
BEHR ET AL.: SIMS CALIBRATION OF TITANIUM-IN-QUARTZ USING NIST GLASSES
1104
Table 3. SIMS data from HMR sessions on NIST silicate glasses and titanian synthetic quartz grains Al/30Si
smean
4.76E+00 4.69E+00 4.69E+00 4.89E+00 4.76E+00 4.85E+00 4.90E+00 4.90E+00
4.02E-03 6.05E-03 6.24E-03 3.48E-03 9.42E-03 7.55E-03 8.39E-03 6.99E-03
5.13E+00 5.06E+00 5.05E+00 5.07E+00 5.06E+00 5.15E+00
3.69E-03 4.48E-03 4.80E-03 5.43E-03 5.12E-03 2.97E-03
27
Ti/30Si
Ti/30Si
smean
1.42E-01 1.37E-01 1.37E-01 7.93E-03 7.52E-03 7.78E-03 7.81E-03 7.84E-03
smean 610_A* 2.33E-04 5.23E-04 5.03E-04 2.61E-05 2.82E-05 2.33E-05 2.22E-05 2.64E-05
5.65E-03 5.57E-03 5.57E-03 5.87E-03 5.59E-03 5.73E-03 5.78E-03 5.81E-03
1.74E-05 1.82E-05 1.90E-05 1.55E-05 2.16E-05 2.07E-05 1.91E-05 2.14E-05
1.61E-01 1.55E-01 1.55E-01 1.74E-01 1.72E-01 1.81E-01
610_B 1.74E-04 4.07E-04 4.04E-04 3.79E-04 4.50E-04 1.21E-04
6.07E-03 5.90E-03 5.88E-03 6.04E-03 6.00E-03 6.19E-03
1.29E-05 2.23E-05 2.65E-05 2.13E-05 2.14E-05 2.09E-05
4.99E-04 4.86E-04 4.90E-04 4.88E-04 4.79E-04 5.38E-04 4.78E-04
5.39E-06 5.05E-06 4.63E-06 6.51E-06 4.80E-06 5.62E-06 4.93E-06
48
49
4.98E+00 4.97E+00 4.97E+00 4.98E+00 4.98E+00 4.97E+00 4.97E+00
4.53E-03 3.13E-03 3.43E-03 3.91E-03 3.96E-03 4.13E-03 3.97E-03
9.80E-02 9.73E-02 9.72E-02 9.72E-02 9.68E-02 9.64E-02 9.58E-02
612_A 2.63E-04 2.63E-04 2.80E-04 3.03E-04 2.26E-04 2.81E-04 2.92E-04
5.04E+00 5.05E+00 5.02E+00 5.04E+00 5.00E+00 4.97E+00 4.99E+00 5.04E+00
2.03E-03 3.56E-03 2.61E-03 3.38E-03 2.94E-03 3.79E-03 3.78E-03 2.31E-03
9.71E-02 9.64E-02 1.00E-01 9.70E-02 7.23E-04 7.02E-04 7.21E-04 6.86E-04
612_B 1.54E-04 1.59E-04 5.27E-05 1.42E-04 5.89E-06 5.07E-06 5.61E-06 6.27E-06
5.31E-04 5.45E-04 4.95E-04 5.34E-04 5.32E-04 5.14E-04 5.30E-04 4.98E-04
4.83E-06 4.66E-06 5.84E-06 5.55E-06 5.95E-06 4.00E-06 6.26E-06 4.90E-06
5.02E+00 5.01E+00 5.01E+00 5.03E+00 5.01E+00 5.01E+00 5.02E+00 5.02E+00
2.87E-03 4.70E-03 3.36E-03 4.03E-03 4.41E-03 3.18E-03 3.98E-03 3.59E-03
9.30E-02 9.26E-02 9.27E-02 9.29E-02 9.20E-02 9.20E-02 9.25E-02 9.26E-02
614_A 2.47E-04 2.52E-04 2.65E-04 2.24E-04 2.73E-04 2.52E-04 2.66E-04 2.49E-04
2.13E-05 2.02E-05 3.01E-05 2.30E-05 3.96E-05 3.15E-05 2.72E-05 3.58E-05
1.24E-06 1.66E-06 2.14E-06 1.54E-06 2.30E-06 1.87E-06 2.62E-06 2.21E-06
2.51E-01 1.92E-01 2.09E-01 1.91E-01
1.44E-03 1.41E-03 1.35E-03 1.33E-03
QTiP 39_A 6.68E-02 9.90E-05 5.67E-02 7.91E-05 5.21E-02 8.50E-05 6.00E-02 1.06E-04
5.13E-03 4.36E-03 4.01E-03 4.59E-03
9.12E-06 1.20E-05 9.54E-06 1.26E-05
4.76E-01 3.80E-01 2.97E-01 2.77E-01
1.20E-03 1.23E-03 1.31E-03 1.43E-03
QTiP 39_B 6.62E-02 1.29E-04 6.52E-02 1.09E-04 6.56E-02 1.12E-04 6.66E-02 1.40E-04
5.09E-03 5.03E-03 5.07E-03 5.13E-03
1.14E-05 9.45E-06 1.29E-05 1.67E-05
5.18E-01 4.99E-01 3.80E-01 3.51E-01 3.23E-01
3.14E-03 2.57E-03 2.25E-03 2.12E-03 2.16E-03
QTiP 38_A 3.05E-02 4.51E-05 2.98E-02 5.76E-05 2.94E-02 5.22E-05 3.20E-02 5.19E-05 3.02E-02 5.47E-05
2.37E-03 2.29E-03 2.27E-03 2.47E-03 2.32E-03
6.64E-06 4.22E-06 6.44E-06 7.35E-06 5.36E-06
5.35E-02 2.21E-02 5.03E-02 4.81E-02 4.89E-02
2.17E-03 3.33E-04 2.05E-03 2.00E-03 1.99E-03
QTiP 14_A 8.42E-03 1.23E-05 8.36E-03 1.37E-05 8.43E-03 1.18E-05 8.52E-03 1.48E-05 8.57E-03 1.50E-05
6.44E-04 6.56E-04 6.47E-04 6.46E-04 6.52E-04
3.04E-06 3.22E-06 3.68E-06 3.44E-06 3.47E-06
7.17E-02 7.56E-02
1.10E-03 1.04E-03
1.48E-03 1.56E-03
QTiP 7_A 4.15E-06 5.08E-06
1.27E-04 1.34E-04
1.69E-06 1.37E-06
Al/30Si 7.09E-02 8.66E-02 7.62E-02 27
smean 1.17E-03 1.19E-03 1.01E-03
48 Ti/30Si 1.47E-03 1.48E-03 1.45E-03
smean 4.04E-06 5.16E-06 5.98E-06
49 Ti/30Si 1.25E-04 1.22E-04 1.22E-04
smean 1.47E-06 1.44E-06 1.31E-06
QTiP 7_B 6.59E-02 1.21E-03 9.35E-04 4.59E-06 7.84E-05 1.02E-06 6.24E-02 1.05E-03 1.01E-03 5.20E-06 8.25E-05 1.40E-06 7.00E-02 9.98E-04 1.50E-03 5.02E-06 1.28E-04 1.80E-06 7.39E-02 1.18E-03 1.48E-03 5.20E-06 1.22E-04 1.46E-06 7.60E-02 1.23E-03 1.49E-03 5.03E-06 1.25E-04 1.55E-06 * Letters after sample number signify measurements on an individual crystal or glass fragment.
Table 4. SIMS data from CEF sessions on NIST silicate glasses and titanian synthetic quartz grains Ti/30Si
smean
Ti/30Si
smean
n/a n/a n/a n/a
smean 610_A* n/a n/a n/a n/a
4.73E-03 4.80E-03 4.73E-03 4.77E-03
6.94E-05 7.11E-05 4.87E-05 5.67E-05
3.49E-03 3.48E-03 3.54E-03 3.49E-03
5.92E-05 6.65E-05 1.03E-04 6.97E-05
4.38E-04 4.07E-04 3.96E-04 4.01E-04
2.27E-05 1.28E-05 2.10E-05 1.94E-05
n/a n/a n/a n/a
612_A n/a n/a n/a n/a
3.02E-04 3.18E-04 2.76E-04 3.25E-04
1.56E-05 1.56E-05 1.91E-05 2.01E-05
3.92E-05 3.74E-05 3.68E-05 3.49E-05
2.62E-06 2.18E-06 2.61E-06 2.28E-06
n/a n/a n/a n/a
614_A n/a n/a n/a n/a
3.19E-05 2.67E-05 2.85E-05 2.79E-05
2.62E-06 1.97E-06 1.95E-06 9.84E-06
3.68E-03 3.78E-03 3.03E-03 3.42E-03 3.46E-03 3.46E-03 4.36E-03 4.24E-03 4.16E-03 3.70E-03 4.19E-03
3.67E-05 6.31E-05 5.04E-05 3.35E-05 3.34E-05 3.09E-05 3.76E-05 4.58E-05 3.89E-05 3.05E-05 3.70E-05
3.69E-02 3.77E-02 3.03E-02 3.44E-02 3.44E-02 3.45E-02 4.36E-02 4.26E-02 4.18E-02 3.73E-02 4.21E-02
QTiP-39A 4.12E-04 5.57E-04 4.10E-04 2.17E-04 2.13E-04 2.52E-04 2.91E-04 2.42E-04 2.64E-04 2.07E-04 2.40E-04
2.78E-03 2.84E-03 2.29E-03 2.60E-03 2.57E-03 2.58E-03 3.25E-03 3.18E-03 3.11E-03 2.79E-03 3.15E-03
3.48E-05 4.73E-05 3.39E-05 2.51E-05 2.33E-05 2.84E-05 3.55E-05 2.84E-05 3.21E-05 2.98E-05 3.65E-05
2.00E-03 1.98E-03 2.00E-03 2.08E-03 2.00E-03 2.01E-03
2.80E-05 3.20E-05 3.70E-05 3.16E-05 1.85E-05 2.20E-05
2.01E-02 1.98E-02 2.01E-02 2.08E-02 2.01E-02 2.02E-02
QTiP-38A 1.08E-04 9.46E-05 1.22E-04 1.07E-04 7.90E-05 7.65E-05
1.50E-03 1.47E-03 1.49E-03 1.59E-03 1.52E-03 1.49E-03
2.41E-05 1.91E-05 2.78E-05 3.17E-05 1.78E-05 1.37E-05
5.77E-04 5.79E-04 5.79E-04 5.77E-04 5.65E-04 5.51E-04 5.60E-04 5.66E-04 6.00E-04 6.36E-04 5.64E-04
5.64E-06 7.20E-06 6.75E-06 7.96E-06 6.99E-06 8.62E-06 7.32E-06 7.43E-06 7.09E-06 7.01E-06 7.19E-06
5.80E-03 5.83E-03 5.82E-03 5.73E-03 5.67E-03 5.55E-03 5.67E-03 5.69E-03 5.98E-03 6.30E-03 5.60E-03
QTiP-14A 3.36E-05 4.19E-05 4.71E-05 5.79E-05 4.05E-05 5.08E-05 4.91E-05 4.22E-05 4.39E-05 4.62E-05 4.25E-05
4.32E-04 4.33E-04 4.34E-04 4.23E-04 4.17E-04 4.15E-04 4.23E-04 4.21E-04 4.47E-04 4.70E-04 4.24E-04
6.15E-06 5.80E-06 6.41E-06 8.35E-06 6.80E-06 7.44E-06 6.88E-06 5.80E-06 6.54E-06 6.92E-06 5.08E-06
47
Ti/30Si
48
49
QTiP-7A 1.20E-04 2.63E-06 1.12E-03 9.72E-06 8.48E-05 2.56E-06 9.06E-05 2.64E-06 8.96E-04 3.59E-05 6.66E-05 1.03E-05 1.07E-04 2.67E-06 1.05E-03 8.37E-06 7.98E-05 2.93E-06 1.17E-04 2.54E-06 1.14E-03 1.07E-05 8.69E-05 2.43E-06 1.22E-04 2.71E-06 1.14E-03 9.89E-06 8.71E-05 2.46E-06 * Letters after sample number signify measurements on an individual crystal or glass fragment.
BEHR ET AL.: SIMS CALIBRATION OF TITANIUM-IN-QUARTZ USING NIST GLASSES Table 5. Summary of calibration and correction factors for HMR and CEF Analysis method HMR CEF
Material
Slope of linear Correction Error in Ti regression constrained factor (C) concentrations –6 through origin (x10 ) Synthetic quartz 6.264 ± 0.0359 0.668 ± 0.0127 3.8% NIST glasses 9.372 ± 0.170 Synthetic quartz 3.946 ± 0.0402 0.707 ± 0.0288 8.2% NIST glasses 5.583 ± 0.220
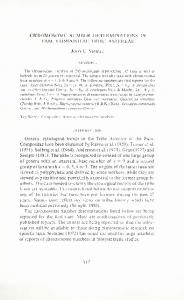
Potential issues with using NIST glasses as standards for quartz We note that when regressions are not constrained to pass through the origin, the NIST glasses indicate negative intercepts for both HMR and CEF analyses. These imply a subtle non-linearity among the three samples. There could be many causes for an artificially high signal in SIMS (Table 2). When considering Figure 2, we must evaluate the contribution from complex molecular ions, or from doubly charged isotopic species (such as 96Mo2+) that were not filtered by the mass spectrometer at high mass resolving power (Table 2). In Figure 3, we need to consider simple molecular ions as well as the multiply charged species. To test for the presence of such contaminating species, we obtained a mass spectrum of NIST 610 glass using energy filtering (75V ± 20 eV ions), which effectively eliminates any molecular ions with three or more atoms but allows some dimers and multiply charged ions to survive (Fig. 4). The mass spectrum shows several multiply charged elemental species and singly charged molecular ions. Note that the anomalously high count rates at mass/charge = 46 indicate the presence of 46Ca and/or 30 16 Si O along with 46Ti. Similarly, the high intensity at mass/ charge = 44 likely represents the presence of 28Si16O as well as 44 Ca+. However, we can find no evidence for any species that could affect our 49Ti measurements that would not be removed by operation at high mass resolution, with one exception. If the 44
16
+
Si O
107 42 41
K
46
+
45
Ca
+
43
Ti
+
46
+
48 +
Ca
Sc
Ti
+
48
+
Ca
+
51
Ca
50 47 ++
105
Ti
Ti
50
+
V
+
+ +
Cr
87
Sr
49
Ti
+
++ 89
Y
++
Ca ++
++
++
Nb
Zr
93
91
2
83
Ca
++
85
124
Ca
2
87
+++
3
Ca
103
2
,
Intensity (counts/s)
101
10-1 40
41
42
43
44
Table 6. Ion ratios and concentration ratios for titanium in NIST 610 and NIST 612 Source 610/612 ratio 11.1 This study 49Ti, HMR 11.5 This study 49Ti, CEF 47 11.0 This study Ti, HMR 47 11.6 This study Ti, CEF Hinton (1999) CEF 11.3 Pearce et al. (1997) 9.0* Gao et al. (2002) 9.9* GEOREM (Jochum et al. 2005) 9.9 * Concentration ratios. Other measurements are Ti/Si ion ratios using either high mass resolution (HMR) or conventional energy filtering (CEF).
hydrides of 48Ti and 48Ca are abundant (48TiH, 48CaH), they would not be resolvable from 49Ti unless the instrument was operated at much higher mass resolving power (Table 2). If these were significant interferences, however, we would expect any 48TiH contributing to 49Ti to be proportionate to the 48Ti present, and not result in a non-linearity. We would expect that CaH would represent a constant addition for all of the NIST glasses because of the constant Ca content in the NIST matrix, whereas it appears that only the titanium ion signal for NIST 610 is high relative to the other glasses. We tested for the presence of the hydride ion by collecting secondary ion intensities for 47Ti and 49Ti on the NIST glasses. The addition of a hydride signal for these two isotopes would not be the same in the different NIST glasses, but the ratio of 49Ti/30Si in NIST 610 to 49Ti/30Si in NIST 612 are nearly identical to the ratio of 47Ti/30Si in NIST 610 to 47Ti/30Si in NIST 612 whether high mass resolution or energy filtering is used. The ratios measured in this study match with an earlier SIMS study (Hinton 1999), but disagree with other work on these materials (Pearce et al. 1997; Gao et al. 2002) as shown in Table 6. Given the lack of evidence for significant interferences on the titanium ion signals, the negative intercepts indicated by the NIST glasses is explained simply by the uncertainty in their bulk compositions (Table 1). Using high mass resolution or conventional energy filtering
+
Ca
28
1105
45
46
47
48
49
50
51
Mass/Charge (daltons)
figure 4. Mass spectrum of NIST 610 glass between 41K and 51V. Several doubly charged peaks are present at half-masses (e.g., 89Y appears at mass/charge = 44.5), but no significant doubly charged ions are present that might influence 47Ti or 49Ti, suggesting undetectable contribution from such interferences in NIST 610. Note the small (but reproducible) peak at mass/charge 41.33 believed to be from triply charged 40Ca244Ca+++.
Should one interested in using SIMS to measure titanium in quartz use energy filtering or high mass resolution? For the purpose of studying, for example, low-temperature mylonitic quartz containing just a few parts per million titanium, it is most prudent to unambiguously remove the molecular ions by high mass resolution techniques (Kohn and Northrup 2009). However, for relatively Ti-rich quartz (e.g., >20 ppm Ti), the amount of interfering molecular ions sputtered with high energies appears to be low enough to allow high-quality analyses to be made (Vazquez et al. 2009). The advantage to using energy filtering is that the analyses are somewhat easier for occasional users of the SIMS than when operating at high mass resolving power. Regardless of the approach chosen, it is important to monitor other elements (such as Al and Ca) to make sure that only quartz is being analyzed.
concLuding reMarks The NIST 6XX glass standards can be used to quantify the Ti concentrations of quartz if the matrix effect between these glasses and nearly pure quartz can be corrected. We provide correction factors to the NIST glass calibration curve that can be used to
1106
BEHR ET AL.: SIMS CALIBRATION OF TITANIUM-IN-QUARTZ USING NIST GLASSES
calibrate SIMS for the analysis of quartz unknowns, using either high mass resolution or conventional energy filtering techniques. The corresponding errors in the calculated Ti concentrations are 3.8 and 8.2% for HMR and CEF techniques, respectively. When applying the correction factors, these errors should be propagated with the uncertainties in the slope of the NIST calibration curve, and added to the measurement errors in Ti/Si ion ratios in the unknown material. If greater precision is necessary, however, we recommend that standards match the chemistry of the unknown material to minimize errors in calibration.
acknoWLedgMents W.M.B. acknowledges NSF (EAR-0809443) awarded to J.P. Platt. R.L.H. acknowledges NSF (EAR-0622775) and the efforts of Lynda Williams for support of the ASU SIMS facilities and John Eiler and Yunbin Guan for supporting research by R.L.H. during a sabbatical stay at Caltech. J.B.T. acknowledges NSF for funds awarded to Bruce Watson (EAR-0440228) that supported research on Ti solubility in quartz. Graham Layne and Richard Hinton are appreciated for providing thorough reviews that led to major improvements to this manuscript.
references cited Behr, W.M. and Platt, J.P. (2011) A naturally constrained stress profile through the middle crust in an extensional terrane. Earth and Planetary Science Letters, 303, 181–192. Behrmann, J. and Mainprice, D. (1987) Deformation mechanisms in a high temperature quartz-feldspar mylonite: evidence for superplastic flow in the lower continental crust. Tectonophysics, 140, 297–305. Boyd, F. (1973) A pyroxene geotherm. Geochimica et Cosmochimica Acta, 37, 2533–2538. Cherniak, D.J., Watson, E.B., and Wark, D.A. (2007) Ti diffusion in quartz. Chemical Geology, 236, 65–74. Gao, S., Liu, X., Yuan, H., Hattendorf, B., Gunther, D., Chen, L., and Hu, S. (2002) Determination of forty two major and trace elements in USGS and NIST SRM glasses by laser ablation-inductively coupled plasma-mass spectrometry. Geostandards Newsletter, 26, 181–196. Hervig, R., Mazdab, F., Williams, P., Guan, Y., Huss, G., and Leshin, L. (2006) Useful ion yields for Cameca IMS 3f and 6f SIMS: Limits on quantitative analysis. Chemical Geology, 227, 83–99. Hinton, R. (1999) NIST SRM 610, 611 and SRM 612, 613 multi-element glasses: Constraints from element abundance ratios measured by microprobe techniques. Geostandards Newsletter, 23, 197–207. Horn, I., Hinton, R., Jackson, S., and Longerich, H. (1997) Ultra-trace element analysis of NIST SRM 616 and 614 using laser ablation microprobe-inductively coupled plasma-mass spectrometry (LAM-ICP-MS): a comparison with secondary ion mass spectrometry (SIMS). Geostandards Newsletter, 21, 191–203. Jochum, K., Nohl, U., Herwig, K., Lammel, E., Stoll, B., and Hofmann, A. (2005)
GeoReM: A new geochemical database for reference materials and isotopic standards. Geostandards Newsletter, 29, 333–338. Kane, J. (1998) A history of the development and certification of NIST glass SRMs 610-617. Geostandards Newsletter, 22, 7–13. Kohn, M. and Northrup, C. (2009) Taking mylonites’ temperatures. Geology, 37, 47. Norman, M., Griffin, W., Pearson, N., Garcia, M., and O’Reilly, S. (1998) Quantitative analysis of trace element abundances in glasses and minerals: a comparison of laser ablation inductively coupled plasma mass spectrometry, solution inductively coupled plasma mass spectrometry, proton microprobe and electron microprobe data. Journal of Analytical Atomic Spectrometry, 13, 477–482. Pearce, N., Perkins, W., Westgate, J., Gorton, M., Jackson, S., Neal, C., and Chenery, S. (1997) A compilation of new and published major and trace element data for NIST SRM 610 and NIST SRM 612 glass reference materials. Geostandards Newsletter, 21, 115–144. Rocholl, A., Simon, K., Jochum, K., Bruhn, F., Gehann, R., Kramar, U., Luecke, W., Molzahn, M., Pernicka, E., and Seufert, M. (1997) Chemical characterisation of NIST silicate glass certified reference material SRM 610 by ICP-MS, TIMS, LIMS, SSMS, INAA, AAS and PIXE. Geostandards Newsletter, 21, 101–114. Shimizu, N., Semet, M., and Allegre, C. (1978) Geochemical applications of quantitative ion-microprobe analysis. Geochimica et Cosmochimica Acta, 42, 1321–1334. Spear, F. and Wark, D. (2009) Cathodoluminescence imaging and titanium thermometry in metamorphic quartz. Journal of Metamorphic Geology, 27, 187–205. Stipp, M. and Kunze, K. (2008) Dynamic recrystallization near the brittle-plastic transition in naturally and experimentally deformed quartz aggregates. Tectonophysics, 448, 77–97. Thomas, J., Watson, E.B., Spear, F., Shemella, P., Nayak, S., and Lanzirotti, A. (2010) TitaniQ under pressure: the effect of pressure and temperature on the solubility of Ti in quartz. Contributions to Mineralogy and Petrology, 160, 1–17. Vazquez, J., Kyriazis, S., Reid, M., Sehler, R., and Ramos, F. (2009) Thermochemical evolution of young rhyolites at Yellowstone: Evidence for a cooling but periodically replenished postcaldera magma reservoir. Journal of Volcanology and Geothermal Research, 188, 186–196. Wark, D. and Watson, E. (2006) TitaniQ: a titanium-in-quartz geothermometer. Contributions to Mineralogy and Petrology, 152, 743–754. York, D., Evensen, N., Martinez, M., and Delgado, J. (2004) Unified equations for the slope, intercept, and standard errors of the best straight line. American Journal of Physics, 72, 367–375. Zinner, E. and Crozaz, G. (1986) A method for the quantitative measurement of rare earth elements in the ion microprobe. International Journal of Mass Spectrometry and Ion Processes, 69, 17–38.
Manuscript received septeMber 25, 2010 Manuscript accepted February 17, 2011 Manuscript handled by Grant henderson