Sarah Verhulst, Christopher A. Shera, James M. Harte, and Torsten Dau ..... [4] Kemp DT, Chum RA (1980) Properties of the generator of stimulated otoacoustic ...
Can a Static Nonlinearity Account for the Dynamics of Otoacoustic Emission Suppression? Sarah Verhulst, Christopher A. Shera, James M. Harte, and Torsten Dau Citation: AIP Conference Proceedings 1403, 257 (2011); doi: 10.1063/1.3658095 View online: http://dx.doi.org/10.1063/1.3658095 View Table of Contents: http://scitation.aip.org/content/aip/proceeding/aipcp/1403?ver=pdfcov Published by the AIP Publishing Articles you may be interested in Transient‐ and Tone‐Evoked Otoacoustic Emissions in Three Species AIP Conf. Proc. 1403, 307 (2011); 10.1063/1.3658103 Otoacoustic Estimates of Cochlear Tuning: Testing Predictions in Macaque AIP Conf. Proc. 1403, 286 (2011); 10.1063/1.3658099 Generation of Distortion Product Otoacoustic Emissions in the Gerbil Cochlea AIP Conf. Proc. 1403, 273 (2011); 10.1063/1.3658097 Quasi‐Linear Cochlear Responses to Noise Can Result from Instantaneous Nonlinearities AIP Conf. Proc. 1403, 218 (2011); 10.1063/1.3658089 Ear-canal acoustic admittance and reflectance effects in human neonates. I. Predictions of otoacoustic emission and auditory brainstem responses J. Acoust. Soc. Am. 113, 389 (2003); 10.1121/1.1523387
Reuse of AIP Publishing content is subject to the terms at: https://publishing.aip.org/authors/rights-and-permissions IP: 107.173.135.45 On: Sat, 20 Aug 2016 12:41:29
Can a Static Nonlinearity Account for the Dynamics of Otoacoustic Emission Suppression? Sarah Verhulst∗, Christopher A. Shera† , James M. Harte∗∗ , and Torsten Dau∗ ∗
Centre for Applied Hearing Research, Technical University of Denmark † Eaton-Peabody Laboratories, Harvard Medical School ∗∗ Institute of Digital Healthcare, University of Warwick
Abstract. This study investigates whether time-dependent compression mechanisms in the cochlea are necessary to explain dynamic properties of otoacoustic emissions (OAEs). Dynamic properties of click-evoked OAEs (CEOAEs) have been observed in temporal suppression; the effect where the CEOAE magnitude is reduced when a click is presented less than 10 ms before the test click. A timedomain model of the cochlea that represented the basilar membrane (BM) as a cascade of coupled bandpass filters was used to investigate the cochlear origin of temporal suppression in CEOAEs. The model, implemented with a time-invariant nonlinearity, was able to simulate temporal suppression, but was unable to account for the exact time scale and magnitude of the effect. The results suggest that temporal overlap of BM impulse responses can account for suppression in CEOAEs, but that an additional time-dependent cochlear gain mechanism may be needed to account the high suppression maxima at inter-click intervals larger than zero. Keywords: otoacoustic emission, CEOAE, cochlear nonlinearity, cochlear model PACS: 43.64.Jb, 43.64.Kc
INTRODUCTION Click-evoked otoacoustic emission (CEOAE) levels grow linearly for clicks below 40– 60 dB peSPL and saturate for higher input levels; a property that is reflected in the CEOAE level-curve [2]. Dynamic, or time-dependent, features of CEOAE-level compression have been investigated by means of temporal suppression. This is the reduction in CEOAE level that is observed when presenting a suppressor click close in time (e.g., 0–10 ms) to a test click [3–5, 12]. The amount of suppression depends on the inter-click interval (ICI), the level of the suppressor and the subject under test [3, 12]. The time scale of temporal suppression is characterized by an increase of suppression for ICIs smaller than 2-4 ms. Suppression reaches a maximum, with levels that can exceed 6 dB at ICIs of 2-4 ms, where after suppression decreases and disappears for ICIs longer than 10 ms [3, 12]. This study investigates the mechanisms underlying dynamic features of CEOAE compression by simulating temporal suppression with a nonlinear time-domain model of the cochlea. Temporal suppression can either originate in the cochlea through dynamic properties of the underlying basilar-membrane (BM) compression mechanism, or can result from the coupling of several local BM input-output (I/O) functions, each with a static nonlinearity. This study incorporates local static, or time-invariant, BM I/O functions into a coupled (i.e., through the cochlear fluids) cochlear model that describes the whole cochlear partition. The model was used to test the hypothesis that the dynamics observed in the CEOAE magnitude are due to the coupling of several time-invariant BM What Fire is in Mine Ears: Progress in Auditory Biomechanics AIP Conf. Proc. 1403, 257-263 (2011); doi: 10.1063/1.3658095 © 2011 American Institute of Physics 978-0-7354-0975-0/$30.00
257 Reuse of AIP Publishing content is subject to the terms at: https://publishing.aip.org/authors/rights-and-permissions IP: 107.173.135.45 On: Sat, 20 Aug 2016 12:41:29
-140
A
-8
10
100 dB ybm [dB re.1]
-180
-10
ybm [m]
B
-160
10
-12
-200 -220 -240
10
-260 at CF 1 oct below CF 1 oct above CF
-280 10 dB 5 10 15 20 25 Distance from stapes [mm]
0
1
C
-300
35
0-60 dB 70 dB 80 dB 90 dB
0.5
20
40
D
60 L [dB SPL]
80
100
Recordings 1e-3 0 - 60 dB 65 dB
0
Simulations POAE/Pstim
Normalized ybm
30
POAE/Pstim
-14
10
-0.5
-1 0
5
10 15 Time [ms]
20
25
10
0.1e-3
70 dB 75 dB 80 dB 85 dB
11
12 Time [ms]
13
14
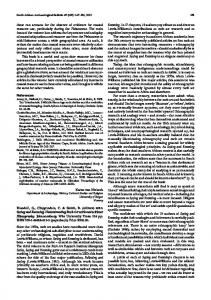
FIGURE 1. (A) longitudinal y BM functions for stimulation with a 1-kHz pure tone with levels between 10 and 100 dB SPL in steps of 10 dB. (B) I/O functions of y BM simulated at CF (1-kHz location) and at one octave above and below CF. The stimulus was a 1-kHz pure tone with levels between 10 and 100 dB SPL. (C) yBM at the 1-kHz CF location, for clicks ranging between 0 and 90 dB peSPL. The impulse responses were normalized by the pressure at the stapes of the cochlea. (D) Recorded (for S4 [12]; top) and simulated CEOAE waveforms (bottom) for different click intensities.
I/O functions in the cochlea, and not to dynamics in the I/O functions itself.
MODEL DESCRIPTION The developed transmission-line model of the cochlea used the linear traveling-wave equation developed by Zweig [14]. An instantaneous nonlinearity was added to account for the compressive nonlinearity observed in recorded BM impulse responses (IRs) [7]. These data are characterized by a near-invariance of the IR fine-structure when increasing stimulus intensity [7, 9]. A frequency-domain model that describes the leveldependent BM IR behavior through a careful placement of the poles of the BM admittance Y (s) [9] was adapted and extrapolated to all frequencies along the cochlear partition. Middle-ear transmission was modeled using the forward and reverse middle-ear gain functions [6]. The equations were solved over time using the 4th-order Runge-Kutta method [1]. Reverse traveling waves (i.e., OAEs) were simulated by adding random impedance irregularities (i.e., reflection sources) along the cochlear partition [15]. A detailed analytical description of the model and the parameter values is given in [11, 13], and the main characteristics of the model are summarized in Fig. 1. Figure 1A shows simulated longitudinal BM displacement (yBM ) patterns for pure tones of different intensities. The patterns become broader and their maxima move basally as stimulus level
258 Reuse of AIP Publishing content is subject to the terms at: https://publishing.aip.org/authors/rights-and-permissions IP: 107.173.135.45 On: Sat, 20 Aug 2016 12:41:29
is increased. These simulations are in good agreement with empirical longitudinal BMvelocity patterns [8]. Figure 1B shows derived BM I/O functions for pure-tone stimulation. The slope of the I/O functions was 0.4 dB/dB for stimulation levels between 30 and 95 dB SPL. One octave above and below the characteristic frequency (CF), linear behavior of the I/O functions was observed. Figure 1C shows local BM IRs (at 1 kHz CF) as a function of excitation level. The vertical trajectory of the double pole in Y (s) with stimulus intensity ensures that the IR fine-structure in Fig 1C is near invariant with stimulus level. The simulated BM IRs show increased compression and a shift of the envelope maxima towards shorter latencies when the stimulus intensity is increased. These results are in qualitative agreement with recorded BM IRs [7], and demonstrate that the model nonlinearity was implemented as desired. Figure 1D shows simulated and recorded CEOAEs for different stimulus intensities. It is worth noting that the amplitude of the recorded CEOAE is larger than the amplitude of the simulated CEOAE.
EXPERIMENTAL PARADIGM The response to the combined double-click stimulus (i.e., suppressor and test click separated by an ICI) consists of a CEOAE to the suppressor click, a CEOAE to the test click and a nonlinear component that depends on the ICI. There exists a technique that removes the CEOAE component to the suppressor click from the double-click response, such that the CEOAE component to the test click and the nonlinear component due to the ICI is kept [3, 4, 12]. The resulting response is the derived suppressed (DS) CEOAE and was obtained by presenting two stimulus configurations (see Fig. 2A). In the first condition (i.e., DC), two 80-μ s-long condensation clicks (i.e., the suppressor and test click) were presented with a specific ICI. In the second condition (i.e., DCI), a condensation and rarefaction click, separated by the same ICI, were presented. The DS response was obtained by subtracting the DCI response from the DC response and by halving the resulting response. The unsuppressed response (US) was obtained by presenting a condensation click with the level of the test click. Suppression was calculated as the root-mean-square (rms) level difference between the DS and US response, and was calculated for the 6 to 18 ms window of the CEOAE. Simulated suppression was compared to the empirical suppression results of the shortlatency CEOAE of subject S4 [12]. Additional details on the stimulus presentation and data analysis of the empirical results were presented elsewhere [12]. The time scale of temporal suppression was investigated by varying the ICI between 0 and 8 ms for a testclick level (Lt ) of 65 dB peSPL. The suppressor level Ls was first chosen to equal Lt , and later to be 3 and 6 dB lower.
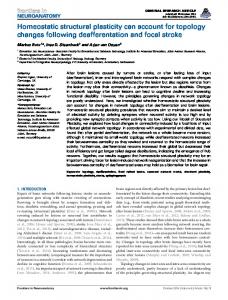
RESULTS Figure 2B shows recorded and simulated temporal suppression patterns for L t = 65 dB peSPL and three Ls conditions. Recorded suppression for Ls = Lt showed a maximum of 9 dB peSPL at 2.5 ms, where after suppression decreased and disappeared at 8 ms. Suppression maxima moved to longer ICIs as the level of the suppressor decreased (i.e., 3 and 4 ms for Ls of 62 and 59 dB peSPL), and suppression decreased with decreasing suppressor levels. Similar temporal suppression patterns have been observed for other subjects [3, 12]. Simulated temporal suppression showed maxima at an ICI of 0 ms, and
259 Reuse of AIP Publishing content is subject to the terms at: https://publishing.aip.org/authors/rights-and-permissions IP: 107.173.135.45 On: Sat, 20 Aug 2016 12:41:29
10
B
Recordings Simulations Ls = Lt
Suppression [dB]
8
Ls = Lt - 3 dB Ls = Lt - 6 dB
6 4 2 0 0
C
-35
Recordings
US 8 ms 6 ms 4 ms 2 ms 0 ms
Level [dB peSPL]
-40 -45 -50 -55 -60
3
4 5 ICI [ms]
6
7
Simulations
8
US 8 ms 6 ms 4 ms 2 ms 1 ms
-45 -50 -55 -60 -65
-65 -70
D
2
-40
Level [dB peSPL]
-35
1
-70 1
1.5
2 2.5 Frequency [kHz]
3
1
1.5 2 2.5 Frequency [kHz]
3
FIGURE 2. (A) Schematic of the measurement paradigm to obtain the unsuppressed (US) and suppressed CEOAEs. The US condition was obtained using a condensation test click (T). DC and DCI resulted from stimulation with a condensation suppressor (S) and test click (T); and a condensation S and rarefaction T click, respectively. (B) Temporal suppression for subject S4 [12] for Lt = 65 dB peSPL (open symbols). Simulated temporal suppression was overlaid (filled symbols). Note that the suppression patterns were offset by 0.1 ms for visual clarity. (C) Magnitude spectra of the unsuppressed (US) and derived suppressed (DS) CEOAE for different ICIs of subject S4 [12]. (D) Simulated magnitude spectra of the US and DS CEOAE for different ICIs.
decreased to zero more rapidly than the experimental results. Suppression levels for ICIs different from zero were 5–6 dB lower than the experimentally obtained suppression levels. The model simulated lower suppression levels for lower-level suppressors, but was not able to account for a shift of suppression maxima towards higher ICIs as suppressor level decreased. Figure 2C and D show frequency spectra of the unsuppressed (US) and derived suppressed (DS) CEOAE for different ICI conditions. The recorded spectra show a pronounced frequency dependence of temporal suppression. As the ICI increased, the spectral components changed from a suppressed state to an unsuppressed state. This release of suppression occurred at shorter ICIs for high-frequency components than for low-frequency components (i.e., 2.7 kHz at an ICI of 4 ms, 1.7 kHz at 6 ms, 1 kHz at 8 ms or more). The simulated results were able to demonstrate a similar release of temporal suppression (i.e., 2.5 at an ICI of 4 ms, 1.7 kHz at 6 ms, 1 kHz at 8 ms or more). However, much like the results in Fig. 2 B, the amount of suppression in the peaks of the spectra was smaller for the simulated than for the recorded results.
260 Reuse of AIP Publishing content is subject to the terms at: https://publishing.aip.org/authors/rights-and-permissions IP: 107.173.135.45 On: Sat, 20 Aug 2016 12:41:29
DISCUSSION The presented CEOAE data relate to the behavior of recorded local BM impulse responses in two ways. The duration of recorded local BM IRs [7] is shorter for high than for low frequencies. This suggests that any interaction between two clicks, closely spaced in time, would occur only for short ICIs at high-frequency IRs. The demonstrated release of temporal suppression at shorter ICIs for high-frequency components than for low-frequency components supports the relation to local BM IRs. Secondly, as stimulus level increases, local BM IRs keep their temporal fine-structure, while their envelope maxima shift to shorter latencies [7, 9]. When presenting a lower-level suppressor shortly before a higher-level test click, maximal interaction between their local IRs is predicted to occur at longer ICIs than for equi-level suppressor and test clicks. This would lead to suppression maxima that move to longer ICIs as the suppressor level is decreased; a feature that was observed in Fig. 2B. These observations suggest that the cochlear mechanism underlying temporal suppression may be explained by an interaction of local BM IRs; a hypothesis that has been brought up earlier [3–5, 12]. In this hypothesis, local BM IRs are described by a static, or time-invariant, nonlinearity. The presented model aimed at testing whether a cascade of coupled BM filters with time-invariant nonlinearities could be the basis of temporal suppression in CEOAEs. The model was able to simulate the release of temporal suppression and accounted for decreasing suppression with decreasing suppressor level. The model was, however, unable to account for the high-level suppression maxima (i.e., 9 dB peSPL) at ICIs larger than zero; a key feature of temporal suppression. The model is a useful tool for investigating temporal suppression and simulates longitudinal BM vibrations, level-dependent features of BM IRs and CEOAEs with realistic waveform and level-curve shapes. Assuming that these model features are sufficient, our results suggest that the static nonlinearity incorporated in the coupled cochlear model cannot fully account for dynamics in CEOAEs. Suppression maxima at ICIs longer than zero with suppression levels that exceed 6 dB would in this framework require a timedependent gain boost in the nonlinearity. From the time scale and frequency dependence of the empirical suppression results, the adaptive nonlinearity is expected to be effective for the duration of the IR of the first presented suppressor click. A temporal change in the local BM I/O function caused by the presentation of the suppressor click has been proposed earlier to be on the basis of temporal suppression in CEOAEs [3, 5, 11], but the cochlear mechanisms responsible are still unclear. Perhaps a short-term adaptation process in human hearing, such as OHC adaptation, could influence local BM compression properties such that higher suppression levels with maxima at ICIs different from zero are created. It is possible that model adjustments other than to the static nonlinearity, can improve its ability to simulate temporal suppression. The current model is one-dimensional and maintains a constant filter sharpness Q along the cochlear partition for constant stimulus levels. At 65 dB peSPL, the modeled Qerb is 11; a value that is reasonable in comparison to the Qerb of 12.7 found for otoacoustic emission measures at 40 dB [10]. Varying the model Qerb from 9 to 13 did not lead to markedly different temporal suppression curves. Even if the model were adjusted to have sharper BM filters that could potentially enhance the simulated time scale of temporal suppression, it remains unclear how the model
261 Reuse of AIP Publishing content is subject to the terms at: https://publishing.aip.org/authors/rights-and-permissions IP: 107.173.135.45 On: Sat, 20 Aug 2016 12:41:29
could account for suppression maxima at ICIs different from zero without touching the static gain mechanism.
CONCLUSIONS A cochlear model representing the BM as a cascade of coupled bandpass filters, each with a time-invariant nonlinearity, was able to account for the suppressor-level dependence of temporal suppression and the release of suppression. The model was unable to simulate suppression levels that exceed 6 dB at ICIs different from zero. These results suggest the existence of a time-dependent gain boost in the cochlear nonlinearity that works on a time scale similar to the duration of a local BM impulse response.
ACKNOWLEDGMENTS Work supported by the Technical University of Denmark, the Oticon Foundation, NIDCD grant R01 DC003687 (CAS), and a Mechanics of Hearing scholarship (to SV).
REFERENCES [1] [2] [3] [4] [5] [6] [7] [8] [9] [10] [11] [12] [13] [14] [15]
Diependaal RJ, Duifhuis H, Hoogstraten HW, Viergever MA (1987) Numerical methods for solving 1-dimensional cochlear models in the time domain. J Acoust Soc Am 82:1655–1666 Kalluri R and Shera CA (2007) Near equivalence of human click-evoked and stimulus-frequency otoacoustic emissions. J Acoust Soc Am 121:2097–2110 Kapadia S, Lutman ME (2000b) Nonlinear temporal interactions in click-evoked otoacoustic emissions II Experimental data. Hear Res 146:101–120 Kemp DT, Chum RA (1980) Properties of the generator of stimulated otoacoustic emissions. Hear Res 2:213–232 Lina-Granade G, Collet L (1995) Effect of interstimulus interval on evoked otoacoustic emissions. Hear Res 87:55–61 Puria S (2003) Measurements of human middle ear forward and reverse acoustics: Implications for otoacoustic emissions. J Acoust Soc Am 113:2773–2789 Recio A, Rhode WS (2000) Basilar membrane responses to broadband stimuli. J Acoust Soc Am 108:2281–2298 Ren T (2002) Longitudinal pattern of basilar membrane vibration in the sensitive cochlea. Proc Natl Acad Sci USA 99:17101–17106 Shera CA (2001b) Intensity-invariance of fine time structure in basilar-membrane click responses: Implications for cochlear mechanics. J Acoust Soc Am 110:332–348 Shera CA, Guinan JJ, Oxenham AJ (2002) Revised estimates of human cochlear tuning from otoacoustic and behavioural measurements. Proc Natl Acad Sci USA 99:3318–3323 Verhulst S (2010) Characterizing and modeling dynamic processes in the cochlea using otoacoustic emissions. PhD Thesis, Technical University of Denmark Verhulst S, Harte JM, Dau T (2011) Temporal suppression of the click-evoked otoacoustic emission level-curve. J Acoust Soc Am 246:1452–1463 Verhulst S, Shera CA, Harte JM, Dau T (in prep) Investigating dynamic features of click-evoked otoacoustic emissions using a time-domain model of the cochlea Zweig G (1991) Finding the impedance of the organ of Corti. J Acoust Soc Am 89:1229–1254 Zweig G, Shera CA (1995) The origin of periodicity in the spectrum of evoked otoacoustic emissions. J Acoust Soc Am 98:2018–2047
262 Reuse of AIP Publishing content is subject to the terms at: https://publishing.aip.org/authors/rights-and-permissions IP: 107.173.135.45 On: Sat, 20 Aug 2016 12:41:29
COMMENTS AND DISCUSSION Christopher Bergevin: Thanks Sarah, this looks like a nice story. I just have two general questions: 1. Looking at Fig. 1C, all the zero-crossings appear to remain unchanged as level increases [9]. How would these crossing change if the Q-values were varied (but the CF and level remained the same)? 2. A very broad (and likely ill-informed) question: Given that the initial click suppresses the response to the evoking click and that the static nonlinearity cannot fully account for the data, what does this say about an effective “operating point” for the amplifier to more natural/complex sounds (e.g., having a discussion while walking down the street with major construction going on—this is my life in New York)? It seems that in such environments there are several ways that “suppression” could occur. If there is indeed a “time-dependent cochlear gain mechanism” does it thus even mean anything useful to talk about an “operating point” as many do, since presumably it would likely be getting continually shifted around quite a bit? Reply: Thank you for your comments and questions to my manuscript. 1. At every location, the model’s BM admittance, Y (s), has a double pole near CF whose distance from the real frequency axis is denoted α∗ (see Fig. 5c in [9]). The value of α∗ is adjustable and determines the filter Q (smaller α∗ implies higher Q). Thus, if the value of α ∗ is increased, the double pole moves vertically away from the real axis, and the filter becomes broader (has a smaller Q). If the double pole is moved vertically, the zero-crossings of the IR remain constant while the Q of the filter varies from high to low [9]. In the nonlinear model implemented here, the local value of α∗ depends on the local amplitude of BM motion. At the lowest sound levels, α ∗ is 0.06; at higher levels α∗ increases to 0.4. The model here assumes that the BM filters are constant-Q at low levels, and so this description applies at all locations in the cochlea. However, it is easy to vary the low-level Q values with CF along the BM by varying the minimum value of α ∗ with x. Whether you assume constant-Q (as here) or a spatially varying Q (which would be more realistic), so long as you move the poles vertically, the zero-crossings of the BM impulse response remain invariant with stimulus level. 2. It is currently unclear whether we need to include a dynamic nonlinearity or whether a complex interaction between BM IRs fed to an instantaneous nonlinearity can account for temporal suppression in CEOAEs. If you think in terms of dynamic nonlinearities, the process can indeed be described as a temporal shift in the effective operating point within the first 0 to 10 ms after stimulus presentation. This idea stems from OHC adaptation described for in vitro recordings. It is unclear whether such a process exists in vivo in humans. Regardless of whether you think in terms of static or dynamic nonlinearities on the basis of temporal suppression, suppression on the BM will occur in a time-frame of 0–10 ms after click onset. It is unlikely that this process will influence our perception of ongoing noise or speech, but it may have an influence on the detection of onsets of sounds. On the BM, the onset of the sound is emphasized while the information shortly after is suppressed and this may for example make it easier to localize impulse sounds. Yi-Wen Liu: Thank you Sarah for the interesting findings and CB for initiating the discussion. I am wondering if the difference between experiments and simulation has something to do with symmetry of the saturation nonlinearity. Is your saturation nonlinearity odd-symmetric around the operating point? In reality both the hair- bundle and the somatic motilty do not operate at the center point of I/O function. I remember I once tried running a simulation with off-center operating points, but the operating points (or DC) was shifted at a time scale of ms. (My memory might not be totally accurate, though.) Reply: The current nonlinearity is odd-symmetric around the operating point. Changing the nonlinearity to an off-centered operating point may be more realistic and may change the amount of compression applied on yBM . It will however not change the dynamics of temporal suppression. I’ve run a simulation where I only apply compression on the positive cycle of y BM and no compression on the negative cycle. This did not change the temporal suppression results significantly. Whether using an on- or off-centered operating point, to create dynamics in the gain mechanism, the operating point should change around its starting point within the first 10 ms after onset.
263 Reuse of AIP Publishing content is subject to the terms at: https://publishing.aip.org/authors/rights-and-permissions IP: 107.173.135.45 On: Sat, 20 Aug 2016 12:41:29