VIBE, which extended the traditional reference point-based visualization algorithm, so that it could adaptively visualize documents of interest. The adaptive ...
Can Concept-based User Modeling Improve Adaptive Visualization? Jae-wook Ahn and Peter Brusilovsky School of Information Sciences University of Pittsburgh Pittsburgh, PA, 15260 {jahn,peterb}@mail.sis.pitt.edu
Abstract. Adaptive visualization can present user-adaptive information in such a way as to help users to analyze complicated information spaces easily and intuitively. We presented an approach called Adaptive VIBE, which extended the traditional reference point-based visualization algorithm, so that it could adaptively visualize documents of interest. The adaptive visualization was implemented by separating the effects of user models and queries within the document space and we were able to show the potential of the proposed idea. However, adaptive visualization still remained in the simple bag-of-words realm. The keywords used to construct the user models were not effective enough to express the concepts that need to be included in the user models. In this study, we tried to improve the old-fashioned keyword-only user models by adopting elements which were more concept-rich than simple keywords – namedentities. The evaluation results show the strengths and shortcomings of using named-entities as conceptual elements for visual user models and the potential to improve the effectiveness of personalized information access systems. Key words: Adaptive Visualization, Concept-based User Modeling, NamedEntity, Information Retrieval, VIBE
1
Introduction
Personalized information access is one of the most important keys to user satisfaction in today’s information environment. Numerous information services and applications are producing new information every second and it is getting more and more complicated to access relevant items in time. Personalization plays a role in that challenge. It tries to solve the problem by understanding a user’s needs and providing tailored information efficiently. There are several approaches for this personalized information access: personalized information retrieval [21], information filtering [13], and adaptive visualization [17, 26]. Among them, adaptive visualization is an attempt to improve information visualization by adding an adaptation component. Through adaptation, users can modify the way in which the system visualizes a collection of documents [26]. It combines
2
Jae-wook Ahn and Peter Brusilovsky
algorithm-based personalization with user interfaces in order to better learn about users and to provide personalized information more efficiently. It also shares the spirit of exploratory search [20]. Both attempt to enhance users’ own intelligence by providing more interactive and expressive user interfaces so that they can achieve better search results. However, adaptive visualization is even more evolved than simple exploratory searching, because it actively endeavors to estimate users’ search context and help them to discover optimal solutions. In order to implement the adaptive visualization, we extended a well-known visualization framework called VIBE (Visual Information Browsing Environment) [23] and created Adaptive VIBE. VIBE is a reference point (called POI, meaning Point of Interest)-based visualization method and we extended it to visualize the user models and the personalized search results. We have begun to evaluate this idea [1] and are currently studying user behaviors with the system. However, the user models adopted in previous study were constructed using the old-fashioned, keyword-based bag-of-words approach. We have always suspected the limitation of the keyword-based user modeling for dealing with large amount of data; therefore, we decided to address this problem in the current study by extending the user models and enriching them with more semantic-rich elements. We chose to use named-entities (NEs, henceforth) as alternatives to the simple keywords. They were expected to be semantically richer than keywords and could better represent concepts. This paper investigates whether the use of NEs in the user models – especially in the Adaptive VIBE visualization – can lead us to build better personalized information access services. In the next section, the ideas of concept-based user modeling and NE-based information systems are introduced (Section 2). In Section 3, the proposed adaptive visualization and the concept-based user modeling are described. The following sections explain the methodology and the results of our experiments with the NE-based adaptive visualization. The concluding section discusses the implications of this study and future plans.
2
Concept-based User Modeling and Named-Entities
Keyword-based user modeling is a traditional approach widely used for contentbased personalization and other related areas. Even though this simple bag-ofwords approach has been working relatively well, its limitations were consistently noted too. Fist off, the independent set of keywords are too limited to contain semantic-rich user interests and contexts. Therefore, there have been many attempts to build user models to overcome this limitation [11]. Networked user profiles adopted in projects such as InfoWeb [12] and SiteIf [18] were constructed in a way that connected the concepts included in the user models and tried to avoid the independence assumption of the bag-of-words approach. OBIWAN [25], Persona [6], and PVA [7] incorporated more sophisticated approaches. Unlike the network user profiles that focused on connecting keywords according to their relationships, these ontology-based approaches tried to build user profiles by considering the semantic relationships of concepts extracted from ontologies.
Can Concept-based User Modeling Improve Adaptive Visualization?
3
Despite all of these efforts, the elements that comprise the user profiles still remain at the keyword level. Of course, we can bring more semantics to the keywords by defining the relationships among them. However, we also saw the chance to enrich the meanings of the user model elements themselves. Therefore, we tried to use NEs as conceptual elements in our user models and to extend the semantics and expressive power of the user models. As a semantic category, NEs act as pointers to real world entities such as locations, organizations, people, or events [24]. NEs can provide much richer semantic content than most vocabulary keywords and many researchers argued that semantic features were able to better model essential document content. Therefore, the application of NEs was considered to improve a user’s ability to find and access the right information [9, 24]. They have been studied extensively in various language processing and information access tasks: document indexing [22], cross language information retrieval [19], topic detection and tracking [16], and question answering [14]. At the same time, NEs have been successfully adopted by analytic systems such as [4], where user interaction and feedback plays a key role similar to that in the personalized information access systems. To our knowledge, however, there has been no attempt to directly incorporate NEs into user model construction. We ourselves have already utilized NEs as conceptual elements for news articles (where NEs can be particularly useful for catching concepts) in one of our previous studies and found that NEs organized into the editor’s 4Ws (Who, What, Where, and When) could assist users in finding relevant information in a non-personalized information retrieval setting [2]. With this experience, we could expect NEs to be high-quality semantic elements which would enhance the user model representation.
3 3.1
Adaptive Concept-Based Visualization: The Technology Adaptive VIBE Visualization
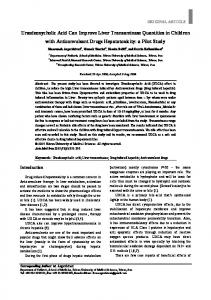
VIBE was first developed at the University of Pittsburgh and Molde College in Norway [23]. It is a reference point-based visualization and users of this system can define any reference point or POI (Point of Interest). It displays documents according to their similarity ratios to the POIs, so that more similar documents are located closer to the POIs (for more details about the visualization algorithm, see [15] and [23]). Figure 1 shows examples of the VIBE visualization. On top of this general idea, we attempted to add adaptivity by separating the originallyequivalent POIs into multiple groups. The traditional VIBE usually arranged the POIs in a circle, where POIs with different layers of meaning were treated equally (like a round table) and which required further user intervention to organize the different groups of POIs. For Adaptive VIBE, we grouped the different POIs into different locations from the beginning. That is, we separated the two groups of POIs – query and user model POIs. By separating them, we were able to spatially distinguish the documents which were more related to the query or the user model, respectively.
4
Jae-wook Ahn and Peter Brusilovsky
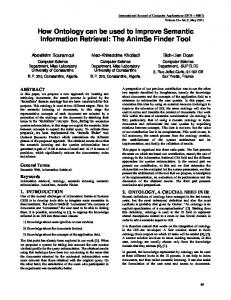
This method is similar to the usual personalized searching method, where documents are re-ranked according to their similarities to user models. The documents more related to user models are brought higher to the top of the ranked list, while less related ones are at the bottom. In Adaptive VIBE, the one-dimensional ranked list is now replaced with a two-dimensional spatial visualization. The documents that used to be scattered all over the screen (located according to their similarities to POIs or query terms) are now organized by their similarities closer to the query or user model. In order to implement this separation, we added two new default layouts of POIs (Hemisphere and Parallel) to the old circular layout (Radial) as shown in Figure 1. There, it can be seen that the document space is separated into two parts: the one that is closer to the query side and the other closer to the user model side. This separation is the result of the effect of the user model POIs (using the adaptive Parallel and Hemisphere layouts). Another goal of this study is to extend the visual user models even further by incorporating conceptual NEs into them. Figure 2 shows an example of this extension. Originally, there were only keyword-based POIs (POPE, YEAR, ESPIONAGE, and CHARGE) but we added five more NE-based POIs to the model (lowercased in the figure). With the addition of these NEs, the user model could express more information. It was not just increasing the number of POIs, but adding more meanings to the user model. For example, united states of america is usually split into 4 words and expressed as unite, state, and america (after stemmed and stopwords are removed) in keyword-based approaches. Russia and russian are reduced into one stemmed word, russia. However, these lost meanings were recovered in NE-based user models and we expected that it would help users to access relevant information. The following sections describe the NE-based user model construction process in more detail. 3.2
Named Entity Extraction
We first needed to extract NEs from texts in order to build NE-based user models. For this task, we used software developed by our partner at IBM [10].
Fig. 1. Adaptive VIBE layouts (a) Radial, (b) Hemisphere, and (c) Parallel. Yellow (CONVICT and PARDON) and blue (YEAR, POPE, and so on) POIs are query terms and user model keywords, respectively. White squares are retrieved documents.
Can Concept-based User Modeling Improve Adaptive Visualization?
5
Fig. 2. Adaptive VIBE enriched with a concept user model – lowercased elements (pope, prison, russian, russia, united states of america) are NEs.
With the help of the NE annotator, we could extract the NEs to construct the user models and calculate the similarity between documents and the entities as inputs to the Adaptive VIBE system. The NE annotation process was based on a statistical maximum-entropy model that recognized 32 types of named, nominal and pronominal entities (such as PERSON, ORGANIZATION, FACILITY, LOCATION, OCCUPATION, etc), and 13 types of events (such as EVENT VIOLENCE, EVENT COMMUNICATION, etc). Among them, we selected the nine most frequent entity types. One very important characteristic of the NE annotator we used was that it could distinguish between different forms of the same entities within- and between-documents. For example, it was able to detect “ski lovers” and “who”, which were pointing to the same group of people and could give them the same identifiers within a single document. Both were marked as ZBN20001113.0400.0019E75 which represented the 75th entity in document ZBN20001113.0400.0019. Therefore, those two entities with different forms (“ski lovers” and “who”) could be assessed as having the same meaning (E75) by the system. At the same time, the annotator could do the same thing across the documents. It could endow a single ID “XDC:Per:wolfgang schussel” to the words/phrases in the text like “Schussel”, “director”, “Chancellor”, and “him”, so that users could grasp the fact that they represented a single person. This capability was considered very promising, since it could deliver the semantics of the entities in the text regardless of the varying textual representations. For more details about the NE annotation algorithm and the selection process, please see [2]. 3.3
Construction of Concept-based User Models using NEs
As discussed in the previous sections, we assumed that NEs were semantically richer than vocabulary keywords and would contribute greatly to accessing rel-
6
Jae-wook Ahn and Peter Brusilovsky
evant information. This expectation was grounded on our previous study [2] which used NEs as pseudo-facets for browsing information. However, we had no idea about the best method for constructing NE-based user models. Is it a better approach to use NEs only in user models? What fraction of NEs should be used with keywords, if we choose to mix them? Therefore, we prepared seven combinations of the keyword and NE mixtures, in the spectrum between the extreme “keywords-only” mixture and the “NE-only” mixture. They are as follows: k20n0, k10n0, k5n5, n8n8, k10n10, k0n10, k0n20. Here, kx ny represents x keywords and y NEs. Therefore, k5n5 means 5 keywords and 5 NEs, while k10n0 means 10 keywords only. We chose these combinations considering the optimal number of user model POIs displayed in the visualization. Because we didn’t want to place too many user model POIs on the screen and make users frustrated, we configured x + y (total number of user model POIs displayed at the same time on the screen) to be no more than 20. Using these combinations of keyword/NE mixtures, we could test various conditions such as equivalent importance (e.g. k5n5), keyword only (e.g. k10n0), and NE only (e.g. k0n10). The NEs were extracted from user feedback information (notes saved by users in our prototype system) just like the case of keywords [1, 3]. Among the candidates, NEs with higher TF-IDF values were selected for constructing the NE-based user models. When calculating the TF-IDF values, the NE normalization process introduced in the previous section was utilized. That is, “ski lover” and “who” were perceived as the same term and their occurrences were counted as TF=2.
4 4.1
Study Design Hypotheses and Measures
We defined two hypotheses in this study in order to test the validity of the NE-based adaptive visualization. H1) The proposed NE-based adaptive visualization will better separate relevant and non-relevant documents in the visualization. H2) In the NE-based adaptive visualization, the relevant documents will be more attracted by the user models. They were defined considering the nature of an ideal information access system. An ideal information access system has to have the ability to sort out valuable information from noise and to provide such information to users efficiently. The hypotheses exactly reflect those characteristics. Adaptive VIBE aims to distinguish relevant documents and then locate them spatially close to the user models. In order to measure the separation of relevant documents from non-relevant ones, we adopted the Davies-Bouldin Validity Index (DB-index). It determines the quality of clustering by measuring the compactness and separation of the clusters of those two types of documents [8]. It is a ratio of the spread of elements in clusters and the distances between those clusters (Equation 1).
Can Concept-based User Modeling Improve Adaptive Visualization?
7
Therefore, it produces smaller scores as the clusters become compact and as the clusters are far from each other, which means better clusterings. " # n Sn (Qi ) + Sn (Qj ) 1! maxi=j DB = (1) n i=1 S(Qi , Qj ) S(Q) = average distance within a cluster Q S(Q1 , Q2 ) = distance between two cluster centroids
4.2
Dataset
As mentioned briefly earlier, we constructed a dataset from the log data of our text-based personalized information retrieval study [3]. It aimed to help users to search the TDT41 news corpus for information by mediating the user query and the user model with a text-based user interface. The TDT4 corpus was built for constructing a news understanding systems and is comprised of 96,260 news articles. We chose TDT4 because NEs could represent important concepts appearing in news texts. From the log file of the study, we could extract the information as below. 1. userid and query 2. retrieved documents and the relevance of each document 3. user notes – explicit user feedbacks from which user model keywords and NEs would be extracted That is, we had stored a snapshot of every users’ search activity, the output from the system, and the user model constructed by the system (or the source of user model). Using this data, we were able to rebuild the user models using keywords and NEs (as shown in the previous section), and then re-situate the Adaptive VIBE visualizations according to each user model. Moreover, we had the relevance information of each document and could observe how they were represented in the visualizations. This relevance information was not available to the users during the user study, but we could take advantage of its availability to evaluate the quality of the adaptive visualizations (as in Figure 2). The next section shows the analysis result of those adaptive visualizations and discusses their properties.
5
Experimental Results
5.1
Separation of Relevant and Non-relevant Documents by Concept-based Adaptive Visualization
In our previous study, we found that the adaptive visualization was able to produce clusters of relevant and non-relevant documents and that the relevant document cluster was more attracted to the user model side [1]. However, the 1
Topic Detection and Tracking Project,
8
Jae-wook Ahn and Peter Brusilovsky
Table 1. Comparison of cluster validity of adaptive visualization (kx ny means x keywords and y NEs combination in the user models) Layout Radial Parallel Hemisphere
k20n0 3.22 1.89 3.37
k10n0 2.37 1.57 2.91
k5n5 2.08 1.37 2.12
k8n8 2.20 1.40 1.99
k10n10 2.25 1.55 2.00
k0n10 2.37 2.62 3.61
k0n20 2.62 2.03 3.03
Fig. 3. Comparison of cluster validity of adaptive visualization
user model of the study made use of keywords only and the power of the user model in the visualization was assumed to be limited. Therefore, we prepared various combinations of user model elements (keywords plus NEs as introduced in Section 3) and tested them with our adaptive visualization system. The first step of the analysis was to examine how well the relevant and non-relevant document clusters were formed. Using the Davies-Bouldin index (the ratio between the cluster compactness and the distance between the relevant and non-relevant document clusters), we could calculate the quality of the clusterings. Table 1 and Figure 3 show the DB indices of three different POI layouts of Adaptive VIBE using eight different mixtures of keywords and NEs. From this data, it can be easily seen that using only keywords or NEs for user models (k20n0, k10n0, k0n10, k0n20) generally resulted in low clustering quality. However, when the keywords and the NEs were mixed within the user models, the clustering quality improved (k5n5, k8n8, and k10n10). Among the three POI layouts, the Parallel layout exhibited the best clustering quality. This result supports our first hypothesis, because the personalized adaptive visualization method (Parallel layout) and the use of NEs in the user models outperformed other combinations. It can be understood as more powerful user models (equipped with NEs) were able to stretch the space out and separated the relevant documents from the others. In order to examine the significance of the differences among keyword/NE mixtures, we conducted the Kruskal-Wallis rank sum tests on the three most representative mixtures (k10n0, k5n5, and k0n10) per each layout. These mixtures were chosen in order to compare the best key-
Can Concept-based User Modeling Improve Adaptive Visualization?
9
Table 2. Comparison of mean DB-index among three mixtures (k10n0, k5n5, k0n10) Layout Kruskal-Wallis χ2 p
Radial 0.0462 0.9772
Parallel 8.93 0.0115
Hemisphere 3.3834 0.1842
Table 3. Pairwise Wilcox signed rank tests by keyword/NE mixture Layout=Parallel k5n5 k0n10
k5n5 p < 0.001
k10n0 p=0.002 p=0.007
word+NE mixture (k5n5) with keyword/NE only mixtures (k10n0 and k0n10) that have the same number of POIs (=10). The result shows that the clustering quality was significantly different among the mixtures when the Parallel layout was used (Table 2). Regarding the Parallel layout, the DB-index scores of three mixtures were all significantly different (Table 3). Cluster compactness versus between-cluster distance DB-Index is the ratio between the within-cluster compactness and between-cluster distance. We found that the Adaptive VIBE layout and equally-mixed keyword/NE user models could produce good results but we needed deeper analysis. By separating the nominator and denominator of the DB-index equation, we could compare the within-cluster spreads and between-cluster distances in terms of two other variables: keyword/NE mixture and Adaptive VIBE POI layout (Table 4 and 5). It shows that the differences among the keyword/NE mixtures were not evident when we observed the cluster spreads (Table 4), but that there were bigger differences in terms of the between-cluster distances across the three mixtures (Table 5). In all cases, the k5n5 mixture showed the largest distance and the differences between other mixtures were always statistically significant (Wilcox signed rank test, p < 0.01). This result suggests that the significant differences of overall DB-indices among the mixtures (where k5n5 was the best) observed in the previous section were caused by the cluster distance, rather than the different inner-compactness of clusters. Table 4. Within-cluster spread scores Within-cluster Spread Radial Parellel Hemisphere
k5n5 87.67 154.47 110.54
k10n0 81.25 152.13 109.50
k0n10 87.67 161.44 110.54
Table 5. Between-cluster distance scores Between-cluster Distance Radial Parellel Hemisphere
k5n5 55.23 151.63 82.97
k10n0 49.94 138.05 70.76
k0n10 47.68 125.31 74.78
10
Jae-wook Ahn and Peter Brusilovsky Table 6. Comparing horizontal positions of cluster centroids (in pixels)
Keyword/NE Mixture k10n0
k5n5
k0n10
5.2
Clusters Relevant Non-relevant Distance p Relevant Non-relevant Distance p Relevant Non-relevant Distance p
Radial 313.58 302.99 10.59 < 0.01 315.73 301.46 14.27 < 0.01 300.68 294.71 5.96 0.03848
Parallel 318.56 188.19 130.37 < 0.01 332.02 192.71 139.31 < 0.01 269.44 161.63 107.80 < 0.01
Hemisphere 350.35 304.74 45.61 < 0.01 361.77 308.44 53.33 < 0.01 328.31 291.77 36.54 < 0.01
User Model Effects on Adaptive Visualization
So far, we have seen that the adaptive visualization could separate the relevant and non-relevant document clusters. It could also work more effectively when the user models were constructed using the mixture of keywords and NEs. However, this just tells us that there were separations and cannot let us know what they really looked like. Therefore, the following analysis focused on the distribution of relevant and non-relevant document clusters in the visualization. Table 6 compares the horizontal positions of the cluster centroids in various conditions. The relevant document clusters were always located closer to the user models (larger in their horizontal positions). Particularly, the distances between the cluster centroids were largest when the Parallel layout (which separates the user model and the query space the most) was used whereas the Radial layout (non-personalized) produced very small between-cluster distances. The differences between relevant and non-relevant clusters’ horizontal positions (or distances) were all statistically significant (Wilcox signed rank test). This result confirms our second hypothesis that the user model attracts more the relevant documents than the query side. We should note that the mixture of five keywords and five NEs shows the biggest distance in the Parallel layout (139.31) and thus supports the validity of concept-based user modeling for adaptive visualization. The mean differences of cluster distances across three mixtures were all statistically significant (Wilcox signed rank test, p < 0.001).
6
Conclusions
In this paper, we introduced our innovative approach for adaptive visualization and concept-based user modeling. Adaptive visualization is a promising personalized information access method that can efficiently guide users to relevant information. Concept-based user modeling is an alternative to old keyword-based approaches, which can enrich user models by adding more semantics. We inte-
Can Concept-based User Modeling Improve Adaptive Visualization?
11
grated named-entities into user models and examined the quality of the adaptive visualization method equipped with the concept-based user models. An experiment was conducted using the proposed approach and the result showed that the mixture of keywords and NEs provided the best results in terms of separating relevant documents from non-relevant ones. We also discovered that the cluster separation was due more to the between-cluster distances rather than cluster compactness. Moreover, the effect that user models could attract relevant documents around them was seen, which supports the utility of our idea that adaptive visualization can help users to access relevant information more easily. In our future work, we plan to conduct a large-scale user study and examine user behaviors about our adaptive visualization and the concept-based user model. We are going to determine if the systems will work as expected and will observe under what situations users can benefit from the potential of the systems. We are also planning to migrate the adaptive visualization concept into other types of user interfaces and visualizations, including force-directed visualization and NE-based personalized browsing/searching. At the same time, more sophisticated concept-based user modeling ideas are being investigated.
References 1. J. Ahn and P. Brusilovsky. Adaptive visualization of search results: Bringing user models to visual analytics. Information Visualization, 8(3):167–179, 2009. 2. J. Ahn, P. Brusilovsky, J. Grady, D. He, and R. Florian. Semantic annotation based exploratory search for information analysts. Information Processing and Management, In Press, Corrected Proof, 2010. 3. J. Ahn, P. Brusilovsky, D. He, J. Grady, and Q. Li. Personalized web exploration with task models. In J. Huai, R. Chen, H.-W. Hon, Y. Liu, W.-Y. Ma, A. Tomkins, and X. Zhang, editors, Proceedings of the 17th International Conference on World Wide Web, WWW 2008, Beijing, China, April 21-25, 2008, pages 1–10. ACM, 2008. 4. E. Bier, E. Ishak, and E. Chi. Entity workspace: an evidence file that aids memory, inference, and reading. Lecture Notes in Computer Science, 3975:466, 2006. 5. P. Brusilovsky, A. Kobsa, and W. Nejdl. The Adaptive Web: Methods and Strategies of Web Personalization. Springer, 2007. 6. J. Chaffee and S. Gauch. Personal ontologies for web navigation. In Proceedings of the ninth international conference on Information and knowledge management, pages 227–234. ACM, 2000. 7. C. C. Chen, M. C. Chen, and Y. Sun. Pva: a self-adaptive personal view agent system. In KDD ’01: Proceedings of the seventh ACM SIGKDD international conference on Knowledge discovery and data mining, pages 257–262, New York, NY, USA, 2001. ACM. 8. D. L. Davies and D. W. Bouldin. A cluster separation measure. Pattern Analysis and Machine Intelligence, IEEE Transactions on, PAMI-1(2):224–227, January 2009. 9. D. Demner-Fushman and D. W. Oard. The effect of bilingual term list size on dictionary-based cross-language information retrieval. In Proceedings of the 36th Annual Hawaii International Conference on System Sciences (HICSS’03)-Track, volume 4, pages 06–09. Citeseer, 2003.
12
Jae-wook Ahn and Peter Brusilovsky
10. R. Florian, H. Hassan, A. Ittycheriah, H. Jing, N. Kambhatla, X. Luo, H. Nicolov, S. Roukos, and T. Zhang. A statistical model for multilingual entity detection and tracking. In Proceedings of the Human Language Technologies Conference (HLT-NAACL’04), 2004. 11. S. Gauch, M. Speretta, A. Chandramouli, and A. Micarelli. User profiles for personalized information access. In The Adaptive Web [5], pages 54–89. 12. G. Gentili, A. Micarelli, and F. Sciarrone. Infoweb: An adaptive information filtering system for the cultural heritage domain. Applied Artificial Intelligence, pages 715–744, 2003. 13. U. Hanani, B. Shapira, and P. Shoval. Information filtering: Overview of issues, research and systems. User Modeling and User-Adapted Interaction, 11(3):203–259, August 2001. 14. M. Khalid, V. Jijkoun, and M. de Rijke. The impact of named entity normalization on information retrieval for question answering. In Advances in Information Retrieval, Lecture Notes in Computer Science, chapter 83, pages 705–710. 2008. 15. R. R. Korfhage. To see, or not to see – is that the query? In SIGIR ’91: Proceedings of the 14th annual international ACM SIGIR conference on Research and development in information retrieval, pages 134–141, New York, NY, USA, 1991. ACM. 16. G. Kumaran and J. Allan. Text classification and named entities for new event detection. In SIGIR ’04: Proceedings of the 27th annual international ACM SIGIR conference on Research and development in information retrieval, pages 297–304, New York, NY, USA, 2004. ACM. 17. A. Leuski and J. Allan. Interactive information retrieval using clustering and spatial proximity. User Modeling and User-Adapted Interaction, 14(2-3):259–288, 2004. 18. B. Magnini and C. Strapparava. User modelling for news web sites with word sense based techniques. User Modeling and User-Adapted Interaction, 14(2):239– 257, June 2004. 19. T. Mandl and C. W. Hacker. The effect of named entities on effectiveness in crosslanguage information retrieval evaluation. In SAC ’05: Proceedings of the 2005 ACM symposium on Applied computing, pages 1059–1064, New York, NY, USA, 2005. ACM. 20. G. Marchionini. Exploratory search: from finding to understanding. Commun. ACM, 49(4):41–46, April 2006. 21. A. Micarelli, F. Gasparetti, F. Sciarrone, and S. Gauch. Personalized search on the world wide web. In The Adaptive Web [5], pages 195–230. 22. R. Mihalcea and D. L. Moldovan. Document indexing using named entities. Studies in Informatics and Control, 10(1):21–28, 2001. 23. K. A. Olsen, R. Korfhage, K. M. Sochats, M. B. Spring, and J. G. Williams. Visualization of a document collection: The vibe system. Information Processing and Management, 29(1):69–81, 1993. 24. D. Petkova and B. W. Croft. Proximity-based document representation for named entity retrieval. In CIKM ’07: Proceedings of the sixteenth ACM conference on Conference on information and knowledge management, pages 731–740, New York, NY, USA, 2007. ACM. 25. A. Pretschner and S. Gauch. Ontology based personalized search. In ICTAI, pages 391–398, 1999. 26. D. Roussinov and M. Ramsey. Information forage through adaptive visualization. In DL ’98: Proceedings of the third ACM conference on Digital libraries, pages 303–304, New York, NY, USA, 1998. ACM.