2009 IEEE 8TH INTERNATIONAL CONFERENCE ON DEVELOPMENT AND LEARNING
1
Can reinforcement learning explain the development of causal inference in multisensory integration? Thomas H Weisswange∗ , Constantin A Rothkopf ∗ , Tobias Rodemann† and Jochen Triesch∗ ∗ Frankfurt Institute for Advanced Studies, Frankfurt, Germany. Email: {weisswange, rothkopf, triesch}@fias.uni-frankfurt.de † Honda Research Institute Europe GmbH, Offenbach, Germany Email:
[email protected]
Abstract—Bayesian inference techniques have been used to understand the performance of human subjects on a large number of sensory tasks. Particularly, it has been shown that humans integrate sensory inputs from multiple cues in an optimal way in many conditions. Recently it has also been proposed that causal inference [1] can well describe the way humans select the most plausible model for a given input. It is still unclear how those problems are solved in the brain. Also, considering that infants do not yet behave as ideal observers [2]–[4], it is interesting to ask how the related abilities can develop. We present a reinforcement learning approach to this problem. An orienting task is used in which we reward the model for a correct movement to the origin of noisy audio visual signals. We show that the model learns to do cue-integration and model selection, in this case inferring the number of objects. Its behaviour also includes differences in reliability between the two modalities. All of that comes without any prior knowledge by simple interaction with the environment.
I. I NTRODUCTION In recent years it has been suggested that the performance of human subjects in a large variety of sensory tasks can be modelled as Bayesian inference. The success of these methods relies on the fact that they explicitly represent the involved uncertainties. Recently, such methods have been extended to the task of model selection, in which the observer not only has to integrate different cues into a single estimate, but also needs to select which causal model best describes the stimuli. While the normative approach has been successful in explaining how uncertainties should be taken into account, it does not explain how the knowledge about it develops. This is particularly important since it has been shown that young infants are not yet capable of optimal information integration [2]–[4]. This paper will first give a brief introduction to cue integration and causal inference and what is known about their development. After that, we will describe a model of the development of cue integration abilities based on reinforcement learning. We show that this model is able to explain the development of cue integration and model selection with only few assumptions. A. Cue Integration To infer the states of the environment we have to rely on data that we obtain from our senses, including different
Fig. 1. Sketch of the experimental setting. The agent receives signals from two modalities (audition and vision) that originate from the same or two different locations.
modalities and representations in different reference frames. Basic parameters extracted from the input — like position, color, direction of motion — are called cues for a certain task, if they provide relevant information about the underlying state of the world which is not directly observable. There is always some task-dependent uncertainty regarding the true state given the sensory input due to the many-to-many mapping between sensory signals and the states of the world, as well as the probabilistic relationship between sensory states and their representation. External factors, e.g. fog can blur our visual input, or background noise changes the reliability of auditory signals. Internal variability is present in the trial to trial variability of neuronal responses to the same sensory stimuli and is inherent in the projection of visual inputs from a 3D world onto a 2D retina. As a specific example, consider the task of estimating the position of an object, of which the perceptual system obtains an auditory and a visual signal (Figure 1). Assuming that the uncertainty in the two signals can be modeled by normal distributions centered on the object position, the variance σ 2 represents the associated uncertainty. In this case, the uncertainty can be expressed as the reliability of a cue, given by the inverse variance σ12 . Figure 2 shows probability distributions for the true location given the auditory or visually received position of an object. Both cues have an inherent uncertainty associated with them, where the auditory cue (received position 10, left gaussian) has a reliability of 0.25, the visual cue’s reliability (received position 13, right gaussian) is 0.64.
c 2009 IEEE 978-1-4244-4118-1/09/$25.00 °
2009 IEEE 8TH INTERNATIONAL CONFERENCE ON DEVELOPMENT AND LEARNING
2
it is possible to decide if the auditory and visual signals are likely to come from the same physical object and should be integrated or if they are better used independently. In the following we will refer to this decision as model selection (generated by common cause vs. distinct causes). In [1] it was shown that humans act in accordance with a Bayesian model that implements causal inference. This means that they integrate according to different models depending on the interstimulus-difference in space [10] or time delay [11]. C. Development of Cue Integration and Causal Inference
Fig. 2. Optimal Integration (middle) of an auditory (left) and a visual (right) signal with different gaussian uncertainties
A way of getting more reliable estimates is to combine the information from two or more cues, assuming that their uncertainty is caused by independent factors, which is true in many cases. One can use Bayes formula to compute the probability distribution for an estimate of the true state while knowing only the cue values and their uncertainties. The posterior distribution is also a Gaussian where the mean will be a linear average over the cue means weighted by the reliabilities of the cues [5]. The resulting distribution has a higher reliability than either of the single cues (0.89, dark 2 gray center distribution in Figure 2). The variance σav of the gaussian in the combined case is computed by 2 = σav
σa2 σv2 . + σv2
σa2
(1)
Humans have been shown to behave according to such Bayesoptimal cue combination rules in a wide variety of tasks (e.g. [6], for a review see [7], [8]). B. Causal Inference An underlying assumption of cue integration is that all the cue-values are caused by the same object or event. But how often is only a single object the cause of all sensory stimuli? As a simple example consider an orienting task, for example turning your head to a person that is talking. To identify the target point for the movement, one can use the visual position of that person and the direction of its voice, but better ignore the ringing of a phone and the visual input from a computer screen. To be able to make this distinction, one has to have a mechanism that decides when and which signals to integrate [9]. One way of doing this is to decide for each pair of stimuli if they come from the same object, that is computing the probability of a common cause given the two cue values. Figure 3 shows the distribution of the probability of a common cause for the difference between positional estimates of two cues with different reliabilities (0.25 and 0.64) and as example for a uniform prior P (common) = P (distinct) (for the detailed equation and its derivation see [1]). Given this distribution,
Cue integration is not innate. Nardini et al. [2] and Gori et al. [3] showed for different cues that young children sometimes do not integrate information from all their modalities. In orienting tasks with single- or multisensory stimuli infants younger than 8 month did not show the decrease in response time that is typical for an integration process [4]. In recordings in kitten superior colliculus (SC), the brain area that is responsible for integrating information for orienting movements, neurons initially show only unisensory excitability. They start to react to multisensory inputs only one month after birth [12]. Experiments by Wallace and Stein [13] in newborn monkeys revealed multisensory neurons, but could not find the integration abilities that are found in adult animals. It could also be shown that the neuronal basis for the causal inference process is not present at birth in both cats [12] and monkeys [13]. Multisensory neurons in the SC of adult animals show a tight spacial alignment between the centers of their receptive fields for one sense. Multiple cue signals are only integrated if they fall within the combined receptive field, that is if they are close together in space. The receptive field of a single cue is small and well defined if it has a high reliability and grows with increasing uncertainty. Since the SC is responsible for controlling the targets for eye and head movements, a spatial task, auditory receptive fields are larger than the visual ones in all multisensory neurons. Additionally, Wallace and colleagues [13] found an increase in receptive field size with growing distance of the centers from the straight ahead position. In the SC of newborn kittens and monkeys the size of most receptive fields is much bigger than in adult cats. Signals that are far apart still get integrated in those neurons. For owls [14], [15] and for cats [16] it could be shown that the alignment of the centers of multimodal receptive fields is also plastic. If reared in artificial environments, where visual and auditory signals were only showed separately , the animals developed multisensory neurons with only weak or no spatial alignment between the receptive fields of the two modalities. Unfortunately there are no psychophysical experiments about causal inference in human infants yet. One could repeat the experiments and analyses from [1] with infants or children of different age. K¨ording and colleagues tested adults in a multisensory orienting task similar to the one we use in this paper. Afterwards they analysed the data with Bayesian methods, to predict for which stimuli people inferred a common cause. They found a dependence on the spacial difference between the signals.
2009 IEEE 8TH INTERNATIONAL CONFERENCE ON DEVELOPMENT AND LEARNING
3
reliability) was bigger for the auditory signal (Figure 2), as the acuity of human audition is in most cases worse than the visual acuity for judgments on space (e.g. [17]). We defined a state by the agent’s actual position estimates for both vision and audition. After receiving these signals, the agent had to decide where the original signals came from and perform an orienting movement to the estimated position. Depending on the distance between the true position and the target of the movement, it receives a reward. The function for the reward decreases linearly with distance from the true position, but has an added peak at distance zero (see Equation 2). ζ 2ζ + 1 + 2 , e = 0 (2) rew(e) = 2ζ + 1 − 2e , 0 < e ≤ ζ 0 ,e > ζ Fig. 3. Probability distribution of a common cause of an auditory signal with σa = 2 and a visual one with σv = 1.25 given the difference between these estimates. The grey-shaded area show where one explanation of the data is most probable. The area above 0.5 marks the differences that favor a common cause, in the ones below two distinct causes are more probable. The probability distribution for the distance given distinct causes is uniform whereas in the common case it is a multiplication of the two gaussian that represent the uncertainty of the signals. The point where the curve crosses the equality line is at the distance where the probability predicted by the combined gaussian is lower than 0.04.
It is plausible to assume that the ability to integrate cues could be learned from the statistics of the environment. Many events in our world do not only stimulate one sensory modality but usually two or more. Additionally, the signals of the different cues for one event are usually close together in time and/or space. Those environmental statistics should favor creatures that are able to integrate signals from different cues because they get a faster and more reliable estimate of the state. But how to find out if an initial estimate was right or wrong? This is only possible if there is an interaction with the environment that gives feedback about the quality of the estimate. In the following section we will develop a model that can learn to do cue integration and causal inference from scratch within biological constraints. II. M ETHODS A. An orienting task We decided to use an orienting task for our experiment — a task that is performed by infants and adults frequently each day, whenever the eyes and/or the head are moved towards an interesting object or event. The setting consists of 25 discrete positions at different angles from the observer in the horizontal plane (similar to Figure 1). At each timestep we presented two cues, one representing an auditory signal, the other a visual one. In half of the trials, the two signals were emitted from a common position; in the rest they were caused by two independent events. The agent observed each position corrupted by Gaussian noise corresponding to the uncertainty of the cue. The standart deviation of the Gaussian (the square root of the inverse
with e as the minimum of the distances between the movement target and the true positions. We chose this function to mimic an additional energy cost for small correction movements that are necessary if there is a small position error. The maximal position error ζ that still provided a reward was set to 4. There was no difference in reward between finding the position of the visual or the auditory cue. If the movement target was close to both true positions (in the distinct case) the cue with minimum distance to the movement position determined the amount of reward. B. A reinforcement learning model Reinforcement learning (RL) [18] is a general set of problems in which an agent has to solve the optimal control problem without necessarily knowing the reward function determining the rewards or costs of actions in particular states of the world and without necessarily knowing the dynamics governing the state transitions resulting from control. In the family of algorithms considered here, the agent learns a policy that associates a control signal i.e. an action with each state it can be in. The goal is to learn a control policy that maximizes the total reward that is obtained through the executed actions. One biologically plausible way of learning the best state-toaction mapping, i.e. the one that maximizes reward, is temporal difference (TD) learning [18]. In a given state there is a prediction of the expected reward for every possible action. During learning, the obtained reward is compared to the reward prediction based on all previous experience. This is the TDerror. If the difference is negative, that means there was less reward than expected, it lowers the probability of the executed action given the previous state, and vice versa for positive differences. Additionally the error-signal is used to update the reward-predictions. The mechanism has been found to well describe activities of dopaminergic neurons in the brain, whose activity depends not on the received reward but on the TDerror [19]. The total expected sum of rewards when in state s and choosing action a is the so-called Q-values q(s, a), which can be stored in tabular form. We used a reinforcement learning algorithm called SARSA [20]. Equation 3 shows the learning rule, with ε being the learning rate that is exponentially
2009 IEEE 8TH INTERNATIONAL CONFERENCE ON DEVELOPMENT AND LEARNING
q(st , a)new = q(st , a)old + ε(r(st+1 , a) − q(st , a)old )
Mean Reward over 1000 Iterations
decreasing over time, and r(s, a) being the true reward. Since we only simulate a single step in time, there is no term for future expected reward at the new state. (3)
The policy should favor the actions that promise the highest reward given the current state. We use the softmax function (equation 4) for the mapping between Q-values and stateaction probabilities. (4)
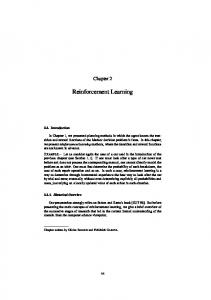
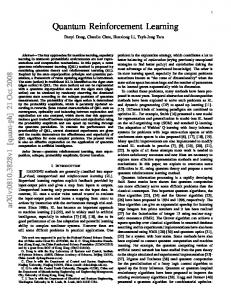
with qas being the predicted reward of an action a when in state s and τ is a parameter that influences the tendency towards either exploration of the state space, which increases acuity of the global reward predictions, or exploitation, which tries to achieve the maximum reward at the moment. It can be shown that a one-step SARSA with exponentially decaying learning rate converges to the optimal policy [21] under some technical constraints, which are all fulfilled in our model. This is important, because it guarantees that using this learning algorithm results in the policy providing the highest possible average reward. III. R ESULTS A. Learning causal inference with fixed cue reliabilities The fact that learning was performed with a very well studied algorithm has the advantage that its convergence and optimality properties can be applied to the given problem. The utilized learning algorithm has been shown to converge to the optimal solution in terms of the highest expected total reward [21]. Therefore, we are assured that the solution found by the learner is optimal, in the sense that the total expected reward obtained by the agent is maximal. Figure 4 shows how the obtained reward changes over time (black curve). For comparison the red curve marks the reward that would be obtained with the Bayes-optimal action in each step in the sense of a model selection approach. Such an action is defined as going towards the estimate of the cue with higher reliability if the probability of two distinct causes is bigger than 0.5. If it is more probable that both signals have a common cause (compare Figure 3), the optimal action is the weighted sum of the two estimates, where the weights are proportional to the reliabilities of the cues. Figure 5 shows a subsection of the learned Q-values for one representative action (action “12”) given all possible states. A state is defined by both the estimated position of the visual (x-axis) and the auditory (y-axis) stimulus. In blue areas the predicted reward is close to zero, whereas red means high values. If neither of the two cues is close to 12, there should be no reward expected, because the uncertainty covers only much smaller deviations, so the probability of a large deviation is close to zero. If one looks at the states where the visual signal has position 12 (vertical dashed line “V”) and the auditory one is far off, the expected reward has a high value that correlates with the reliability of the visual cue. Because the auditory reliability is smaller, the values at the
10
8
6
4
2
0
0
250000
500000
750000
1000000
Iterations Fig. 4. The black graph shows the change in the obtained reward over training with the exponentially decreasing temperature parameter of the softmax starting at 30 and reaching a value of 1 after 500,000 Iterations. The red curve is the reward when performing the Bayes-optimal action (see text). Each point in each graph is the average reward over 1000 consecutive iterations.
0
position of auditory estimate
eqa,s /τ qa0 ,s /τ a0 e
P (a|s) = ∑
4
8
V
7 5 6 10
5
I
A
4 15
3 2
20 1 0
5
10
15
20
position of visual estimate Fig. 5. Top: Q-value plots for all states and a specific action (here move to position 12). Each pixel value represents the expected reward given an auditory and a visual signal and performing action 12. Dark blue equals values around zero, red means highest rewards.
horizontal dashed line “A” at 12 are smaller than the ones mentioned before. Nevertheless, the Q-values along the line are again higher than the ones in the surrounding. These two lines correspond to states where the agent bases its decision exclusively on one of the two cues. But note that the highest values of all states lie in the center along the dash-dotted line “I”. There the uncertainty of the estimate is smaller than for either audition or vision alone. This is a clear sign of cue integration. At the arrows in Figure 5 the Q-values are smaller than what would be expected for an unisensory estimate. This also results from
0
position of auditory estimate
2009 IEEE 8TH INTERNATIONAL CONFERENCE ON DEVELOPMENT AND LEARNING
5
0
0
0
5
5
5
10
10
10
9 8 7 6 5
15
15
4
15
3 20
20
2
20
1 0
5
10
15
20
0
5
10
15
20
0
5
10
15
20
0
position of visual estimate
Fig. 6. Q-Values for all states and 3 actions in a fully trained foveated agent. The actions represent from left to right movements to position 0, 6 and 12. In the left plot the movement is determined mainly by the auditory stimulus, in the right one it is completely determined by vision. The middle plot shows an intermediate state, where close-by visual and auditory stimuli are integrated and for far away ones only a single cue is used to decide which action is taken.
a cue integration process which predicts seeing a reward with action 12 only with low probability if the single cue estimates both are slightly bigger or smaller than 12. Such a case would instead favor a movement towards neighbouring positions (say action 13 or 11). Since all true positions lie on a circle, are equally probable and provide equal reward all Q-value plots show the same shape. That means lines “A” and “V” are always where the associated cue equals the action, and the diagonal line “I” is always where the two lines cross and has the same slope. The slope of “I” depends on the difference in reliability of the cues (see also next subsection). B. Learning causal inference with foveation To simulate the effect of foveated vision with decreasing acuity towards the outside of the retina, we changed the spatially homogeneous reliability of the visual cue into a function of the distance from the center (position 12). This shape of the retina leads to a higher reliability of vision over audition close to the fovea and the other way around at large distances from it. Even in this more complex scenario our model learns to act in an optimal way. As can be seen in Figure 6, the global shapes of the Q-value functions now changes with the performed action. In the right subplot, which represents a movement to the fovea (action 12), the darkest red area (global maximum) is a narrow line where the visual position equals the action, meaning that it is best to only use the visual cue. The benefit from integrating both cues in this case is smaller than one position, so there is no diagonal maximum in the center. However in the left plot (far from the fovea) it is nearly inverse. Here, the higher maximum has a horizontal extent, where the auditory stimulus matches the movement position (action 0). The line is not as thin as in the bottom plot because the auditory cue has the same reliability everywhere, which is worse than the best visual one. Because of this there is also an integration diagonal, although it is hard to see because of the borders of the plot. Nevertheless you can clearly see the notches (that are referred to in Figure 5 with arrows) in the upper left and lower right corner. In the central subplot one can clearly recognize the global maximum in the diagonal. The slant of it is one if both cues are equally uncertain, gets bigger when visual estimates are more reliable
and smaller if the auditory is more trustworthy. In general there is a correlation between the slant of the integration area and the optimal integration weights for each cue. As another example Figure 5 shows a diagonal with another different slant (more towards the visual signal), because there the visual reliability is higher than the auditory one. In Figure 7, we plotted for a quarter of the state-space (states 0:0 to 12:12), where one of three example actions (1,6,11) is executed preferentially to highlight some features of the policy. The upper plot shows the case with constant visual reliability. In most parts of the state space the visual estimate dominates the chosen action, but if both perceived estimates lie close together the action differs from it. The lower plot shows the same state space but with foveation. Here movements towards the outside (black) are dominated by the auditory signal, intermediate ones (dark gray) are influenced by both signals equally. Orienting to central positions is dominated by vision, and dominated by audition for visual estimates that are in the visually most uncertain area. The results above show that the model actually changes its strategy depending on whether the inputs make it more likely to have a common cause or two distinct ones. In the first case the resulting action is influenced by both inputs, in the latter preference is given to the more reliable single estimate. IV. C ONCLUSION There has been great success in explaining human performance in a variety of sensory tasks through Bayesian inference methods. But a large number of questions remain, including, how such abilities are learned, given that infants and young children do not yet perform optimal cue integration. Furthermore, it is unclear how such learning may be mediated solely on the basis of unsupervised learning. On the other hand, there is considerable evidence that animals and humans learn behaviors mediated by the reward system [19]. The neuronal signals involved in such learning have furthermore been shown to agree well with theoretical models related to reinforcement learning [18]. In the presented work we propose one way how to learn the ability to integrate two cues when they are probably coming from a single source and when to not integrate them, if it is more likely that they originate from different sources. The
position of auditory estimate
2009 IEEE 8TH INTERNATIONAL CONFERENCE ON DEVELOPMENT AND LEARNING
0 2 4 6 8 10 12 0
2
4
6
8
10
12
position of auditory estimate
position of visual estimate
0 2 4 6 8 10 12 0
2
4
6
8
10
12
position of visual estimate
Fig. 7. Policy of a fully trained agent for one quarter of the states (0,0 to 12,12). For three actions (1,6,11) it is shown in which states they predict the highest reward among all actions. States in which the model prefers action 1 are shown in black, action 6 in dark grey, action 11 in light grey. Top: without foveation, bottom: with foveation
6
need to visit each state-action pair a few times to adapt the predictions well enough. The numbers are however not so far away from what we think could happen in a real world process. Additionally we have not optimized the model with respect to running time (e.g different combination of learning rates) yet. The proposed model does not represent the involved uncertainties of the cues explicitly, but demonstrates behavior that is guaranteed to be optimal with respect to the expected total reward. We are not claiming that this is the only way a biological agent may learn how to do causal inference and how to integrate cues, when appropriate. Instead, we demonstrated that a simple reinforcement learning based agent is sufficient for learning such behavior, without explicitly providing it with the necessary model and without the agent having to explicitly represent the involved uncertainties. This suggests that even if a biological agent does learn causal inference and cue integration through some form of Bayesian data association algorithm, such learning could be aided by learning that is mediated by the reward system. While previous work has modeled the development of related abilities such as multisensory association [22], the continuing task–dependend adaption of cue weights [23], or multisensory enhancement [24], the present paper proposes a developmental model that learns cue integration and causal inference from continued interaction with the environment. Future work will aim at covering more aspects of multisensory integration such as the role of time, a more plausible neural implementation of the Q-function, and the ability to use sensory representations that implicitly represent uncertainty. ACKNOWLEDGEMENT
used task was to orient the agent towards the position in space with the highest expectation of reward. An auditory and a visual signal, either from a common or independent positions, in a discretized 1D world were the only noisy sensory inputs. The proposed model learned, using the SARSA algorithm, to behave optimally in this task solely based on the experience it accumulates while interacting with the environment. The learner does not start with a specific generative model ab initio and only has to learn the correct parameters, but it instead learns to integrate information only based on the feedback from the environment. By applying reward depending on the positional error the agent learned to behave according to the reliabilities of the single cues. Furthermore, the reinforcement learning based model also implicitly developed the ability to infer the number of causes of the input signals. In case the probability of a single cause is high enough, the model integrates the two signals with weights relating to their reliabilities. In the other case, it chooses the position solely based on the estimate of the more reliable cue. When the reliability of one cue is changing over positions (e.g. foveation), the agent uses different strategies depending on the position estimates of the two cues. As often happens in reinforcement learning models, we needed to provide a high number of training examples for the agent to learn good predictions. That is caused by the
The authors want to thank Cristina Savin as well as the reviewers for helpful comments on the manuscript. Authors J.T. and C.R. were supported by the EC MEXTproject PLICON, J.T. together with T.W. by the German Federal Ministry of Education and Research (BMBF) within the ”Bernstein Focus: Neurotechnology” through research grant 01GQ0840. Author T.W. gratefully acknowledges the financial support from Honda Research Institute Europe. R EFERENCES [1] K. P. K¨ording, U. Beierholm, W. J. Ma, S. Quartz, J. B. Tenenbaum, and L. Shams, “Causal inference in multisensory perception.” PLoS ONE, vol. 2, no. 9, 2007. [Online]. Available: http://dx.doi.org/10.1371/journal.pone.0000943 [2] M. Nardini, P. Jones, R. Bedford, and O. Braddick, “Development of cue integration in human navigation.” Current biology : CB, vol. 18, no. 9, pp. 689–693, May 2008. [Online]. Available: http://dx.doi.org/10.1016/j.cub.2008.04.021 [3] M. Gori, M. Del Viva, G. Sandini, and D. C. Burr, “Young children do not integrate visual and haptic form information,” Current Biology, vol. 18, no. 9, pp. 694–698, May 2008. [Online]. Available: http://dx.doi.org/10.1016/j.cub.2008.04.036 [4] Neil, A. Patricia, Chee-Ruiter, Christine, Scheier, Christian, Lewkowicz, J. David, Shimojo, and Shinsuke, “Development of multisensory spatial integration and perception in humans,” Developmental Science, vol. 9, no. 5, pp. 454–464, September 2006. [Online]. Available: http://dx.doi.org/10.1111/j.1467-7687.2006.00512.x [5] E. B. Johnston, B. G. Cumming, and A. J. Parker, “Integration of depth modules: stereopsis and texture.” Vision research, vol. 33, no. 5-6, pp. 813–826, 1993. [Online]. Available: http://view.ncbi.nlm.nih.gov/pubmed/8351852
2009 IEEE 8TH INTERNATIONAL CONFERENCE ON DEVELOPMENT AND LEARNING
[6] M. O. Ernst and M. S. Banks, “Humans integrate visual and haptic information in a statistically optimal fashion.” Nature, vol. 415, no. 6870, pp. 429–433, January 2002. [Online]. Available: http://dx.doi.org/10.1038/415429a [7] D. C. Knill and A. Pouget, “The bayesian brain: the role of uncertainty in neural coding and computation.” Trends Neurosci, vol. 27, no. 12, pp. 712–719, December 2004. [Online]. Available: http://dx.doi.org/10.1016/j.tins.2004.10.007 [8] K. P. P. K¨ording and D. M. M. Wolpert, “Bayesian decision theory in sensorimotor control.” Trends Cogn Sci, June 2006. [Online]. Available: http://dx.doi.org/10.1016/j.tics.2006.05.003 [9] N. W. Roach, J. Heron, and P. V. McGraw, “Resolving multisensory conflict: a strategy for balancing the costs and benefits of audio-visual integration.” Proc Biol Sci, vol. 273, no. 1598, pp. 2159–2168, September 2006. [Online]. Available: http://dx.doi.org/10.1098/rspb.2006.3578 [10] S. Gepshtein, J. Burge, M. O. Ernst, and M. S. Banks, “The combination of vision and touch depends on spatial proximity.” J Vis, vol. 5, no. 11, pp. 1013–1023, 2005. [Online]. Available: http://dx.doi.org/10.1167/5.11.7 [11] G. Thomas, “Experimental study of the influence of vision on sound localization,” Journal of Experimental Psychology, vol. 28, no. 2, pp. 163–177, February 1941. [12] M. T. Wallace and B. E. Stein, “Development of multisensory neurons and multisensory integration in cat superior colliculus.” The Journal of neuroscience : the official journal of the Society for Neuroscience, vol. 17, no. 7, pp. 2429–2444, April 1997. [Online]. Available: http://view.ncbi.nlm.nih.gov/pubmed/9065504 [13] ——, “Sensory and multisensory responses in the newborn monkey superior colliculus.” The Journal of neuroscience : the official journal of the Society for Neuroscience, vol. 21, no. 22, pp. 8886–8894, November 2001. [Online]. Available: http://view.ncbi.nlm.nih.gov/pubmed/11698600 [14] E. I. Knudsen, “Experience alters the spatial tuning of auditory units in the optic tectum during a sensitive period in the barn owl.” J Neurosci, vol. 5, no. 11, pp. 3094–3109, November 1985. [Online]. Available: http://view.ncbi.nlm.nih.gov/pubmed/4056865 [15] E. I. Knudsen and M. S. Brainard, “Visual instruction of the neural map of auditory space in the developing optic tectum.” Science (New York, N.Y.), vol. 253, no. 5015, pp. 85–87, July 1991. [Online]. Available: http://view.ncbi.nlm.nih.gov/pubmed/2063209 [16] M. T. Wallace and B. E. Stein, “Early experience determines how the senses will interact.” Journal of neurophysiology, vol. 97, no. 1, pp. 921–926, January 2007. [Online]. Available: http://dx.doi.org/10.1152/jn.00497.2006 [17] M. Radeau and P. Bertelson, “Auditory-visual interaction and the timing of inputs. thomas (1941) revisited.” Psychological research, vol. 49, no. 1, pp. 17–22, 1987. [Online]. Available: http://view.ncbi.nlm.nih.gov/pubmed/3615744 [18] R. Sutton and A. Barto, Reinforcement Learning: An Introduction. Cambridge, MA: MIT Press, 1998. [Online]. Available: citeseer.comp.nus.edu.sg/384587.html [19] W. Schultz, “Multiple reward signals in the brain.” Nat Rev Neurosci, vol. 1, no. 3, pp. 199–207, December 2000. [Online]. Available: http://view.ncbi.nlm.nih.gov/pubmed/11257908 [20] G. A. Rummery and M. Niranjan, “On-line q-learning using connectionist systems,” Tech. Rep., 1994. [21] S. Singh, T. Jaakkola, M. L. Littman, and C. Szepesv´ari, “Convergence results for single-step on-policyreinforcement-learning algorithms,” Mach. Learn., vol. 38, no. 3, pp. 287–308, 2000. [22] Y. Zhang and J. Weng, “Conjunctive visual and auditory development via real-time dialogue,” 2003. [Online]. Available: http://cogprints.org/3342/ [23] J. Triesch and C. von der Malsburg, “Democratic integration: self-organized integration of adaptive cues.” Neural computation, vol. 13, no. 9, pp. 2049–2074, September 2001. [Online]. Available: http://dx.doi.org/10.1162/089976601750399308 [24] T. J. Anastasio and P. E. Patton, “A two-stage unsupervised learning algorithm reproduces multisensory enhancement in a neural network model of the corticotectal system,” J. Neurosci., vol. 23, no. 17, pp. 6713–6727, July 2003. [Online]. Available: http://www.jneurosci.org/cgi/content/abstract/23/17/6713
7