2010 5th International Symposium on Wireless Pervasive Computing (ISWPC)
Capture Effect in IEEE 802.15.4 Networks: Modelling and Experimentation Cengiz Gezer #1 , Chiara Buratti #2 , Roberto Verdone #3 #
WiLab - DEIS, University of Bologna V.le Risorgimento, 2, I-40136 Bologna, Italy 1
[email protected] 2
[email protected] 3
[email protected]
Abstract—In this paper capture effect in IEEE 802.15.4 networks is studied, by means of mathematical analysis and experimentation. A Personal Area Network (PAN) composed of multiple nodes, which transmit data to a given sink by using the beacon-enabled mode of 802.15.4 Medium Access Control (MAC) protocol, is considered. Upon reception of the beacon transmitted by the PAN coordinator, the nodes transmit their packets using the slotted Carrier Sense Multiple Access with Collision Avoidance algorithm defined by the standard. A testbed composed of 802.15.4-compliant Freescale devices is used to measure the protection ratio, that is the minimum Signalto-Interference Ratio (SIR) which ensures the correct reception of majority of the packets. The result is, then, used to extend the developed mathematical model for beacon-enabled 802.15.4 networks. In contrast to the literature on the 802.15.4 MAC modelling, our model allows to compute the Packet Success Probability (PSP) of a node when capture effect is considered, in the scenario described. The impact of capture effect on the PSP, by varying the number of nodes, the propagation parameters and the protection ratio, is shown. The model is validated through simulations and experimental measurements. In both cases a very good agreement is found.
I. I NTRODUCTION The notion of ”capture effect” refers to the ability of a receiver to correctly receive a packet from a transmitter in the presence of simultaneous transmissions at the same carrier frequency (collisions) [1], [2], even at low values of the Signalto-Interference Ratio (SIR). Packet capture may happen inside the receiver because interference acts as additional noise; if the useful carrier power, C, is sufficiently larger than the sum of interfering carrier powers, I, the packet is successfully decoded with large probability. We denote this probability as Conditional Packet Capture Probability (CPCP), which is the probability that a packet is successfully decoded conditioned to a given value of the ratio C/I. The behavior of CPCP versus the C/I sometimes shows a step-wise behavior, taking value close to one if the SIR is larger than a given value, denoted as protection ratio (i.e., the minimum SIR ensuring the correct reception of a packet), and close to zero otherwise. This happens depending on the type of modulation format, coding scheme and receiver architecture. Under such circumstances, the Packet Success Probability (PSP), which is the probability that a packet is correctly received at the receiver, is just the probability that C/I is larger than the protection ratio. On the
978-1-4244-6857-7/10/$26.00 ©2010 IEEE
other hand, the protection ratio value, in general depends on the number of interferers, Ni , since for larger Ni the variance of the interference contribution increases, in a given C/I, and therefore CPCP gets smaller. In this paper we investigate packet capture in IEEE 802.15.4 networks through experimentation and mathematical modelling. IEEE 802.15.4 [3] is a short-range wireless technology intended for Personal Area Networks (PANs) with relaxed throughput and latency requirements. The 802.15.4 standard allows two types of channel access mechanisms: beacon and non beacon-enabled. The former uses slotted Carrier Sense Multiple Access with Collision Avoidance (CSMA/CA), with a superframe structure managed by the PAN coordinator. We consider a PAN composed of multiple devices (hereafter denoted as nodes) working in beacon-enabled mode, and a query-based application: each node upon reception of a periodic query from the coordinator (sent through the beacon packet), attempts to access the channel in order to transmit its data to a sink, through a direct link. In such scenario, we investigate the characteristics of capture effect in 802.15.4, which uses an OQPSK modulation format with direct sequence spread spectrum, that is difficult to study through mathematical analysis. A test-bed composed of a number of 802.15.4 standard-compliant Freescale devices is used to evaluate the behavior of the CPCP and to measure the protection ratio that allows the correct reception of a packet. These results are used to improve a mathematical model developed for the evaluation of the PSP. In contrast with the literature on 802.15.4 MAC modelling, we extend here the model described in [4] to account for capture effect and to provide more realistic performance in terms of PSP. Results show that capture effect strongly improves performance. Therefore, in this paper: (i) we rely on experimental measurements at the link level to show that the step-wise behavior of the CPCP versus C/I curve holds, while no evident dependence of the protection ratio on Ni is found (Section III); then, (ii) we use the protection ratio value determined, and evaluate performance in terms of PSP through extension of the mathematical model developed in [4] (Section IV); finally, (iii) we validate the extension through comparison with simulations, and experimental measurements at the network
204
layer: a very good agreement is found (Section V). A. Related works To the best of our knowledge, even though it has been shown that capture effect exists in a wide variety of transceivers including 802.11, Bluetooth radios and cellular systems, in the literature there are not many experimental studies in the literature related to capture effect in 802.15.4 transceivers. [5] presents an experimental study using coaxial media, allowing to realise very precise SIR measurements. However, due to the different nature of wireless channel with respect to coaxial medium, these results might give wrong insights of performance achieved in the real-word. In [6] the packet capture probability, when packets are not fully overlapped and received with different signal strengths, is provided. Conversely, in our work, packets are almost perfectly overlapped because of the slotted mechanism. Finally, [7] presents capture probability values for one interferer, and unstable results for multiple interferers, which is the result of a complex procedure based on the measurement of ambient noise levels. In our study we have found out stable values for packet capture probabilities for one and more than one interferer. Regarding the model for the 802.15.4 MAC protocol, there exist different works in the literature [8], [9], [10]. However, as stated in [4], none of these models could be applied to query-based applications, where nodes have only one packet per query to be transmitted. All these works, in fact, are based on Bianchi’s model and they assume that each packet collides with constant and independent probability, regardless of the backoff stage [11]. This approximation is proper for the above mentioned studies, being the number of nodes competing for the channel constant in time, but it is not suitable to our application, where the number of nodes accessing the channel decreases in time, which results as a decrease in the probability of collision. Moreover some of these models (e.g., [8], [10]) do not show a good agreement with simulation results and none of them compares the model results with experimental measurements. The model presented in [4] and extended here, on the contrary, perfectly match simulations and also experimental measurements, as will be shown in the paper. Finally, note that none of the above mentioned models take into account capture effect. II. T HE 802.15.4 MAC PROTOCOL
IN BEACON - ENABLED
MODE
According to the 802.15.4 MAC protocol in beacon-enabled mode [3], the access to the channel is managed through a superfrarme, starting with a packet, called beacon, transmitted by the PAN coordinator. The superframe is divided into two parts: a Contention Access Period (CAP), during which nodes use a slotted CSMA/CA, and a Contention Free Period (CFP), containing a maximum number of seven Guaranteed Time Slots (GTSs), that can be allocated by the coordinator to specific nodes. The use of GTSs is optional and they are not allocated in this paper. The superframe duration, denoted as Tq , depends on the value of an integer parameter ranging from
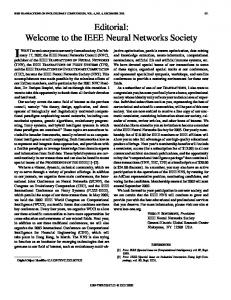
0 to 14, called superframe order denoted as SO, and is given by: Tq = 960 · 2SO · Ts , where Ts =16 µsec is the symbol time. The CSMA/CA algorithm is implemented using units of time called backoff periods: a backoff period has a duration, denoted as db , equal to 20Ts . Each node maintains two variables for each transmission: N B and BE. N B is the number of times the CSMA/CA algorithm was required to backoff while attempting the current transmission; its initial value is 0 and its maximum value is N Bmax . BE is the backoff exponent related to the maximum number of backoff periods a node will wait before attempting to assess the channel; its initial value is BEmin , and its maximum value is BEmax . In CSMA/CA first, N B and BE are set to the initial values. Then, the node enters in backoff for a random number of backoff periods in the range (0, 2BE − 1) [step (1)]. After this delay, the node performs sensing for two subsequent backoff periods. If the channel is found free in both the backoff periods, the transmission starts. Otherwise, if it is found busy (during the first or the second backoff period), N B and BE are increased by 1, ensuring that BE is not larger than BEmax . If the value of N B is lower or equal to N Bmax , the algorithm returns to step (1); otherwise the algorithm will unsuccessfully terminate, meaning that the node does not succeed in accessing the channel. III. C APTURE E FFECT: E XPERIMENTAL M EASUREMENTS A series of measurements have been conducted in order to find out CPCP with respect to varying SIR values. In an office environment 802.15.4 standard-compliant devices produced by Freescale have been used in the experiments. A PAN composed of a coordinator and a number of nodes is established at the beginning of each experiment: the coordinator performs energy detection scan in all the available channels and selects the less noisy one. After the PAN formation, nodes start transmissions in each beacon interval. The sniffer receives the 20 bytes long packets coming from nodes and sends them to a PC to be processed. The measurement setup for the two interferers case can be seen in Figure 1. 13192-SARD and 13192-EVB boards have been used for the coordinator and the nodes of the PAN. These two boards contain MC13192 transceivers. The sniffer used, instead, is the 1322XUSB board, which has a microcontroller and a transceiver platform in a single chip, namely MC13224V. All the transceivers used in the experiments operate in 2.4 GHz ISM band and the maximum transmit power of 3.6 dBm is used. The distance between transmitters and sniffer were around 70 cm and they were located over a office table 60 cm above the ground. A. Conditional Packet Capture Probability Measurements (CPCP) In the IEEE 802.15.4 standard [3] LQI is defined as the strength and/or the quality of a received packet. The standard defines three options to measure LQI: the Received Signal Strength (RSS) estimation, the Signal-to-Noise Ratio (SNR) estimation or a combination of these two methods.
205
Conditional Packet Capture Probability
1
Fig. 1.
Fig. 2.
0,7
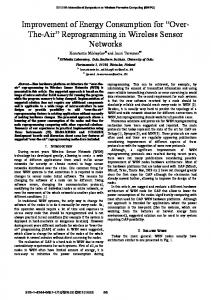
1 Interferers 2 Interferers 3 Interferers 4 Interferers Average Step Function
0,5
0,3
0,1 0 −4
Experimental Setup for Two Interferers.
0,9
−3
Fig. 3.
Example Timing for Two Interferers.
While Chipcon C2420 transceivers, widely used in the literature, measures the average chip correlation in order to estimate the SNR and reports this value as LQI [12], the devices used in our test bed estimate the RSS. In 802.15.4 Freescale reference manual [13], the LQI is described as an integer value from 0x00 to 0xFF, which is linearly mapped to the RSS as being 0x00=-100dBm and 0xFF=-15 dBm. Therefore, to derive the RSS value from the LQI, we used the following linear formula: RSS[dBm] = (85 ∗ LQI)/255 − 100. In order to measure CPCP a deliberate collision is forced in each superframe. Upon reception of the beacon, each node transmitted a packet with BEmin = 0, resulting a transmission at the same time. Just after this collision, nodes sent another packet, but this time setting BEmin = BEmax = 3 and N Bmax = 0, to avoid collisions. Since RSS values of collided packets ,except the captured, can not be obtained these second transmissions are introduced in order to estimate a C/I at the instance of collision. In Figure 2 an example of transmissions performed in each superframe when two interferers are present is shown. The collision happens 3840 µs after the beacon and then second packets come from device C and the interferer devices I1 and I2 in random places. In case another collision during the second transmissions happened, this superframe was not considered to evaluate the CPCP. It is worth to notice that, having the time gap between the collision and the transmission of the second packets less than 6.4 ms, it is reasonable to use the RSS values measured after the collision to compute the SIR, since RSSs cannot significantly change in such short interval of time. For each superframe the C/I ! value was computed (being Ni C = RSSC and I = 10 log( i=1 10RSSIi /10 )) and the information whether the packet was captured or not (for that specific value of C/I) was stored. Finally, for each C/I value the CPCP was evaluated as the ratio between the number of packets captured and the number of superframes. Experiments
−2
−1
0
1,3
2
C/I [dB]
3
4
5
6
7
Conditional Packet Capture Probability.
were conducted until at least 104 samples were transmitted for each value of C/I. The CPCP as a function of C/I is presented in Figure 3 up to four interferers. No significant dependence of the CPCP curve on the number of interferers is present. In order to visualize the general behavior we have then averaged the values for different interferers and applied piecewise linear fit. The piece-wise average curve can be seen in the graph. Furthermore, to model the capture effect the CPCP curve can simply be collapsed to a step function as shown in the figure. Finally, the protection ratio can be assigned to 1.3 dB which ensures correct reception of majority of the packets. In the mathematical model, this value is used. During the experiments locations of the sniffer and the nodes were random places over a table, quite often we have changed the positions as well: no significant correlation between the location of the devices and the calculated CPCP, were found. This justifies the use of the RSS values of the packets coming after the collision as an estimate to the C/I: RSS values are stable enough in such a short time interval. IV. C APTURE E FFECT: M ATHEMATICAL M ODEL We consider an 802.15.4 network, composed of N nodes transmitting through direct links to a sink. Let us assume that nodes are uniformly distributed over a circle, having ray R, and that the sink is located in the center of the circle. Let us also assume that each node can reach the sink (no connectivity losses) and can hear every other transmission occurring in the channel [4]. Nodes transmit packets having size D·10 bytes, being D an integer parameter. In this section the mathematical model for the 802.15.4 MAC protocol in beacon-enabled mode, introduced in [4], is extended to account for capture effect. In particular, the model describes the behavior of a node accessing the channel by using the slotted CSMA/CA algorithm and allows the evaluation of the PSP, that is the probability that the node transmits with success the packet to the sink, by the end of the superframe. According to our application scenario, in fact, each node has one packet to be transmitted per beacon received and has to transmit it by the end of the current superframe. The impact of capture effect on the success probability is studied and shown here. In the following some details about the model developed in [4] are reported and the extension of the model to account
206
for capture effect is provided. Finally, numerical results are shown. A. The Mathematical Model The PSP, denoted hereafter as ps , depends on the probability that a node transmits its packet, which is a function of the probability that the node senses the channel and finds it free for two subsequent slots. To derive the above mentioned probabilities, in [4] we model the generic state in which a node could be and we develop a finite-state transmission diagram to evaluate the probability that a node is in a given state (i.e., backoff, sensing, transmission and idle) at a given slot. A slot coincides with the backoff period and all the probabilities are evaluated for all the slots in the superframe (i.e., Tq /db slots). From the study of the diagram we can derive the probability that a node is in the second sensing phase at the j-th slot and in the i-th backoff stage, denoted as P{S2ji }, being P{.} the probability that a given event happens. Note that this probability is evaluated for all the slots j and for all the N Bmax + 1 backoff stages. For the sake of conciseness, we refer to [4] for the formulas of P{S2ji }. By denoting as P{Z j } the probability that a successful transmission ends in slot j, we have
P{C j } is the probability of being in the second sensing phase (i.e., when CW = 1) at the slot whatever is the !j-th NB backoff stage, given by P{C j } = k=0max P{S2jk }. Finally, f j is the joint probability to find the channel free in slot j and in slot j − 1, that is the probability that a node starting sensing in slot j − 1 finds the channel free for two subsequent slots. Since this happens if no transmissions start in slot j, j − 1, up to j − D, f j is given by [4]:
j
f =1−
v=j−D
ps =
f
j−1
$
· 1−
(1 −
Nc −1 P{S2j−2 k })
k=0
%
,
B. Extension: Capture Effect When capture effect is taken into account, a packet may be captured even in case of collisions, therefore the probability P{Z j } becomes: P{Z j }CE = f j−D · P{C j−D } · pc,Ni · · P{C j−D }Ni
P{Z j } .
NB max #
(3) &N B Nc −1 where f j−1 [1 − k=0max (1 − P{S2j−2 ] is the probak }) bility that at least one transmission starts in slot j.
Tq /db −1
"
j "
NB max #
'
( Nc − 1 Ni
(1 − P{S2j−D })Nc −Ni −1 , k
k=0
(1)
(4)
j=0
Before introducing the derivation of P{Z j }, we need to underline that in the following we will denote as Ncj the number of nodes accessing to the channel in slot j. It is a random variable, binomially distributed, difficult to model. Hence, to reduce the computational complexity in [14], [4] we introduced an approximation, by simply setting Ncj = Nc = N , whatever j is. In [4] and also at the end of this section, simulations are compared with the mathematical results. Results show that a very good agreement with simulations is obtained through the model, despite the approximation introduced. When no capture effect is accounted for, the probability that the coordinator correctly receives the tail of a packet in slot j, is the probability that one and only one transmission starts in j − D + 1. This is due to the fact that we consider packets having a size of D · 10 bytes, that occupy D slots (since a bit rate of 250 kbit/sec is used). As only one transmission starts in slot j − D + 1 if only one node, over Nc , senses the channel in slot j − D and if the channel is free in j − D and j − D − 1, P{Z j } is given by:
j
P{Z }nCE = f
j−D
·P{C
j−D
}·
NB max # k=0
(1−P{S2j−D })Nc −1 , k
(2) where the second factor gives the probability that one node senses the channel in j − D, whatever the backoff stage, and the third factor gives the probability that the remaining Nc − 1 nodes do not sense the channel in slot j − D.
where pc,Ni is the probability that a packet is captured, when Ni interfering nodes are present. According to the results found in Section III, if the ratio C/I is larger than the protection ratio, denoted as α in the following, the useful packet is received. Therefore, pc,Ni is the probability that the above condition is verified. This probability will be exactly evaluated for the case Ni = 1, whereas an approximated model will be used for the cases Ni > 1: comparison with simulation results show a good agreement also for such cases. In particular, in case of one interference (Ni = 1), pc,1 will be given by: * * ) ) 1 du C (5) ≥α =P ≤ α− β , pc,1 = P I di where β is the propagation constant and du and di are the distances between the coordinator and the useful and interference nodes, respectively. From [15] (see page 186), we achieve that: ) * + +∞ + yz x P ≥z = fxy (x, y)dx dy (6) y y=0 x=0 when x and y are non negative random variables (r.v.s) and fxy (x, y) is the joint probability density function (p.d.f.). In 1 our case we have x = du , y = di and z = α− β . Being nodes uniformly distributed over the circle, du and di are 2x independent r.v.s with the same p.d.f., given by: fx (x) = R 2 for x ≤ R and zero, otherwise.
207
Therefore, we achieve: + +∞ + yz 2x 2y pc,1 = dx dy 2 R2 R 0 0 2 + R + yz 4 z2 α− β = 4 ydy xdx = = . R 0 2 2 0
no capture effect "1 interf": α=4 dB, β=2 "1 interf": α=4 dB, β=4 "1 interf": α=2 dB, β=4 "Ni interf": α=1.3 dB, β=3
1
0.8 ps
(7)
0.6
In general, when more than one interferer is present, we have: , C ≥α . (8) pc,Ni = P !Ni i=1 Ii
0.4
0
5
10
15
20
N
Fig. 4.
ps as a function of N when capture effect is considered and not.
By increasing Ni the complexity in the exact evaluation of Eq. (8) increases. To simplify the analysis, we assume that the interferers are all at the same distance di , which brings to:
2
(9)
In this section the extension of the model introduced in this paper is validated through comparison with simulations. For the purpose of numerical comparison, a dedicated simulation tool written in C language, has been developed. The scenario simulated consists of N nodes distributed over a circle, having radius R, and a sink, located in the center of the circle waiting for the data from nodes. In each superframe, nodes receive the beacon and transmit directly to the sink the data, by using the 802.15.4 CSMA/CA protocol. We assume that each node can reach the sink and can hear each other. Capture effect is considered: a packet is captured even in case of collisions if C/I ≥ α. We consider 104 rounds in our simulations. The comparison is provided in Figure 4, where the PSP ps as a function of N is shown: the curves are related to mathematical model results, whereas points are simulation results. In this figure we set SO = 2, D = 2 and R = 10 m. To underline the impact of capture effect, also the curve achieved with the model described in Section IV-A is shown. In such case no comparison with simulation results is provided, since the model has been already validated in [4] through simulations. The validation of such model via experimental measurements comparison is, instead, included in section V. In particular, to show the precision of the model for the case Ni = 1, we compare simulation and mathematical results by assuming, in both tools, that a packet could be captured only if Ni ≤ 1 and condition C/I ≥ α is satisfied. Therefore, in case Ni > 1 the packet is lost. We denote this case as ”1 interf” in Figure 4. Then, for the sake of completeness, we also consider the general case in which capture effect is applied whatever is the number of interfering nodes. In this case the approximated formula (9) is applied to the model. Note also that in this case, we set α = 1.3 dB, that is the value achieved from the experimental measurements (see Section III). We denote this case as ”Ni interf” in Figure 4. The impact of capture effect and of the parameters α and β is shown: as expected, the PSP increases when capture effect
C. Numerical Results
pc,Ni
(Ni α)− β =∼ . = 2
Fig. 5.
Experimental setup with four devices.
is considered and gets larger by decreasing α and increasing β. As can be seen the overlapping between simulation and mathematical model results, in the case ”1 interf”, is perfect. The comparison in the ”Ni interf” case shows that the approximation introduced is good. In such case we set β = 3. Note that ps , in the latter case, increases since a packet may be captured even if more than one interfering nodes are present. V. VALIDATION THROUGH T EST-B ED In order to verify the mathematical model results, another measurement setup has been prepared. Similar to the previous measurement the MC1322XUSB used to sense the packets from the nodes in a star topology. The same transmission power and environment described in Section III is used. In Figure 5 the test bed with four devices, is shown. During the experiments, just after the reception of the beacon, nodes used CSMA/CA algorithm to access the channel. As in the model assumption, only one packet per superframe is generated by nodes and in case a node cannot access the channel by the end of the superframe the packet is considered lost. We set BEmin = 3, BEmax = 5, N Bmax = 4 and SO = 2 and we generated at least 104 superframes. For up to four devices and packet lengths of 20, 40, 60 bytes, ps values are computed. In order to compare the model when capture effect is accounted for and when not, during the experiments the PSP was evaluated in two different ways: (i) packet capture is considered as a failure (”no CE” case in the Figures); (ii) packet capture is considered as a successful reception (”CE” in the Figures). Therefore the model described in [4] is used
208
VI. C ONCLUSIONS In this paper a mathematical model accounting for the capture effect has been introduced, and validated by computer simulation and experimentation. The steps followed are: (i) we have found via experimental activity that the CPCP versus C/I curve shows a step-wise behavior, and that the protection ratio does not depend on the number of interferers; then, (ii) we used the C/Imin value determined, and evaluated the performance in terms of PSP through extension of the mathematical model developed in [4] for 802.15.4 networks in beaconenabled mode; finally, (iii) we validated the extension through comparison with simulations, and experimental measurements at the network layer: a very good agreement is found.
(a) 1 0.9
p
s
0.8 0.7 0.6 0.5 1
experiment: CE, D=2 model: CE, D=2 experiment: No CE, D=2 model: No CE, D=2 2
3
N
4
(b)
(c) 1 0.9
0.8
0.8 s
s
1 0.9
p
p
in the former case, whereas the extension model described in this paper is used in the later case. Regarding the experiments, when packet capture is considered as successful reception, the PSP is simply computed by dividing the number of received packets by the number of packets sent. When, instead, collisions must be considered as failures (”no CE” case), we removed all the collided packets from the number of received packets and we divided the result by the number of packets sent. When dealing with such evaluation some ambiguities, in the determination of which packets are received without collision or despite the collision, may arise. As an example, in a network of three nodes if only one of the three packets is received in the beacon interval two situations might have happened: (i) one collision between the two packets (receiver doesn’t capture any of the packets) and one reception without collision; (ii) collision between all the three packets, with a capture of one of them. To resolve this kind of ambiguities following assumptions have been done. It has been assumed that packets are lost only in the case of collisions (no physical layer losses). This assumption is very likely since we have measured packet receive rate for one device more than 99.9% in the same environment. Moreover, it is assumed that a collision always ends up with the capture of a packet: this can be achieved by locating the transmitters at different distances to the sniffer. Therefore, in the three nodes example above, to exclude capture effect we considered all the packets lost, even though one of the collided packets is received. In Figure 6 the PSP as a function of N for different values of D, when capture effect is considered and not considered is shown. A good agreement between the mathematical analysis and experimental measurement results was found in all cases. In the experiments the PSP is computed by averaging the PSP over the N nodes. Individual nodes were in random, non fixed positions during the experiments. Results validate the model and show that the approximation introduced to simplify the analysis (i.e., the assumption that interfering nodes are at the same distance from the sink) does not significantly affect the performance of the model, at least for the set of parameters considered here.
0.7 0.6 0.5 1
0.7 0.6
experiment: No CE, D=4 model: No CE, D=4 2
N
3
4
0.5 1
experiment: No CE, D=6 model: No CE, D=6 2
N
3
4
Fig. 6. (a) ps values for 20 bytes packets, (b) ps values for 40 bytes packets, (c) ps values for 60 bytes packets
VII. ACKNOWLEDGMENT This work was supported by the Artemis project eDIANA (grant agreement no. 100012). R EFERENCES [1] C. Namislo, “Analysis of mobile radio slotted aloha networks,” IEEE Trans. Veh. Technol., vol. VT-83, pp. 199–204, Aug. 1984. [2] Y. Onozato, J. Liu, and S. Noguchi, “Stability of a slotted aloha system with capture effect,” IEEE Trans. Veh. Technol., vol. 38, pp. 31–36, Feb 1989. [3] IEEE 802.15.4 Standard, Part 15.4: Wireless Medium Access Control (MAC) and Physical Layer (PHY) Specifications for Low-Rate Wireless Personal Area Networks (LR-WPANs). Piscataway, New Jersey, 088551331: IEEE, 2006. [4] C. Buratti, “A mathematical model for performance of ieee 802.15.4 beacon-enabled mode,” in Proc. of IEEE IWCMC 2009, Leipzig, Germany, Jun 2009. [5] K. P. Subbu and I. Howitt, “Empirical study of ieee 802.15.4 mutual interference issues,” in SoutheastCon, 2007, Richmond, Virginia, USA, March 2007. [6] K. Whitehouse, A. Woo, F. Jiang, J. Polastre, and D. Culler, “Exploiting the capture effect for collision detection and recovery,” in IEEE Workshop on Embedded Networked Sensors (EmNetS-II), Sydney, Australia, May 2005. [7] D. Son, B. Krishnamachari, and J. Heidemann, “Experimental study of concurrent transmission in wireless sensor networks,” in International Conference on Embedded Networked Sensor Systems (SenSys 06), Boulder, Colorado, USA, May 2006. [8] J. Misic, S. Shafi, and V. B. Misic, “Maintaining reliability through activity management in an 802.15.4 sensor cluster,” IEEE Trans. Veh. Technol., vol. 3, pp. 779–788, May 2006. [9] S. Pollin, M. Ergen, S. Ergen, B. Bougard, L. V. der Pierre, F. Catthoor, I. Moerman, A. Bahai, and P. Varaiya, “Performance analysis of slotted carrier sense ieee 802.15.4 medium access layer,” IEEE Trans. Wireless Commun., vol. 7, pp. 3359–3371, Sep. 2008. [10] Z. Chen, C. Lin, H. Wen, and H. Yin, “An analytical model for evaluating ieee 802.15.4 csma/ca protocol in low rate wireless application,” in Proc. IEEE AINAW 2007, 2007. [11] G. Bianchi, “Performance analysis of the ieee 802.11 distributed coordination function,” IEEE J. Sel. Areas Commun., vol. 18, pp. 535–547, Mar. 2000. [12] “Chipcon c2420 2.4 ghz ieee 802.15.4 / zigbee-ready rf transceiver data sheet,” Texas Instruments Norway AS, 2008, sWRS041B. [13] Freescale 802.15.4 MAC PHY Software Reference Manual, Freescale Semiconductor, Inc., Chandler, Arizona, USA, May 2009, rev. 2.1. [14] C. Buratti and R. Verdone, “Performance analysis of ieee 802.15.4 nonbeacon enabled mode,” IEEE Trans. Veh. Technol, vol. 58, pp. 3480– 3493, 2009. [15] A. Papoulis and S. U. Pillai, Probability, Random Variables and Stochastic Processes. New York, NY, USA: McGraw-Hill, 2002.
209


![Optical Networks [Book Reviews] - IEEE ... - IEEE Xplore](https://m.moam.info/img/260x300/optical-networks-book-reviews-ieee-ieee-xplore_59dba1291723dd46dfe54bf8.jpg)