Int. J. Environ. Res. Public Health 2015, 12, 10995-11011; doi:10.3390/ijerph120910995 OPEN ACCESS
International Journal of Environmental Research and Public Health ISSN 1660-4601 www.mdpi.com/journal/ijerph Article
Capturing the Interrelationship between Objectively Measured Physical Activity and Sedentary Behaviour in Children in the Context of Diverse Environmental Exposures Tarun R. Katapally 1,2,* and Nazeem Muhajarine 1,3 1
2
3
Department of Community Health and Epidemiology, College of Medicine, University of Saskatchewan, Saskatoon S7N 5E5, Saskatchewan, Canada; E-Mail:
[email protected] Johnson Shoyama Graduate School of Public Policy, University of Regina, Regina S4S 7H1, Saskatchewan, Canada Saskatchewan Population Health and Evaluation Research Unit (SPHERU), University of Saskatchewan and University of Regina, Saskatoon S7N 5E5, Saskatchewan, Canada
* Author to whom correspondence should be addressed; E-Mail:
[email protected]; Tel.: +1-306-585-4544. Academic Editors: Harry Timmermans, Astrid Kemperman and Pauline van den Berg Received: 7 July 2015 / Accepted: 27 August 2015 / Published: 7 September 2015
Abstract: Even though physical activity and sedentary behaviour are two distinct behaviours, their interdependent relationship needs to be studied in the same environment. This study examines the influence of urban design, neighbourhood built and social environment, and household and individual factors on the interdependent relationship between objectively measured physical activity and sedentary behaviour in children in the Canadian city of Saskatoon. Saskatoon’s built environment was assessed by two validated observation tools. Neighbourhood socioeconomic variables were derived from 2006 Statistics Canada Census and 2010 G5 Census projections. A questionnaire was administered to 10–14 year old children to collect individual and household data, followed by accelerometry to collect physical activity and sedentary behaviour data. Multilevel logistic regression models were developed to understand the interrelationship between physical activity and sedentary behaviour in the context of diverse environmental exposures. A complex set of factors including denser built environment, positive peer relationships and consistent parental support influenced the interrelationship between
Int. J. Environ. Res. Public Health 2015, 12
10996
physical activity and sedentary behaviour. In developing interventions to facilitate active living, it is not only imperative to delineate pathways through which diverse environmental exposures influence physical activity and sedentary behaviour, but also to account for the interrelationship between physical activity and sedentary behaviour. Keywords: active living research; ecological perspective; urban design; built environment; home environment; social environment; children; moderate to vigorous physical activity; light physical activity; sedentary behaviour
1. Introduction The benefits of physical activity (PA) have been well established, and, independent of PA, sedentary behaviour (SB) has emerged as an important factor that influences a wide range of health outcomes [1–3]. Despite this evidence, physical inactivity has reached pandemic levels [4], with the majority of children not accumulating recommended levels of PA [5]. As behavioural interventions directed at individuals have not produced a change at the population level in curbing PA, an ecological perspective called active living research has gained prominence. Active living research is an inter-disciplinary field of study that focuses on the influence of multilevel environmental exposures on PA and SB [6,7]. Active living evidence on PA in children has revealed a complex picture, where the roles of multilevel environmental determinants (urban design, neighbourhood built and social environment, school environment, and home environment) on PA have been emphasized [8–12]. Specific to SB among children, initial findings suggest a stronger role of home environment, with parental support and higher socioeconomic status being associated with lower SB [13–24]. One finding that has been consistently reported, but not well explored, is low PA among children on weekend days [25–27]. Emerging evidence also indicates that independent of PA, SB can be higher on weekend days [27]. Lower PA and SB during weekends could be the result of differential environmental exposure between weekdays and weekend days, and could ultimately influence overall PA and SB (weekdays plus weekend days). Although considerable research is being directed to study both PA and SB in children, there is a clear evidence gap regarding the interplay between PA and SB, and how these two behaviours interact with each other within the wider context of varied environmental exposures. A recent meta-analysis by Pearson et al. explored the relationship between PA and SB among children and adolescents and concluded that even though SB is inversely associated with PA, these behaviours should not be considered as functional opposites [28]. More importantly, with the increasing usage of accelerometers [27], the entire range of waking activity is being objectively segregated into different intensities of activity (SB, moderate to vigorous PA (MVPA), and light PA (LPA)), where MVPA and LPA together depict total PA. Current PA guidelines for children recommend at least 60 minutes of MVPA every day [29]. However, on any given day, children can accumulate this recommended quantity of MVPA, and still remain sedentary for most of the day [30]. To date, SB guidelines focus on only minimizing screen time and not the complete range of SB [31]. Moreover, researchers are now recommending a ‘whole
Int. J. Environ. Res. Public Health 2015, 12
10997
day’ approach to healthy, active living by achieving or exceeding recommended MVPA, minimizing SB and maximizing LPA [32]. In developing active living interventions, it is imperative to understand the complex interplay of PA and SB in the context of the environmental exposures that influence them, especially in children and adolescents, as both these behaviours could track into adulthood [13,33]. This study is aimed to examine the influence of urban design, neighbourhood built and social environment, and household and individual factors on the interdependent patterns of objectively measured MVPA, LPA and SB in children aged 10–14 years in the Canadian prairie city of Saskatoon. In exploring these relationships, the influence of weekend activity has been taken into account. 2. Materials and Methods The study is part of an active living research initiative in Saskatoon, Saskatchewan, Canada (www.smartcitieshealthykids.com). The study was conducted in accordance with the Declaration of Helsinki, and the protocol was approved by the University of Saskatchewan’s Research Ethics Board (BEH 14-222).
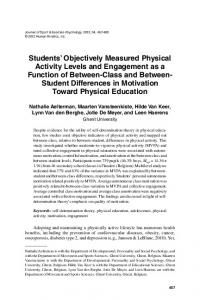
Figure 1. Urban design of Saskatoon depicting the three types of neighbourhoods (grid; fractured grid; curvilinear).
Int. J. Environ. Res. Public Health 2015, 12
10998
2.1. Urban Design of Saskatoon Presently Saskatoon’s metropolitan area population of 260,600 is spread across 65 well-defined neighbourhoods [34], where the city plays a major role in urban planning including the geographic allocation of commercial, residential and institutional establishments. In 2010, when urban design data for this study were collected, Saskatoon consisted of 60 residential neighbourhoods. The neighbourhoods designed prior to 1930 surround the city centre and follow a traditional grid-patterned street design (Figure 1—Planning Era 1), typified by higher density, mixed-use neighbourhoods connected by straight, intersecting streets and back alleys. The semi-suburban neighbourhoods built between 1931 and 1966 follow a fractured grid-pattern (Figure 1—Planning Era 2). They are predominantly residential, with lower density and become progressively car-oriented as the distance from the urban centre increases. Finally, the suburban neighbourhoods built after 1967 follow curvilinear street patterns (Figure 1—Planning Era 3), characterized by low-density, almost exclusively residential and highly car-oriented configurations. Working with the City of Saskatoon’s Neighbourhood Planning Department, our Smart Cities, Healthy Kids research team has validated the three types of neighbourhoods belonging to the three different planning eras [35]. 2.2. Neighbourhood Selection and Recruitment The neighbourhood selection and recruitment were part of the Smart Cities Healthy Kids initiative. The sampling frame for recruiting children consisted of all 60 residential neighbourhoods in 2010 in Saskatoon categorized into the three types of neighbourhoods (Figure 1). The recruitment was conducted through 30 elementary schools representing all three types of neighbourhoods. The total study sample was representative of all 60 neighbourhoods. Working with our public and Catholic school board partners, we identified four classrooms at each elementary school (grades 5 to 8) for recruitment. After preparing the schools, a letter explaining the study was sent out to children’s primary caregivers through schools with an invitation to participate in the study. Of the 1610 children aged 10–14 years that agreed to participate in the Smart Cities Healthy Kids initiative, 455 children agreed to participate in accelerometry. This study exclusively focuses on children who participated in accelerometry. 2.3. Built Environment Measures In 2009, two validated tools called the neighbourhood active living potential and the Irvine-Minnesota inventory were used to measure specific aspects of built environment [36,37] of Saskatoon. Neighbourhood active living potential is an 18-item tool that was replicated by our team by adding a new dimension called universal accessibility (which measures disabled individuals’ access to built environment) to existing dimensions of safety, density of destinations and activity friendliness [38]. In implementing this tool, pairs of observers independently rated neighbourhood built environment by travelling a predetermined walking route created by random selection and connection of street segments. The inter-observer reliability for neighbourhood active living potential was above 80% [38]. Similarly, two observers were employed to administer the Irvine Minnesota Inventory (inter-observer reliability above 70%) to measure the built environment of neighbourhoods in five dimensions: diversity of destinations, pedestrian access, attractiveness, and safety from traffic and
Int. J. Environ. Res. Public Health 2015, 12
10999
crime [37]. In both built environment tools, safety is measured as the observers’ perceived neighbourhood safety. 2.4. Census-based Measures Neighbourhood level socioeconomic variables were derived from 2006 Statistics Canada Census data and 2010 G5 Census projections to account for neighbourhood social environment [39,40]. 2.5. Individual and Household Data In 2010, after obtaining written informed consent from parents/guardians on behalf of their children and prior to deploying accelerometers, Smart Cities Healthy Kids questionnaire (Supplementary file) was administered to children to capture their perception of a range of factors (household, parental, peer and neighbourhood) that influence PA. The questionnaire was pilot tested and revised as appropriate prior to field implementation. The questionnaire contained items such as: “In the last 30 days, how often have your family members provided transportation to a place where you can do PA?” and “During a typical week, how often did your friends ask you to walk or bike to school or to a friend’s place?” 2.6. Accelerometry Actical accelerometers (Mini Mitter Co., Inc., Bend, OR, USA) were deployed through schools from April to June in 2010 to capture activity data of 455 children residing in Saskatoon. Children were visited at their respective schools and were asked to wear the accelerometer equipped belt around their waist to maintain proper positioning (i.e., posterior to the right iliac crest of the hip) for 7 consecutive days. They were advised to remove the accelerometers during nighttime sleep and during any water-based activities. The devices were operationalized to measure data at 12:00 a.m. on the day following device deployment (i.e., almost a full day after the device was deployed) to minimize the potential for subject reactivity within the first day of wearing the accelerometer. Accelerometers were pre-programmed to measure movement in 15-second epochs in order to capture the sporadic nature of children’s activity. The raw accelerometer data were analyzed using KineSoft version 3.3.63 (KineSoft, Loughborough, UK) to derive activity intensities using cut-points specific to the study sample’s age group—SB: