Biogeosciences, 12, 7223–7237, 2015 www.biogeosciences.net/12/7223/2015/ doi:10.5194/bg-12-7223-2015 © Author(s) 2015. CC Attribution 3.0 License.
Carbon dynamics in highly heterotrophic subarctic thaw ponds T. Roiha1,3 , I. Laurion2 , and M. Rautio1,3 1 Department
of Biological and Environmental Science, 40014 University of Jyväskylä, Finland Eau Terre Environnement and Centre for Northern Studies (CEN), Institut national de la recherche scientifique, Quebec G1K 9A9, Canada 3 Département des sciences fondamentales and Centre for Northern Studies (CEN), Université du Québec à Chicoutimi, Quebec G7H 4W2, Canada 2 Centre
Correspondence to: M. Rautio (
[email protected]) Received: 30 June 2015 – Published in Biogeosciences Discuss.: 29 July 2015 Revised: 24 November 2015 – Accepted: 25 November 2015 – Published: 10 December 2015
Abstract. Global warming has accelerated the formation of permafrost thaw ponds in several subarctic and arctic regions. These ponds are net heterotrophic as evidenced by their greenhouse gas (GHG) supersaturation levels (CO2 and CH4 ), and generally receive large terrestrial carbon inputs from the thawing and eroding permafrost. We measured seasonal and vertical variations in the concentration and type of dissolved organic matter (DOM) in five subarctic thaw (thermokarst) ponds in northern Quebec, and explored how environmental gradients influenced heterotrophic and phototrophic biomass and productivity. Late winter DOM had low aromaticity indicating reduced inputs of terrestrial carbon, while the high concentration of dissolved organic carbon (DOC) suggests that some production of nonchromophoric dissolved compounds by the microbial food web took place under the ice cover. Summer DOM had a strong terrestrial signature, but was also characterized with significant inputs of algal-derived carbon, especially at the pond surface. During late winter, bacterial production was low (maximum of 0.8 mg C m−3 d−1 ) and was largely based on free-living bacterioplankton (58 %). Bacterial production in summer was high (up to 58 mg C m−3 d−1 ), dominated by particle-attached bacteria (67 %), and strongly correlated with the amount of terrestrial carbon. Primary production was restricted to summer surface waters due to strong light limitation deeper in the water column or in winter. The phototrophic biomass was equal to the heterotrophic biomass, but as the algae were mostly composed of mixotrophic species, most probably they used bacteria rather than solar energy in such shaded ponds. Our results point to a strong heterotrophic energy pathway in these thaw pond ecosys-
tems, where bacterioplankton dominates the production of new carbon biomass in both summer and winter.
1
Introduction
Traditional view of inland waters as sinks of carbon has changed during the past decades, and, at present, lakes and ponds are considered net sources of carbon to the atmosphere (Tranvik et al., 2009). Increasing attention has been given to thaw ponds and lakes after recognizing the cumulative effect of their high abundance and greenhouse gas (GHG) emissions on global warming (Kling et al., 1992; Walter et al., 2006; Laurion et al., 2010), especially when they emit old carbon thus having the potential to act as a positive feedback mechanism on climate (Walter Anthony et al., 2014). Thaw ponds and lakes are dominant in continuous and discontinuous permafrost areas, for example in permafrost regions of Siberia where they represent 90 % of all lakes (Walter et al., 2006), but until recently little has been known on the limnological properties and microbial communities of this important freshwater ecosystem (Vonk et al., 2015). Subarctic thaw ponds can be highly turbid and have relatively high nutrient concentrations (Breton et al., 2009; Rautio et al., 2011) compared to most high-latitude freshwater ecosystems (Pienitz et al., 1997; Hamilton et al., 2001; Medeiros et al., 2012). Moreover, high perimeter / volume ratio, the presence of palsas and bogs and the thawing of organic-rich permafrost in their watershed favor high inputs of dissolved organic matter (DOM) to the ponds. Chromophoric DOM (CDOM) can influence water column tem-
Published by Copernicus Publications on behalf of the European Geosciences Union.
7224
T. Roiha et al.: Carbon dynamics in highly heterotrophic subarctic thaw ponds
perature regimes through its absorption of sunlight (Caplanne and Laurion, 2008), and with suspended particles, they contribute to form a distinct and stabile thermocline (Laurion et al., 2010). The rate of DOM input to aquatic systems has been documented to increase in boreal lakes over the last decades (Hudson et al., 2003), and while no such information is yet available for thaw ponds, the recent mobilization of terrestrial carbon stocks stored for thousands of years in the permafrost (Vonk et al., 2012) suggests a similar DOM increase is taking place also in the north. High DOM concentration also strongly regulates the depth of the euphotic zone. Light is usually limited to the first meter in thaw ponds (Squire and Lesack, 2003; Watanabe et al., 2011), therefore restricting the water volume where photosynthesis can occur. This type of environment favors heterotrophic bacterial production (BP) that was shown to reach similar rates as in eutrophic lakes (Breton et al., 2009). The limnological characteristics of thaw ponds are likely also beneficial to mixotrophic algae and heterotrophic protozoans, as flagellated species are generally well adapted when lakes are rich in humic compounds (Jones, 2000). In low light conditions they can utilize bacteria as an energy source, and as they are motile they also benefit from the nutrient-rich bottom waters (Arvola et al., 1991). They have been shown to be a key link in the carbon transfer from low to high trophic levels in small boreal forest lakes (Salonen and Rosenberg, 2000). Circumpolar thaw ponds are ice covered for a large fraction of the year, which further affects carbon cycling and generates large seasonal variations. The aim of this study was to demonstrate the difference in GHG accumulation, CDOM characteristics, and autotrophic and heterotrophic carbon pools between two seasons and depths. Comparisons were made between late winter and summer, and between surface and bottom waters in summer. We hypothesized that in the absence of light in winter or in the aphotic summer hypolimnion, autotrophic productivity stops while respiration continues, resulting in large summer and winter storage of GHG in the water column. We further hypothesized that the thermal structure in summer generates an accumulation of organic carbon in the hypolimnion where heterotrophy dominates. This study follows earlier ones looking at the limnological characteristics and bacterial communities of subarctic thaw ponds in summer (Breton et al., 2009; Negandhi et al., 2013; Rossi et al., 2013; Crevecoeur et al., 2015).
2 2.1
Methods
to name the ponds hereafter) where a large number of thaw ponds can be found. At this site, ponds are thermokarstic and form over an impermeable clay–silt bed, on the center of thawed lithalsas (or inorganic palsas), preventing most hydrological interactions among ponds. They are surrounded by dense shrubs and sparse trees, and occasional areas of mosses and aquatic plants. More details on the study area are provided in Bouchard et al. (2011, 2014). Five ponds were studied during late winter (6–11 April) and summer (8–14 August) in 2009. They are all small (averaged diameter 17 ± 1.3 m) and shallow (average depth 2.5 ± 0.4 m). Sampling was done with a Kemmerer water sampler (Wildco® USA) through a borehole drilled into the ice in winter, and from an inflatable boat in summer at the middle of the pond. During winter sampling, the water started pouring over the ice through the hole because of the pressure from the weight of snow and ice, and possibly resulting in a mixing of surface with deeper water. This was suggested as the factor explaining the similar GHG concentrations obtained in surface (just under the ice) and bottom waters (approximately 0.5 m above the sediments), despite the expected inverse thermal stratification at this period of the year (Laurion et al., 2010). All other samples were collected from about 1 m below the ice and considered representative of an integrated water column. In summer, surface and bottom waters were sampled from just below the surface and approximately 0.5 m above the bottom sediments. Measurements of temperature, dissolved oxygen, pH and conductivity were done with a 600R YSI multiparametric probe (Yellow Springs Inc.). Further analyses were performed on water prefiltered through a 50 µm sieve. Total suspended solids (TSS) were obtained by filtering 500–1000 mL of water onto precombusted and preweighted GF/F filters (Advantec MFS Inc.). The 50 µm prefiltration reduced the TSS by an average of 5.8 % in comparison to bulk water samples, both analyzed in summer (data not shown). Filters were stored at −20 ◦ C until they were dried for 24 h at 60 ◦ C, and weighted to obtain sestonic dry weight or TSS. They were subsequently combusted at 450 ◦ C for 2 h to calculate the organic fraction of TSS. An aliquot of water was filtered through a pre-rinsed cellulose acetate filter (0.2 µm pore size; Advantec MFS Inc.) to analyze soluble reactive phosphorus (SRP; unpreserved samples) and dissolved iron (Fe; samples preserved with HNO3 at 0.15 % final concentration). Total phosphorus (TP) and total nitrogen (TN) were analyzed from unfiltered water preserved with H2 SO4 (final concentration of 0.15 %). All nutrient samples were stored in acid-washed glass bottles in a dark and cold (4 ◦ C) room until further analysis as in Breton et al. (2009).
Sample collection and limnological analyses 2.2
The study was carried out in the discontinuous permafrost region near the village of Whapmagoostui-Kuujjuarapik (55◦ 200 N, 77◦ 300 W), northern Quebec, Canada, along the River Kwakwatanikapistikw (local Cree name; KWK is used Biogeosciences, 12, 7223–7237, 2015
Carbon characterization
Dissolved CO2 and CH4 were determined as in Laurion et al. (2010). In brief, 2 L of pond water was equilibrated into 20 mL of ambient air for 3 min, with the headspace sampled www.biogeosciences.net/12/7223/2015/
T. Roiha et al.: Carbon dynamics in highly heterotrophic subarctic thaw ponds in duplicated glass vials (Vacutainers© ) previously flushed with helium and vacuumed. Gas samples were analyzed by gas chromatography (Varian 3800), and dissolved gas concentrations were calculated according to Henry’s law. The water filtered through pre-rinsed cellulose acetate filters as above was also used to analyze dissolved organic carbon concentration (DOC), and for optical analyses of CDOM. Samples were stored in amber glass bottles in a dark and cold (4 ◦ C) room until the analysis. DOC was quantified using a carbon analyzer (Shimadzu TOC-5000A) calibrated with potassium biphthalate. The absorbance was measured from 200 to 800 nm with a spectrophotometer (Varian Cary 300), using 1 cm quartz cuvettes on dual-beam mode, at 1 nm intervals for winter samples, and 4 nm intervals for summer samples. Null-point adjustment was performed using the mean value from 750 to 800 nm, and the absorption coefficients (aλ ) were calculated from absorbance measurements (Aλ ) at 254 and 320 nm using aλ = 2.303 Aλ /L, where L is the length of the cuvette in meters (Mitchell et al., 2002). The absorption coefficient at 320 nm (a320 ) was used as an index of CDOM concentration. Specific UV-absorbance index (SUVA254 ) was determined from DOC normalized A254 , and used as an index of aromaticity (Weishaar et al., 2003). CDOM absorption spectra were further analyzed to calculate the spectral slopes Sλ (Loiselle et al., 2009) between 250 and 450 nm (Galgani et al., 2011). Slopes were calculated over 20 nm intervals with a 1 nm step (i.e., 250–269, 251–270, etc.) for winter samples, and 4 nm steps for summer samples (i.e., 250–269, 254–273, etc.). The resulting set of spectral slopes was plotted by center wavelengths. Calculations were performed in open-source software package SciLab 4.15. The individual spectral slope S289 was used to evaluate the amount of fulvic and humic acids likely related to the autochthonous production (Loiselle et al., 2009). Algal-derived carbon has a maximum slope at 289 nm, while terrestrial carbon spectral slopes lack this peak and present a spectrally variable distribution with a steady increase from 260 to 390 nm. 2.3
Microbial abundance and productivity
For the determination of chlorophyll a (Chl a) concentrations, 1–2 L of 50 µm sieved pond water was filtered onto GF/F filters. Samples were collected in duplicates and stored at −80 ◦ C until pigment extraction, and fluorometric analysis were done in hot ethanol according to Nush (1980). Water samples for the enumeration of nanoflagellates (PNFs: phototrophic and mixotrophic cells; HNFs: heterotrophic cells) and phototrophic picoplankton (PPA) were preserved with 0.2 µm filtered glutaraldehyde solution at a final concentration of 1 %. Three replicate aliquots (3– 5 mL) were filtered through 0.6 µm black polycarbonate filters (Nuclepore). Samples were stained with 4-,6-diamido2-phenylindole (DAPI), mounted to slides and stored at −20 ◦ C until counting under UV excitation with an epifluowww.biogeosciences.net/12/7223/2015/
7225
rescence microscope (Zeiss Axiovert 200) at 1000× magnification. Discrimination between pigmented and heterotrophic nanoflagellates was done with green excitation light. At least 50 cells or a maximum of 30 fields were counted from each sample. Nanoflagellate cells were further divided into three size categories: < 5, 5–10 and > 10 µm. Volumes were converted to carbon biomass using the carbon content coefficient of 0.19 pg C µm−3 for PNFs and HNFs (Putt and Stoecker, 1989). Phototrophic picoplankton carbon content was calculated using the carbon conversion equation (pg C = 0.433 × V0.866 , where V is in µm3 ) for picoeukaryotic cells (Verity et al., 1992; Campbell et al., 1994). Bacterial abundance (BA) was measured with a flow cytometer (FACSCalibur, Becton-Dickinson) as in Rossi et al. (2013) before and after sonication to obtain estimations of free-living and particle-attached bacterial abundance. Biomass calculation for bacterioplankton was based on biovolumes measured from digital images acquired from DAPI-stained microscope slides using the Cell C program (Selinummi et al., 2005). Average bacterial carbon content was first estimated with allometric conversion formula recommended for DAPI-stained cells (fgC = 218 × V0.86 , where V is in µm3 ; Posch et al., 2001). The average cellular carbon content (18.1 fg C cell−1 ) was then multiplied by the bacterial abundance. Bacterial production was measured from unfiltered and filtered (3 µm) water samples using tritiated leucine (3 Hleucine) incorporation with centrifugation (Smith and Azam, 1992). A solution of 3 H-leucine (specific activity of 164 Ci mmol−1 ) was added to each vial to obtain a final leucine concentration of 30 nM, at which bacteria were saturated (experimentally tested). During the winter, the samples were incubated at ∼ 0 ◦ C in the dark for 2 h. During the summer, samples were incubated at in situ temperatures (5–18 ◦ C), depending on ponds. BP was stopped by adding trichloroacetic acid (5 % final concentration), and samples were then stored at −20 ◦ C before the centrifugation step. Winter samples were radioassayed with a Perkin Elmer TriCarb 2800, and summer samples with a Beckman LS 6500. Leucine incorporation was converted to carbon biomass using coefficients from Simon and Azam (1989). Bacterial respiration (BR) was estimated from BP according to Del Giorgio and Cole (1998) BR model II. Primary production (PP) was measured from the mixed water column during winter and from the surface in summer. An incubation system generating a gradient of photosynthetically active radiation (PAR), introduced by Rae and Vincent (1998), was used to obtain photosynthesis versus irradiance curves from complete darkness to full sunlight (Emax ). The value for Emax was calculated from in situ PAR measurements available from a weather station located in Whapmagoostui-Kuujjuarapik, and assuming the air–water surface in these humic waters to cause a 50 % decrease in radiation levels (Doxaran et al., 2004). A water volume of 20 mL was inoculated with a working solution Biogeosciences, 12, 7223–7237, 2015
7226
T. Roiha et al.: Carbon dynamics in highly heterotrophic subarctic thaw ponds
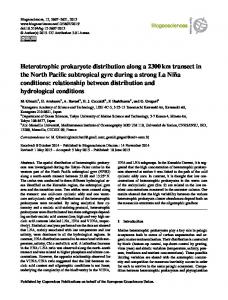
Figure 1. Summer temperature and oxygen profiles from sampled ponds.
of [14 C]–HCO3 (80 µCi mL−1 ) to a final concentration of 0.2 µCi mL−1 . In winter, the incubations were done outside (∼ 0 ◦ C) under natural light conditions in a water bath for 45–60 min, while in summer a circulating water bath was used to keep samples at in situ temperature (14–18 ◦ C) and incubations were run for 120 min. The incubations were terminated by filtrating samples onto GF/F filters, the method only capturing 14 C fixed in particulate organic matter and not the carbon allocated to exudates. The filters were subsequently frozen before they were radioassayed with a Perkin Elmer Tri-Carb 2800 liquid scintillation counter. Chl a normalized carbon fixation rates were fitted to the equation of Platt et al. (1980) or Jassby and Platt (1976) depending on the presence or absence of photoinhibition, respectively. Data fit to the equations had on average a r 2 value of 0.92, and always higher than 0.81. The iterative non-linear regression of SigmaPlot 11.0 was used to obtain the maximum photosynthetic rate (Pmax ). PP at the pond bottom was estimated from the photosynthesis-irradiance curves and PAR estimated from in situ surface measurements, and diffuse attenuation coefficients were calculated from a linear regression using TSS and DOC (Watanabe et al., 2011). Without light under the ice and snow cover (measured with a LiCor Li-192 submersible PAR quantum sensor), PP was established at zero.
2.4
Data analysis
Differences in environmental and microbial variables among waters were tested using a one-way ANOVA (fixed factor; JMP software, version 11.0.0, SAS Institute Inc. 2013). Conductivity, BP, PPA, SRP, and PNF biomass were logtransformed, while TP, TN, and BB were square-root transformed to achieve normality and homogeneity of variance in residuals (visually checked with predicted values). When differences were detected, a Tukey HSD multiple comparison test was performed. Environmental variables are illustrated with a principal component analysis (PCA; PAST version 2.17c), where biological variables were entered as vectors which length and direction were determined by Spearman’s correlation analysis between biological variables and PCA axis 1 and 2. Correlations between organisms (abundance, biomass and productivity measurements) and environmental variables were tested with non-parametric Spearman’s rank correlation coefficient analysis (IBM SPSS statistic 20.0). A significant level of α = 0.05 was used for all statistical tests. 3 3.1
Results Physicochemical properties of thaw ponds
In late winter, the ponds were covered with 50 to 70 cm of snow and approximately 30 to 60 cm of ice, which absorbed all light. Water temperature was 2.0 ◦ C under the ice, Biogeosciences, 12, 7223–7237, 2015
www.biogeosciences.net/12/7223/2015/
T. Roiha et al.: Carbon dynamics in highly heterotrophic subarctic thaw ponds
7227
Table 1. Limnological properties of the subarctic ponds sampled in late winter and during summer at the surface and bottom of the water column, including pH, conductivity (Cond.), total phosphorus (TP), total nitrogen (TN), soluble reactive phosphorus (SRP), total suspended solids (TSS), particulate organic carbon (POC) and dissolved iron (Fe). Site Winter KWK 2 KWK 6 KWK 12 KWK 20 KWK 23 Summer surface KWK 2 KWK 6 KWK 12 KWK 20 KWK 23 Summer bottom KWK 2 KWK 6 KWK 12 KWK 20 KWK 23
pH
Cond. (µS cm−1 )
TP (µg L−1 )
TN (µg L−1 )
SRP (µg L−1 )
TSS (mg L−1 )
POC (mg L−1 )
Fe (mg L−1 )
6.6 6.8 6.6 6.7 6.4
60 49 46 52 42
61.9 50.6 73.2 180.7 119.3
957.4 687.8 1038.4 1301.6 802.7
20.8 7.7 18.4 47.1 33.9
2.7 3.7 4.1 53.9 23.5
0.8 1.1 1.2 16.6 6.8
na na na na na
7.4 6.9 7.3 7.5 7.1
38 61 36 47 48
34.9 43.9 23.9 92.6 78.0
289.3 227.9 311.9 263.4 227.9
1.2 0.9 0.7 7.1 5.7
3.4 7.2 2.6 14.2 16.1
0.9 2.3 0.9 1.8 2.1
0.3 0.2 0.3 0.5 0.4
6.2 6.2 6.1 6.0 6.2
200 265 247 155 102
341.5 197.7 207.1 377.0 431.8
496.1 389.4 447.6 289.3 266.7
1.5 na 1.0 73.8 45.7
27.7 13.6 37.0 85.8 126.8
4.4 2.3 8.8 5.7 7.8
2.5 1.1 2.9 5.1 4.1
and the ponds were likely O2 depleted at the bottom because of the smell of hydrogen sulfide, while O2 concentration was 4.5 ± 3.5 mg L−1 in the integrated water column sample. In summer, despite their shallow depth, ponds are strongly stratified with nearly 10 ◦ C difference in temperature and 10 mg L−1 difference in O2 between surface and bottom (Fig. 1). Some ponds (KWK 2, 6 and 20) had a thermally homogenous epilimnion until 1 to 1.5 m depth, while in KWK 12 and 23 the temperature declined nearly linearly towards the bottom with a rate of 1–2 ◦ C every 50 cm. The pH varied between 6.0 and 7.5, with lowest and highest values respectively measured in summer bottom and surface waters. There was no difference (p = 0.9034) in conductivity between winter (50 ± 7 µS cm−1 ) and summer at the surface (46 ± 10 µS cm−1 ), but bottom waters had significantly (p < 0.009) higher conductivity (194 ± 67 µS cm−1 ) than winter and summer surface waters. Nutrients were relatively high in all samples. TN concentrations were elevated in winter (958 ± 235 µg N L−1 ) compared to the summer values (264 ± 118 µg N L−1 ; p = 0.0001). TP was relatively high in winter (97 ± 43 µg P L−1 ), and in summer the concentrations were clearly lower at the surface (55 ± 29 µg P L−1 ) than at the bottom (3110 ± 1043 µg P L−1 ; p = 0.0001). SRP was available during the whole year, with higher concentrations in late winter (26 ± 15 µg P L−1 ) and summer bottom waters (31 ± 36 µg P L−1 ) than in summer surface where concentrations were relatively low (3.1 ± 3.0 µg P L−1 ) but not statistically different from the other values (p = 0.064). All ponds had higher TSS in bottom waters (85 ± 43 mg L−1 ),
www.biogeosciences.net/12/7223/2015/
while in winter and summer surface waters the concentrations were generally an order of magnitude lower. In most ponds, organic fraction of TSS followed the same trend as TSS and made on average 24 % of TSS. Fe was lower at the surface (0.3 ± 0.1 mg L−1 ) than at the bottom of ponds (3.1 ± 1.6 mg L−1 ) in summer. No Fe measurements were done during late winter. Limnological properties of the ponds are summarized in Table 1. 3.2
Carbon characterization
CO2 and CH4 concentrations were high in winter (up to 357 and 14.1 µM respectively), and particularly high at the pond bottom in summer (up to 815 and 312 respectively; Table 2). Surface waters, in contact with the atmosphere, had 1 order of magnitude lower concentrations, but values remained supersaturated. The inverse relationship (r = −0.9228; p < 0.0001) between O2 and CO2 suggests that the CO2 originated from O2 respiration and not from external sources such as weathering, runoff and groundwater inputs that are unlikely in the studied ponds. DOC ranged from 4.1 to 10.5 mg L−1 , with the highest concentrations obtained in winter. Despite the higher DOC observed in winter, CDOM was lowest at this period, as indicated by a320 values (7.1 ± 2.5 m−1 compared to 27 ± 10 and 70 ± 37 m−1 at the surface and bottom in summer, respectively). SUVA254 followed the same trend as a320 , with lower values in winter (0.8 ± 0.2 L mg C−1 m−1 ) compared to summer surface (4.8 ± 1.0 L mg C−1 m−1 ) and bottom waters (7.7 ± 2.4 L mg C−1 m−1 ), indicating the presBiogeosciences, 12, 7223–7237, 2015
7228
T. Roiha et al.: Carbon dynamics in highly heterotrophic subarctic thaw ponds
Figure 2. Absorption spectral slope curve (Sλ ) of dissolved organic matter as an indicator of the presence of algal-derived carbon (peak at S289 ) and terrestrial carbon (steady increase in the slopes from 260 to 390 nm).
ence of more aromatic compounds, and possibly DOMFe complexes in summer. The shape of absorption spectral slopes showed a clear maximum at 382 nm, indicating the presence of terrestrial fulvic and humic acids. Consistent with the SUVA254 index, S382 values were relatively low in winter (0.0137 ± 0.0016 nm−1 ), with similar values in summer surface waters (0.0158 ± 0.0014 mg nm−1 ), but they show significant difference with bottom waters (0.0169 ± 0.0007 nm−1 ; p = 0.0061). The individual spectral slope S289 indicates that higher amounts of algalderived carbon were present in summer surface waters (0.0148 ± 0.0009 nm−1 ), especially in the most transparent pond KWK6 (0.0162 nm−1 ), while their role was limited in the dark habitats under the ice (0.0113 ± 0.0011 nm−1 ) and in bottom waters (0.0112 ± 0.0007 nm−1 ). Carbon quantity and CDOM quality properties are summarized in Table 2, and the seasonal differences in absorption spectral slopes are shown in Fig. 2. 3.3
Microbial abundance and productivity
The abundance of all organisms examined was highest in the summer bottom waters, but the magnitude and seasonal distribution differed among taxa and ponds (Table 3). Especially, the abundant motile PNFs accumulated in the nutrientrich bottom waters, where their abundance was in most ponds an order of magnitude higher than at the surface (110 ± 89 vs. 27 ± 8 × 10⁶ L−1 ). The less abundant HNFs also favored the bottom waters, with an order of magnitude difBiogeosciences, 12, 7223–7237, 2015
ference in the abundance between bottom and surface waters (9.2 ± 11.6 vs. 0.8 ± 0.7 × 10⁶ L−1 ). The smaller phototrophic picoplankton (PPA) and bacteria were more uniformly distributed, although the abundances were significantly higher (p < 0.05) at the bottom. Abundance was also quantified for free-living and particle-attached bacteria. During late winter, 74 ± 9 % of bacterioplankton was attached to particles, and 46 ± 21 and 70 ± 17 % in summer surface and bottom waters (Table A1 in the Appendix). When converted to biomass, the seasonal and vertical distribution pattern was even more accentuated (Table 3, Fig. 3). Overall, lower biomasses were encountered in winter, and higher at the bottom of the water column in summer. Total phototrophic biomass as Chl a concentration (5.6 ± 2.5 µg L−1 ), as well as the PNF biomass (152 ± 68 µg C L−1 ) under the ice, was relatively high. Summer surface phototrophic biomass was similar to winter waters (p = 0.1213), and it was different (p < 0.05) and highest in the dark bottom waters, likely reflecting cell sedimentation. The biomass of strictly phototrophic PPA was very low in winter (5.8 ± 4.4 µg C L−1 ) and an order of magnitude higher in summer. The bacterial biomass was always high when compared to literature, with the lowest biomass occurring in winter (109 ± 67 µg C L−1 ), 2 times higher biomass in summer at the surface (223 ± 36 µg C L1 ), and 5 times higher at the bottom (520 ± 146 µg C L−1 ). The HNFs contributed little to the total microbial biomass, especially in the illuminated summer surface waters where they averaged 3.2 ± 2.9 µg C L−1 . Their biomass was higher
www.biogeosciences.net/12/7223/2015/
T. Roiha et al.: Carbon dynamics in highly heterotrophic subarctic thaw ponds
7229
Table 2. Concentrations of carbon dioxide (CO2 ), methane (CH4 ), and dissolved organic carbon (DOC), and dissolved organic matter (DOM) optical properties, including absorption coefficient of DOM at 320 nm (a320 ), specific UV-absorbance index (SUVA254 ), and absorption spectral slopes at 289 nm (S289 ) and 382 nm (S382 ), of subarctic pond water sampled in late winter and during summer at the surface and bottom of the water column. Site Winter KWK 2 KWK 6 KWK 12 KWK 20 KWK 23 Summer surface KWK 2 KWK 6 KWK 12 KWK 20 KWK 23 Summer bottom KWK 2 KWK 6 KWK 12 KWK 20 KWK 23
CO2 (µM)
CH4 (µM)
DOC (mg L−1 )
a320 (m−1 )
SUVA254 (L mg C−1 m−1 )
S289 (nm−1 )
S382 (nm−1 )
316 354 215 na 357
14.1 5.1 2.4 na 2.5
7.7 5.2 10.5 10.3 7.9
8.5 3.0 9.5 8.1 6.6
0.9 0.5 0.8 0.8 0.8
0.0099 0.0112 0.0105 0.0125 0.0124
0.0155 0.0122 0.0154 0.0130 0.0123
72 27 55 71 53
0.6 0.5 0.3 0.3 0.3
5.6 4.1 6.0 7.1 6.3
26.4 11.8 26.5 38.9 30.7
4.7 3.4 4.5 6.1 5.4
0.0141 0.0162 0.0142 0.0145 0.0150
0.0169 0.0135 0.0170 0.0156 0.0161
na 422 761 815 570
na 145.2 259.0 311.9 131.6
6.1 4.2 7.4 9.3 7.5
51.5 21.4 67.9 115.6 94.5
6.7 4.3 7.4 9.8 10.2
0.0109 0.0125 0.0111 0.0107 0.0109
0.0156 0.0173 0.0173 0.0172 0.0171
Table 3. Phototrophic and heterotrophic properties of subarctic pond water sampled in late winter and during summer at the surface and bottom of the water column, including chlorophyll a concentration (Chl a), maximum photosynthesis parameter (Pmax ), in situ primary production (PP), pigmented nanoflagellate abundance (PNF), phototrophic picoplankton abundance (PPA), bacterial production (BP), bacterial respiration (BR), bacterial abundance (BA) and heterotrophic nanoflagellate abundance (HNF). Site Winter KWK 2 KWK 6 KWK 12 KWK 20 KWK 23 Summer surface KWK 2 KWK 6 KWK 12 KWK 20 KWK 23 Summer bottom KWK 2 KWK 6 KWK 12 KWK 20 KWK 23
Chl a (µg L−1 )
Pmax (mg C m−3 d−1 )
PP (mg C m−3 d−1 )
PNF (×106 L−1 )
PPA (×105 mL−1 )
BP (mg C m−3 d−1 )
BR (mg C m−3 d−1 )
BA (×106 mL−1 )
HNF (×106 L−1 )
2.8 9.9 11.5 2.8 0.8
1.2 0.8 5.8 0.8 1.5
0 0 0 0 0
33.0 51.0 29.1 6.3 10.0
0.2 0.9 0.7 0.2 0.1
0.2 0.5 0.3 0.8 0.4
1.3 2.2 1.6 3.0 2.0
4.2 11.2 2.5 8.7a 3.7
2.0 3.3 2.4 2.4 0.3
5.4 13.4 2.2 14.3 12.3
4.5 27.9 5.9 59.0 55.6
2.6 15.3 3.2 26.4 15.6
16.3 20.0 28.8 33.1 35.0
3.3 4.2 0.9 17.3 3.8
27.2 37.4 31.2 15.2 45.9
25.7 31.2 27.9 18.0 35.3
13.3 11.3 9.6 14.8 12.7
0.0 0.8 0.7 1.9 0.4
180.2 87.2 158.9 203.4 37.1
na na na na na
0.8 4.2 0.3 0.3 0.0
149.6 201.6 72.5 na 4.5
9.4 3.0 26.8 4.0 6.2
57.6 39.0 48.8 39.1 23.0
40.5 32.0 36.6 32.0 23.2
35.7 14.3 38.0 27.2 24.3
26.2 6.3 3.7 na 0.6
a BA was calculated from DAPI-stained microscope slide.
at the bottom (39.2 ± 49.4 µg C L−1 ) and in winter samples (8.9 ± 4.7 µg C L−1 ). Snow and ice cover prevented light penetration under the ice, and therefore we assumed that no PP occurred in situ in late winter. However, the photosynthetic capacity of late winter phytoplankton community was not null, and represents the potential at the ice-out, which took place 2–3
www.biogeosciences.net/12/7223/2015/
weeks later. The maximum photosynthetic rate (Pmax ) of late winter phytoplankton community was for most ponds an order of magnitude lower than Pmax of the summer community (2.0 ± 2.1 vs. 30.6 ± 26.1 mg C m−3 d−1 ). BP rates were very low in winter (0.4 ± 0.2 mg C m−3 d−1 ) and different (p = 0.0001) compared to the summer surface (31 ± 14 mg C m−3 d−1 ) and bottom
Biogeosciences, 12, 7223–7237, 2015
7230
T. Roiha et al.: Carbon dynamics in highly heterotrophic subarctic thaw ponds duction, while the colder and darker bottom waters accumulated nutrients, carbon compounds and microorganisms. The overall supersaturation in GHG and the clear dominance of heterotrophy over phototrophy, as expressed in the biomass and activity of the microbial food web components, indicate that the majority of the energy was flowing through the heterotrophic food web. 4.1
Figure 3. Seasonal changes in the biomass of phototrophic picoplankton (PPA), pigmented nanoflagellates (PNFs), bacteria (BB), and heterotrophic nanoflagellates (HNFs). Error bars represent standard errors.
(42 ± 19 mg C m−3 d−1 ) BP rates. BR rates calculated from BP were low in winter (2.0 ± 0.6 mg C m−3 d−1 ) and equally high during summer in surface (28 ± 6 mg C m−3 d−1 ) and in bottom (33 ± 6 mg C m−3 d−1 ). Particle-attached bacterioplankton played an important role in pond production at both sampling seasons (late winter: 42 ± 20 %; summer surface: 66 ± 20 %; bottom: 68 ± 44 %; Table A1). Winter, surface and bottom environmental characteristics formed three distinct groups on the PCA (Fig. 4a), with the first two axes explaining 72.9 % of the variation in the environmental variables (PC1 46.0 and PC2 26.9 %). Axis PC1 has strong positive correlations with TP (r = 0.91), a320 (r = 0.80), TSS (r = 0.83) and GHG (CO2 r = 0.92 and CH4 r = 0.90), and strong negative correlations with pH (r = −0.81) and S289 (r = −0.65), whereas PC2 has positive correlation with temperature (r = 0.81), S382 (r = 0.69) and SUVA254 (r = 0.76), and negative correlation with TN (r = −0.93) and DOC (r = −0.67). Heterotrophs (BBs and HNFs) were correlated with PC1 while phototrophs (PP, PNF and PPA) were more strongly correlated with PC2 (Fig. 4b). Further, BP and BB were best correlated with carbon quality indices a320 , SUVA254 , and S289 , while HNFs were best correlated with conductivity (Table 4). PP, PNF and PPA were best correlated with a combination of carbon quality indices, DOC and nutrients (Table 4).
4
Discussion
The large variations in physicochemical characteristics of thaw ponds between late winter and summer and between surface and bottom waters were reflected in their ecological properties. The cold and nutrient-rich winter waters had the lowest microbial abundance and productivity. The warm and illuminated summer surface waters favored primary proBiogeosciences, 12, 7223–7237, 2015
Spatial and seasonal variations in GHG
Greenhouse gas storage in pond waters occurred in winter under the ice cover and in summer under the steep thermocline, due to the isolation of these water masses from atmospheric venting. Partial pressures measured were especially large in summer hypolimnetic waters (in average 13 674 µatm of CO2 and 4783 µatm of CH4 ) compared to values at the surface (in average 1206 µatm of CO2 and 9 µatm of CH4 ). Such heterogeneity in the vertical distribution of GHG is typical for seasonally stratified lakes where bottom values are often many folds higher than at the surface (Eller et al., 2005; Guérin et al., 2006; Bastviken et al., 2008). Partial pressures of CO2 at the surface of thaw ponds (598– 1545 µatm) were comparable to values obtained in other regions, for example in European boreal lakes (990 µatm; Kortelainen et al., 2006), Canadian boreal streams and rivers (1850 µatm; Teodoru et al., 2009), western Siberian lakes and ponds (1935 µatm; Shirokova et al., 2013), and Canadian subarctic and arctic ponds (1896 µatm; Breton et al., 2009). Surface water CH4 partial pressures (6–13 µatm) were also in the same range as values reported in lakes and ponds from North America (11–59 µatm; Bastviken et al., 2008), Finland (23 µatm; Juutinen et al., 2009), Canadian subarctic and arctic (22 µatm; Breton et al., 2009), and western Siberia (30 µatm; Shirokova et al., 2012). The dominance of BR over PP, combined with the isolation of water masses during the long winter, followed by a very short spring mixing period (Laurion et al., 2010) and the steep summer stratification of these ecosystems controlled the accumulation of GHG in the hypolimnion. When normalized by the duration of the known isolation period (Laurion et al., 2010), GHG accumulated more rapidly in summer at the pond bottom (6.8 ± 2.2 µM CO2 d−1 and 1.9 ± 0.9 µMCH4 d−1 ) than in winter under the ice cover (1.5 ± 0.3 µM CO2 d−1 and 0.030 ± 0.027 µM CH4 d−1 ), assuming a constant accumulation rate during the two sampling periods and ignoring freezing exclusion effects. This may be partly due to the more abundant microbial community in summer, although most GHG produced likely came from benthic respiration, especially in such shallow systems (Kortelainen et al., 2006). Summer also provides fresh organic matter that may stimulate GHG producers that indeed presented higher respiration rates. The smaller CH4 accumulation rates in winter might also result from more optimal conditions for methanotrophy under the ice cover where bubbling CH4 is trapped and dissolves in water. The amount www.biogeosciences.net/12/7223/2015/
T. Roiha et al.: Carbon dynamics in highly heterotrophic subarctic thaw ponds
7231
Figure 4. (a) Seasonality in pond environmental variables illustrated with principal component analysis during late winter (triangles), summer surface (diamonds) and summer bottom (crosses). (b) Spearman correlation coefficients between biological variables and principal components 1 (x axis) and 2 (y axis). BP – bacterial production, BB – bacterial biomass, HNF – heterotrophic nanoflagellate biomass, PP – primary production, PNF – pigmented nanoflagellate biomass, and PPA – phototrophic picoplankton biomass.
of CH4 in a lake was shown to depend on the size of the anoxic layer (Fendinger et al., 1992; Bastviken et al., 2004), and in the present study this layer represents a particularly large proportion of the water volume in summer. During the autumnal turnover period (lasting about 2 months), the whole water column becomes oxygenated, and in the first part of the winter surface layer of the pond may contain sufficient oxygen (Deshpande et al., 2015) for efficient CH4 consumption. Anoxic methanotrophy has also been reported (Sivan et al., 2011) and may occur at our study sites. Nevertheless, these GHG storage periods indicate that subarctic thaw ponds will release large amounts of CH4 during the autumnal mixing period, and also during spring turnover if it lasts long enough (Walter et al., 2006; Laurion et al., 2010). 4.2
Seasonality in CDOM properties
We used a320 as an indicator of the quantity of CDOM, and SUVA254 , S289 and S382 as indicators of the aromatic content of CDOM and the relative proportions in allochthonous (terrestrial) versus autochthonous (algal) carbon sources. The high a320 and SUVA254 values indicate a large contribution by terrestrial humic substances in DOM at the surface of thaw ponds in summer, with values similar to a few years earlier in the same ponds (Breton et al., 2009; Watanabe et al., 2011). CDOM values were clearly smaller in winter (late winter a320 ; Table 2) and less aromatic (SUVA254 ) than in summer, suggesting that carbohydrates or protein-like compounds from bacteria-induced CDOM-degradation made up a larger fraction of DOM in winter. Laurion et al. (unpublished data) tested the role of bacterial CDOM degradation in arctic thaw ponds and found that its importance can almost match that of photodegradation in certain cases, withwww.biogeosciences.net/12/7223/2015/
out significant losses in DOC, potentially indicating a bacterial transformation into less colored compounds. The higher DOC values observed in winter (average of 8.3 mg L−1 ) compared to summer at the surface (5.8 mg L−1 in) thus likely resulted from a combination of a generation of dissolved compounds from the slower but uninterrupted microbial activity, and out-freezing inputs associated with the formation of ice. Although BP in late winter was low, the long subarctic winters allow accumulation effects that could lead to a decrease in CDOM. The labile part of DOC is known to be consumed within days by bacterioplankton, leaving the recalcitrant fraction of DOC to dominate in environments where fresh inputs are limited (Del Giorgio and Davis, 2002; Roehm et al., 2009; Guillemette and del Giorgio, 2011). However this is not clearly observed in the present study thaw ponds, where less aromatic and non-chromophoric fractions increased along winter, likely as the result of DOM recycling by a rich microbial food web, together with a lack of new carbon inputs from the frozen catchment. The high a320 and SUVA254 values found in bottom waters are very likely caused by the elevated dissolved iron concentrations (up to 5.1 mg L−1 ; r 2 = 0.947 between SUVA254 and Fe in summer samples, n = 10). High concentrations of iron (> 2 mg L−1 ) were shown to form complexes with humic substances and increase DOM absorbance (Maloney et al., 2005; Xiao et al., 2013). During the autumnal turnover, CDOM-Fe complexes from bottom waters are exposed to photochemical reactions at the surface, potentially generating hydroxyl radicals that dissociate carboxyl groups from humic substances. These reactions can lead to lower molecular weight carbon components at the same time as increasing the water clarity (Brinkmann et al., 2003). The spectral slope values indicate that algal-derived proteins (S289 ; GalBiogeosciences, 12, 7223–7237, 2015
7232
T. Roiha et al.: Carbon dynamics in highly heterotrophic subarctic thaw ponds
Table 4. Spearman correlations between biological and environmental variables. Only statistically significant correlations are given. Biological variable
Environmental variable
Bacteria production (BP)
n
r
p
Temperature TN a320 SUVA254 S382
15 15 15 15 15
0.600 −0.524 0.704 0.699 0.633
0.018 0.045 0.003 0.004 0.011
Bacteria biomass (BB)
O2 Conductivity TP TSS Fe CH4 a320 SUVA254 S382
15 15 15 15 10 13 15 15 15
0.555 0.668 0.600 0.521 0.879 0.588 0.825 0.857 0.716
0.049 0.007 0.018 0.046 0.001 0.035 < 0.001 < 0.001 0.003
HNF
Conductivity CH4
15 15
0.657 0.636
0.011 0.026
Primary production (PP)
Temperature SRP TN DOC SUVA254 S289
10 10 10 10 10 10
0.896 −0.662 −0.827 −0.610 0.533 0.732
< 0.001 0.007 < 0.001 0.016 0.041 0.002
PNF
SRP DOC
14 14
−0.732 −0.647
0.003 0.012
PPA
TN a320 SUVA254 S382
15 15 15 15
−0.665 0.825 0.717 0.564
0.007 < 0.001 0.003 0.029
gani et al., 2011) were more abundant in summer surface waters when primary production and Chl a were highest, and at the same time fulvic and humic acids (S382 ) also seemed more abundant than in winter. Algal proteins are generally highly available to heterotrophic organisms and were likely supporting the higher summer BP (Kritzberg et al., 2004). Nevertheless, Xiao et al. (2013) showed how high Fe concentrations, such as found in bottom waters, can significantly lower DOM absorption slopes; thus interpretations of bottom water Sλ should be done cautiously. 4.3
Thaw pond microbial food web
Primary production rates in summer at the surface of thaw ponds were in the same range as in other arctic and subarctic lakes (Lizotte, 2008), while in late winter snow and ice cover prevented in situ PP. However, when exposed to light, the production of carbon by the winter phytoplankton community was in the same range as the heterotrophic production, suggesting that the high phytoplankton biomass encountered during late winter was made of mixotrophic species that switched from hetero- to autotrophic producBiogeosciences, 12, 7223–7237, 2015
tion at ice-out. Similarly, the high Chl a and PNF biomass in the light-limited bottom waters in summer were most likely composed of mixotrophs. Many species of Chrysophyceae, Cryptophyceae and Dinophyceae are known to be 99 % mixotrophic (Olrik, 1998, and references therein). Chrysophyceae were dominating the phytoplankton community in KWK2 and KWK20 (Dupont, 2008, L. Forsström, unpublished data). Many Chrysophyceae species have flagella, and thus can thrive in sheltered humic ponds that have been shown to favor diurnal migrations of phytoplankton (Jones, 1991). This is especially advantageous in steeply stratified and shallow ponds where phytoplankton can migrate within a few hours (Arvola et al., 1991), and are able to use nutrientrich hypolimnetic waters (Salonen et al., 1984). The high nutrient concentrations in bottom waters likely reflect the high biomass of PNF observed in these waters. Anoxic bottom waters were also devoid of Daphnia sp. (M. Wauthy et al., unpublished data) providing to phytoplankton a refuge from grazing. Absence of light, hypoxia and low temperatures further prevent photo-oxidation of algal pigments, preserving them for extended periods (Vallentyne, 1960). Thus some of the Chl a and PNF encountered at the bottom may have been from dead yet still not degraded cells. Another factor that could have caused bias in very high bottom water Chl a values is the occurrence of chlorophyll b containing green-sulfur bacteria that are known to colonize the anoxic layer of the studied ponds (Rossi et al., 2013), and that may interfere with the spectrophotometric analyses of Chl a. However, green-sulfur bacteria were not found in all ponds with high values of Chl a. In winter, the lack of PP and allochthonous inputs of carbon, and a DOM pool composed by a large fraction of molecules with low aromaticity (low SUVA254 and S289 ) suggest that intensively recycled DOM formed the basal organic carbon pool in thaw ponds. BP and BB were strongly linked to CDOM originating from a terrestrial source (high SUVA254 and a320 ), indicating a positive link between bacterioplankton and terrestrial carbon (Tranvik, 1988; Crump et al., 2003). These results are in accordance with the experiment from Breton et al. (2009), which showed that bacterioplankton in thaw ponds was more carbon-limited than nutrient-limited (glucose was used as a labile carbon source). In contrast to several previous studies (Granéli et al., 2004; Säwström et al., 2007; Roiha et al., 2012), the amount of DOC did not seem to control the BP in our study. The studies that reported a positive correlation between DOC and BP were conducted in summer, when BP and DOC concentrations were highest, but without necessarily taking into account the variability in DOC type, which had a dominant role in our study. The presence of a mixture of autochthonous and allochthonous carbon may have helped in making the terrestrial carbon available to bacteria. Phytoplankton and macrophytes apparently produced significant amounts of dissolved carbon in surface waters during summer as indicated by the larger S289 peak. This carbon is considered more labile www.biogeosciences.net/12/7223/2015/
T. Roiha et al.: Carbon dynamics in highly heterotrophic subarctic thaw ponds (lower molecular weight) and with a higher nutritional value to heterotrophs (Kritzberg et al., 2004; Brett et al., 2009). The availability of high-quality phytoplankton carbon during summer possibly enhanced the bacterial use of more recalcitrant terrestrial carbon though the priming effect (Bianchi, 2011), which is a small supplement of nutritionally rich algal cells increasing bacterioplankton terrestrial carbon assimilation. Correlation between TSS and TP (r = 0.903 p < 0.001, n = 15) indicates that phosphorus was binding to particles, which may be more accessible to attached bacterioplankton than to phytoplankton in summer surface waters where SRP concentrations were low. The high proportion of particleattached bacterial abundance (62 ± 30 %) and productivity (59 ± 30 %) in thaw ponds suggests that particle attachment is beneficial. Although studies have shown that BP is often nutrient-limited (Kritzberg et al., 2004; Vrede, 2005), there were no correlation between BP and nutrients in thaw ponds. One possible additional explanation for the difference between winter and summer BP is the difference in temperature that is known to have a large impact on production (Adams et al., 2010). On the other hand, bacterial communities are known to adapt at low temperatures, and some communities can have multiple temperature maxima (Adams et al., 2010). In our study, the highest BP was found in relatively cool bottom waters. Moreover, bacteria biomass (BB) was not correlated with temperature, although several studies found temperature as a main driver of bacterial biomass (Ochs et al., 1995; Rae and Vincent, 1998). Trophic interactions certainly contributed to the observed patterns in microbial abundance. Rotifers are the dominant zooplankton group in the studied thaw ponds, while the cladoceran community is composed of a few Daphnia sp. observed only at the surface (Bégin, 2014). These two zooplankton groups were only found in summer, when they could exert a grazing pressure on bacteria and phytoplankton, but experiments would be needed to confirm the extent of grazing. We tentatively estimated the top-down control of nanoflagellates on bacteria, using the average nanoflagellate ingestion rate of 0.66 pg C cell−1 day−1 measured for Dinobryon sp. in Svalbard (Laybourn-Parry and Marshall, 2003). From these calculations, it seems that nanoflagellate grazing on bacteria could have been efficient enough in late winter when the grazing potential exceeded 100 % of the BP, while summer removal estimations corresponded to only 1.7 % at the surface and 9.3 % at the bottom of the BP, possibly contributing to explaining the accumulation of BB in summer.
www.biogeosciences.net/12/7223/2015/
5
7233
Conclusions
Low light intensity, strong stratification and high concentrations of CDOM in subarctic thaw ponds are the main drivers creating an environment highly beneficial to heterotrophs. We have also shown some important differences in their ecosystem dynamics between winter and summer. Although a high biomass of bacterioplankton is found under the ice, the ponds are producing relatively small amounts of carbon in late winter, possibly caused by the lack of fresh carbon inputs and its associated priming effect. Nevertheless, the ponds are accumulating GHG during winter. The relatively high phototrophic biomass and primary production potential encountered under the ice are at the same level as the heterotrophic biomass and production, indicating the importance of mixotrophy in winter. In summer, fresh primary production and terrestrial carbon inputs enhance the heterotrophic production. Although a higher phototrophic (mixotrophic) biomass is encountered in summer, primary production is restricted by light and space and is significant only at the pond surface; thus the heterotrophic carbon production remains significantly higher. Consequently, GHGs continue to accumulate in hypolimnetic waters during this strongly stratified summer period, and are most likely released during the autumnal turnover period, in addition to the constant emissions of GHGs throughout the summer from the highly supersaturated surface waters.
Biogeosciences, 12, 7223–7237, 2015
7234
T. Roiha et al.: Carbon dynamics in highly heterotrophic subarctic thaw ponds
Appendix A
Table A1. Particle attachment of bacterioplankton in winter, summer at the surface and bottom of ponds, including sonicated bacterial abundance (BAT ) representing the total abundance, bacterial abundance before sonication (BAFL ) representing free-living bacteria, proportion of particle-attached bacteria (BAP ), total bacterial production (BP; as in Table 3), filtered (3 µm) bacterial production (BPFL ) and proportion of particle attached bacterial production (BPP ). Site
BAT (×106 mL−1 )
BAFL (×106 mL−1 )
BAP (%)
4.2 11.2 2.5 na 3.7
0.8 3.2 0.5 na 1.4
13.3 11.3 9.6 14.8 12.7 35.7 14.3 38.0 27.2 24.3
Winter KWK 2 KWK 6 KWK 12 KWK 20 KWK 23 Summer surface KWK 2 KWK 6 KWK 12 KWK 20 KWK 23 Summer bottom KWK 2 KWK 6 KWK 12 KWK 20 KWK 23
Biogeosciences, 12, 7223–7237, 2015
BP (mg C m−3 d−1 )
BPFL (mg C m−3 d−1 )
BPP (%)
81 72 79 na 62
0.2 0.5 0.3 0.8 0.4
0.1 0.2 0.2 0.4 0.4
54 54 48 47 7
5.8 8.5 6.0 4.1 7.7
57 24 37 73 40
27.2 37.4 31.2 15.2 45.9
4.7 3.3 17.4 7.0 18.6
83 91 56 54 60
11.3 8.3 11.2 3.7 4.2
68 42 70 86 83
57.6 39.0 48.8 39.1 23.0
1.7 1.5 26.0 1.0 26.6
97 96 47 97 0
www.biogeosciences.net/12/7223/2015/
T. Roiha et al.: Carbon dynamics in highly heterotrophic subarctic thaw ponds Acknowledgements. We thank Academy of Finland (grants 119205 and 140775), the Societas Biologica Fennica Vanamo, Maaja Vesitekniikan Tuki Ry and the Natural Sciences and Engineering Research Council of Canada for their financial support, and Denis Sarrazin, Paul-Georges Rossi, Frédéric Bouchard, Annabelle Warren, Benoit Ginoux, Catherine Girard and Jonna Kuha for their assistance in the field and laboratory. Edited by: W. F. Vincent
References Adams, H. E., Crump, B. C., and Kling, G. W.: Temperature controls on aquatic bacterial production and community dynamics in arctic lakes and streams, Environ. Microbiol., 12, 1319–1333, doi:10.1111/j.1462-2920.2010.02176.x, 2010. Arvola, L., Ojala, A., Barbosa, F., and Heaney, S.: Migration behaviour of three cryptophytes in relation to environmental gradients: an experimental approach, Brit. Phyco. J., 26, 361–373, doi:10.1080/00071619100650331, 1991. Bastviken, D., Cole, J., Pace, M., and Tranvik, L.: Methane emissions from lakes: Dependence of lake characteristics, two regional assessments, and a global estimate, Global Biogeochem. Cy., 18, GB4033, doi:10.1029/2004GB002238, 2004. Bastviken, D., Cole, J. J., Pace, M. L., and Van de Bogert, M. C.: Fates of methane from different lake habitats: connecting wholelake budgets and CH4 emissions, J. Geophys. Res.-Biogeo., 113, G02024, doi:10.1029/2007JG000608, 2008. Bégin, P. N.: Rotifer abundance, biodiversity and controlling variables in subarctic thermokarst lakes and ponds, M.Sc thesis, Université Laval, Québec, 78 pp., 2014. Bianchi, T. S.: The role of terrestrially derived organic carbon in the coastal ocean: a changing paradigm and the priming effect, P. Natl. Acad. Sci. USA, 108, 19473–19481, doi:10.1073/pnas.1017982108, 2011. Bouchard, F., Francus, P., Pienitz, R., and Laurion, I.: Sedimentology and geochemistry of thermokarst ponds in discontinuous permafrost, subarctic Québec, Canada, J. Geophys. Res., 116, G00M04, doi:10.1029/2011jg001675, 2011. Bouchard, F., Francus, P., Pienitz, R., Laurion, I., and Feyte, S.: Subarctic thermokarst ponds: Investigating recent landscape evolution and sediment dynamics in thawed permafrost of northern Québec (Canada), Arct. Antarct. Alp. Res., 46, 251–271, doi:10.1657/1938-4246-46.1.251, 2014. Breton, J., Vallières, C., and Laurion, I.: Limnological properties of permafrost thaw ponds in northeastern Canada, Can. J. Fish. Aquat. Sci., 66, 1635–1648, doi:10.1139/F09-108, 2009. Brett, M. T., Kainz, M. J., Taipale, S. J., and Seshan, H.: Phytoplankton, not allochthonous carbon, sustains herbivorous zooplankton production, P. Natl. Acad. Sci. USA, 106, 21197– 21201, doi:10.1073/pnas.0904129106, 2009. Brinkmann, T., Sartorius, D., and Frimmel, F.: Photobleaching of humic rich dissolved organic matter, Aquat. Sci., 65, 415–424, doi:10.1007/s00027-003-0670-9, 2003. Campbell, L., Nolla, H. A., and Vaulot, D.: The importance of Prochlorococcus to community structure in the central north pacific ocean, Limnol. Oceanogr., 39, 954–961, doi:10.4319/lo.1994.39.4.0954, 1994.
www.biogeosciences.net/12/7223/2015/
7235
Caplanne, S. and Laurion, I.: Effect of chromophoric dissolved organic matter on epilimnetic stratification in lakes, Aquat. Sci., 70, 123–133, doi:10.1007/s00027-007-7006-0, 2008. Crevecoeur, S., Vincent, W. F., Comte, J., and Lovejoy, C. Bacterial community structure across environmental gradients in permafrost thaw ponds: methanotroph-rich ecosystems, Front. Microbiol., 6, 192, doi:10.3389/fmicb.2015.00192, 2015. Crump, B. C., Kling, G. W., Bahr, M., and Hobbie, J. E.: Bacterioplankton community shifts in an arctic lake correlate with seasonal changes in organic matter source, Appl. Environ. Microbiol., 69, 2253–2268, doi:10.1128/aem.69.4.2253-2268.2003, 2003. Del Giorgio, P. and Davis, J.: Patterns in dissolved organic matter lability and consumption across aquatic ecosystems, in: Aquatic ecosystems: Interactivity of dissolved organic matter, edited by: Findlay, S. E. G. and Sinsabaugh, R. E., Academic press, San Diego, CA, 399–424, 2002. Del Giorgio, P. A. and Cole, J. J.: Bacterial growth efficiency in natural aquatic systems, Annu. Rev. Ecol. Syst., 29, 503–541, 1998. Deshpande, B. N., MacIntyre, S., Matveev, A., and Vincent, W. F.: Oxygen dynamics in permafrost thaw lakes: anaerobic bioreactors in the Canadian subarctic, Limnol. Oceanogr., 60, 1656– 1670, doi:10.1002/lno.10126, 2015. Doxaran, D., Cherukuru, R. C. N., and Lavender, S. J.: Estimation of surface reflection effects on upwelling radiance field measurements in turbid waters, J. Opt. A-Pure Appl. Op., 6, 690–697, doi:10.1088/1464-4258/6/7/006, 2004. Dupont, C.: Microbial diversity of thermokarst pond and their greenhouse gas production, M.Sc thesis, Institut national de la recherche scientifique, Université du Québec, Québec, 2008. Eller, G., Kanel, L., and Kruger, M.: Cooccurrence of aerobic and anaerobic methane oxidation in the water column of lake Plußsee, Appl. Environ. Microbiol., 71, 8925–8928, doi:10.1128/AEM.71.12.8925-8928.2005, 2005. Fendinger, N. J., Adams, D. D., and Glotfelty, D. E.: The role of gas ebullition in the transport of organic contaminants from sediments, Sci. Total. Environ., 112, 189–201, doi:10.1016/00489697(92)90187-W, 1992. Galgani, L., Tognazzi, A., Rossi, C., Ricci, M., Galvez, J. A., Dattilo, A. M., Cozar, A., Bracchini, L., and Loiselle, S. A.: Assessing the optical changes in dissolved organic matter in humic lakes by spectral slope distributions, J. Photoch. Photobio. B, 102, 132–139, doi:10.1016/j.jphotobiol.2010.10.001, 2011. Granéli, W., Bertilsson, S., and Philibert, A.: Phosphorus limitation of bacterial growth in high arctic lakes and ponds, Aquat. Sci., 66, 430–439, doi:10.1007/s00027-004-0732-7, 2004. Guérin, F., Abril, G., Richard, S., Burban, B., Reynouard, C., Seyler, P., and Delmas, R.: Methane and carbon dioxide emissions from tropical reservoirs: significance of downstream rivers, Geophys. Res. Lett., 33, L21407, doi:10.1029/2006gl027929, 2006. Guillemette, F. and del Giorgio, P. A.: Reconstructing the various facets of dissolved organic carbon bioavailability in freshwater ecosystems, Limnol. Oceanogr., 56, 734–748, doi:10.4319/lo, 2011. Hamilton, P. B., Gajewski, K., Atkinson, D. E., and Lean, D. R. S.: Physical and chemical limnology of 204 lakes from the Canadian arctic archipelago, Hydrobiologia, 457, 133–148, doi:10.1023/A:1012275316543, 2001.
Biogeosciences, 12, 7223–7237, 2015
7236
T. Roiha et al.: Carbon dynamics in highly heterotrophic subarctic thaw ponds
Hudson, J. J., Dillon, P. J., and Somers, K. M.: Long-term patterns in dissolved organic carbon in boreal lakes: the role of incident radiation, precipitation, air temperature, southern oscillation and acid deposition, Hydrol. Earth Syst. Sci., 7, 390–398, doi:10.5194/hess-7-390-2003, 2003. Jassby, A. D. and Platt, T.: Mathematical formulation of the relationship between photosynthesis and light for phytoplankton, Limnol. Oceanogr., 21, 540–547, 1976. Jones, R. I.: Advantages of diurnal vertical migrations to phytoplankton in sharply stratified, humic forest lakes, Arch. Hydrobiol., 120, 257–266, 1991. Jones, R. I.: Mixotrophy in planktonic protists: an overview, Freshwat. Biol., 45, 219–226, doi:10.1046/j.1365-2427.2000.00672.x, 2000. Juutinen, S., Rantakari, M., Kortelainen, P., Huttunen, J. T., Larmola, T., Alm, J., Silvola, J., and Martikainen, P. J.: Methane dynamics in different boreal lake types, Biogeosciences, 6, 209– 223, doi:10.5194/bg-6-209-2009, 2009. Kling, G. W., Kipphut, G. W., and Miller, M. C.: The flux of CO2 and CH4 from lakes and rivers in arctic Alaska, Hydrobiologia, 240, 23–36, doi:10.1007/Bf00013449, 1992. Kortelainen, P., Rantakari, M., Huttunen, J. T., Mattsson, T., Alm, J., Juutinen, S., Larmola, T., Silvola, J., and Martikainen, P. J.: Sediment respiration and lake trophic state are important predictors of large CO2 evasion from small boreal lakes, Glob. Change Biol., 12, 1554–1567, doi:10.1111/j.1365-2486.2006.01167.x, 2006. Kritzberg, E. S., Cole, J. J., Pace, M. L., Granéli, W., and Bade, D. L.: Autochthonous versus allochthonous carbon sources of bacteria: results from whole-lake 13 C addition experiments, Limnol. Oceanogr., 49, 588–596, doi:10.4319/lo.2004.49.2.0588, 2004. Laurion, I., Vincent, W. F., MacIntyre, S., Retamal, L., Dupont, C., Francus, P., and Pienitz, R.: Variability in greenhouse gas emissions from permafrost thaw ponds, Limnol. Oceanogr., 55, 115– 133, doi:10.4319/lo.2010.55.1.0115, 2010. Laybourn-Parry, J. and Marshall, W. A.: Photosynthesis, mixotrophy and microbial plankton dynamics in two high arctic lakes during summer, Polar Biol., 26, 517–524, doi:10.1007/s00300003-0514-z, 2003. Lizotte, M. P.: Phytoplankton and primary production, in: Polar lakes and rivers: limnology of arctic and antarctic aquatic ecosystems, edited by: Vincent, W. F. and Laybourn-Parry, J., Oxford University Press, Oxford, UK, 197–212, 2008. Loiselle, S. A., Bracchini, L., Cozar, A., Dattilo, A. M., Tognazzi, A., and Rossi, C.: Variability in photobleaching yields and their related impacts on optical conditions in subtropical lakes, J. Photoch. Photobio. B, 95, 129–137, doi:10.1016/j.jphotobiol.2009.02.002, 2009. Maloney, K. O., Morris, D. P., Moses, C. O., and Osburn, C. L.: The role of iron and dissolved organic carbon in the absorption of ultraviolet radiation in humic lake water, Biogeochemistry, 75, 393–407, doi:10.1007/s10533-005-1675-3, 2005. Medeiros, A. S., Biastoch, R. G., Luszczek, C. E., Wang, X. A., Muir, D. C. G., and Quinlan, R.: Patterns in the limnology of lakes and ponds across multiple local and regional environmental gradients in the eastern Canadian arctic, Inland Waters, 2, 59–76, doi:10.5268/Iw-2.2.427, 2012. Mitchell, B. G., Kahru, M., Wieland, J., and Stramska, M.: Determination of spectral absorption coefficients of particles, dissolved material and phytoplankton for discrete water samples, Ocean
Biogeosciences, 12, 7223–7237, 2015
optics protocols for satellite ocean color sensor validation, Revision, 3, 231–257, 2002. Negandhi, K., Laurion, I., Whiticar, M. J., Galand, P. E., Xu, X., and Lovejoy, C.: Small thaw ponds: an unaccounted source of methane in the Canadian high arctic, PLoS One, 8, e78204, doi:10.1371/journal.pone.0078204, 2013. Nush, E.: Comparison of different methods for chlorophyll and phaeopigment determination, Arch. Hydrobiol. Beih, 14, 14–36, 1980. Ochs, C. A., Cole, J. J., and Likens, G. E.: Population-dynamics of bacterioplankton in an oligotrophic lake, J. Plankton. Res., 17, 365–391, doi:10.1093/plankt/17.2.365, 1995. Olrik, K.: Ecology of mixotrophic flagellates with special reference to chrysophyceae in Danish lakes, Hydrobiologia, 370, 329–338, doi:10.1023/A:1017045809572, 1998. Pienitz, R., Smol, J. P., and Lean, D. R. S.: Physical and chemical limnology of 59 lakes located between the southern Yukon and the Tuktoyaktuk peninsula, Northwest Territories (Canada), Can. J. Fish. Aquat. Sci., 54, 330–346, doi:10.1139/cjfas-54-2330, 1997. Platt, T., Gallegos, C. L., and Harrison, W. G.: Photoinhibition of photosynthesis in natural assemblages of marine-phytoplankton, J. Mar. Res., 38, 687–701, 1980. Posch, T., Loferer-Krossbacher, M., Gao, G., Alfreider, A., Pernthaler, J., and Psenner, R.: Precision of bacterioplankton biomass determination: a comparison of two fluorescent dyes, and of allometric and linear volume-to-carbon conversion factors, Aquat. Microb. Ecol., 25, 55–63, doi:10.3354/ame025055, 2001. Putt, M. and Stoecker, D. K.: An experimentally determined carbon: volume ratio for marine “oligotrichous” ciliates from estuarine and coastal waters, Limnol. Oceanogr., 34, 1097–1103, 1989. Rae, R. and Vincent, W. F.: Phytoplankton production in subarctic lake and river ecosystems: development of a photosynthesistemperature-irradiance model, J. Plankton Res., 20, 1293–1312, doi:10.1093/plankt/20.7.1293, 1998. Rautio, M., Dufresne, F., Laurion, I., Bonilla, S., Vincent, W. F., and Christoffersen, K. S.: Shallow freshwater ecosystems of the circumpolar arctic, Ecoscience, 18, 204–222, doi:10.2980/18-33463, 2011. Roehm, C. L., Giesler, R., and Karlsson, J.: Bioavailability of terrestrial organic carbon to lake bacteria: the case of a degrading subarctic permafrost mire complex, J. Geophys. Res.-Biogeo., 114, G03006, doi:10.1029/2008jg000863, 2009. Roiha, T., Tiirola, M., Cazzanelli, M., and Rautio, M.: Carbon quantity defines productivity while its quality defines community composition of bacterioplankton in subarctic ponds, Aquat. Sci., 74, 513–525, doi:10.1007/s00027-011-0244-1, 2012. Rossi, P. G., Laurion, I., and Lovejoy, C.: Distribution and identity of bacteria in subarctic permafrost thaw ponds, Aquat. Microb. Ecol., 69, 231–245, doi:10.3354/ame01634, 2013. Salonen, K. and Rosenberg, M.: Advantages from diel vertical migration can explain the dominance of Gonyostomum semen (Raphidophyceae) in a small, steeply-stratified humic lake, J. Plankton Res., 22, 1841–1853, doi:10.1093/plankt/22.10.1841, 2000. Salonen, K., Jones, R. I., and Arvola, L.: Hypolimnetic phosphorus retrieval by diel vertical migrations of lake phytoplankton, Freshwat. Biol., 14, 431–438, doi:10.1111/j.13652427.1984.tb00165.x, 1984.
www.biogeosciences.net/12/7223/2015/
T. Roiha et al.: Carbon dynamics in highly heterotrophic subarctic thaw ponds Säwström, C., Laybourn-Parry, J., Granéli, W., and Anesio, A. M.: Heterotrophic bacterial and viral dynamics in arctic freshwaters: results from a field study and nutrient-temperature manipulation experiments, Polar Biol., 30, 1407–1415, doi:10.1007/s00300007-0301-3, 2007. Squires, M. M. and Lesack, L. F. W.: Spatial and temporal patterns of light attenuation among lakes of the Mackenzie Delta, Freshwater Biol., 48, 1–20, doi:10.1046/j.1365-2427.2003.00960.x, 2003. Selinummi, J., Seppälä, J., Yli-Harja, O., and Puhakka, J. A.: Software for quantification of labeled bacteria from digital microscope images by automated image analysis, BioTechniques, 39, 859–863, 2005. Shirokova, L. S., Pokrovsky, O. S., Kirpotin, S. N., Desmukh, C., Pokrovsky, B. G., Audry, S., and Viers, J.: Biogeochemistry of organic carbon, CO2 , CH4 , and trace elements in thermokarst water bodies in discontinuous permafrost zones of western Siberia, Biogeochemistry, 113, 573–593, doi:10.1007/s10533012-9790-4, 2013. Simon, M. and Azam, F.: Protein-content and protein-synthesis rates of planktonic marine-bacteria, Mar. Ecol.-Prog. Ser., 51, 201–213, doi:10.3354/meps051201, 1989. Sivan, O., Adler, M., Pearson, A., Gelman, F., Bar-Or, I., John, S. G., and Eckert, W.: Geochemical evidence for iron-mediated anaerobic oxidation of methane, Limnol. Oceanogr., 56, 1536– 1544, doi:10.4319/lo.2011.56.4.1536, 2011. Smith, D. C. and Azam, F.: A simple, economical method for measuring bacterial protein synthesis rates in seawater using 3 Hleucine, Mar. Microb. Food Webs, 6, 107–114, 1992. Teodoru, C. R., del Giorgio, P. A., Prairie, Y. T., and Camire, M.: Patterns in pCO2 in boreal streams and rivers of northern Quebec, Canada, Global Biogeochem. Cy., 23, GB2012, doi:10.1029/2008gb003404, 2009. Tranvik, L. J.: Availability of dissolved organic carbon for planktonic bacteria in oligotrophic lakes of differing humic content, Microb. Ecol., 16, 311–322, doi:10.1007/BF02011702, 1988. Tranvik, L. J., Downing, J. A., Cotner, J. B., Loiselle, S. A., Striegl, R. G., Ballatore, T. J., Dillon, P., Finlay, K., Fortino, K., Knoll, L. B., Kortelainen, P. L., Kutser, T., Larsen, S., Laurion, I., Leech, D. M., McCallister, S. L., McKnight, D. M., Melack, J. M., Overholt, E., Porter, J. A., Prairie, Y., Renwick, W. H., Roland, F., Sherman, B. S., Schindler, D. W., Sobek, S., Tremblay, A., Vanni, M. J., Verschoor, A. M., von Wachenfeldt, E., and Weyhenmeyer, G. A.: Lakes and reservoirs as regulators of carbon cycling and climate, Limnol. Oceanogr., 54, 2298–2314, doi:10.4319/lo.2009.54.6_part_2.2298, 2009.
www.biogeosciences.net/12/7223/2015/
7237
Vallentyne, J.: Fossil pigments, Comparative biochemistry of photoreactive systems, 83–105, 1960. Verity, P. G., Robertson, C. Y., Tronzo, C. R., Andrews, M. G., Nelson, J. R., and Sieracki, M. E.: Relationships between cellvolume and the carbon and nitrogen-content of marine photosynthetic nanoplankton, Limnol. Oceanogr., 37, 1434–1446, 1992. Vonk, J. E., Sanchez-Garcia, L., van Dongen, B. E., Alling, V., Kosmach, D., Charkin, A., Semiletov, I. P., Dudarev, O. V., Shakhova, N., Roos, P., Eglinton, T. I., Andersson, A., and Gustafsson, O.: Activation of old carbon by erosion of coastal and subsea permafrost in arctic Siberia, Nature, 489, 137–140, doi:10.1038/nature11392, 2012. Vonk, J. E., Tank, S. E., Bowden, W. B., Laurion, I., Vincent, W. F., Alekseychik, P., Amyot, M., Billet, M. F., Canário, J., Cory, R. M., Deshpande, B. N., Helbig, M., Jammet, M., Karlsson, J., Larouche, J., MacMillan, G., Rautio, M., Walter Anthony, K. M., and Wickland, K. P.: Reviews and syntheses: Effects of permafrost thaw on Arctic aquatic ecosystems, Biogeosciences, 12, 7129–7167, doi:10.5194/bg-12-7129-2015, 2015. Vrede, K.: Nutrient and temperature limitation of bacterioplankton growth in temperate lakes, Microb. Ecol., 49, 245–256, doi:10.1007/s00248-004-0259-4, 2005. Walter, K. M., Zimov, S. A., Chanton, J. P., Verbyla, D., and Chapin, F. S.: Methane bubbling from Siberian thaw lakes as a positive feedback to climate warming, Nature, 443, 71–75, doi:10.1038/nature05040, 2006. Walter Anthony, K. M., Zimov, S. A., Grosse, G., Jones, M. C., Anthony, P. M., Chapin, F. S., 3rd, Finlay, J. C., Mack, M. C., Davydov, S., Frenzel, P., and Frolking, S.: A shift of thermokarst lakes from carbon sources to sinks during the Holocene epoch, Nature, 511, 452–456, doi:10.1038/nature13560, 2014. Watanabe, S., Laurion, I., Chokmani, K., Pienitz, R., and Vincent, W. F.: Optical diversity of thaw ponds in discontinuous permafrost: a model system for water color analysis, J. Geophys. Res.-Biogeo., 116, G02003, doi:10.1029/2010jg001380, 2011. Weishaar, J. L., Aiken, G. R., Bergamaschi, B. A., Fram, M. S., Fujii, R., and Mopper, K.: Evaluation of specific ultraviolet absorbance as an indicator of the chemical composition and reactivity of dissolved organic carbon, Environ. Sci. Technol., 37, 4702– 4708, doi:10.1021/es030360x, 2003. Xiao, Y. H., Sara-Aho, T., Hartikainen, H., and Vähätalo, A. V.: Contribution of ferric iron to light absorption by chromophoric dissolved organic matter, Limnol. Oceanogr., 58, 653– 662, doi:10.4319/lo.2013.58.2.0653, 2013.
Biogeosciences, 12, 7223–7237, 2015