Published online May 16, 2007
Carbon Sequestration and Soil Aggregation in Center-Pivot Irrigated and Dryland Cultivated Farming Systems Jeroen Gillabel* Division Soil and Water Management Dep. of Land Management and Economics Katholieke Univ. Leuven, Kasteelpark Arenberg 20 3001 Heverlee Belgium
Karolien Denef Lab. of Applied Physical Chemistry Ghent Univ. Ghent Belgium
John Brenner SOIL & WATER MANAGEMENT & CONSERVATION
USDA-NRCS Lakewood, CO 80226
Roel Merckx Division Soil and Water Management Dep. of Land Management and Economics Katholieke Univ. Leuven, Kasteelpark Arenberg 20 3001 Heverlee Belgium
Although irrigation is considered a beneficiary management for increasing soil organic C (SOC) stocks in (semi)arid environments, our understanding of the impact of irrigation on soil organic matter (SOM) dynamics in the field remains limited. We investigated the effect of irrigation on soil C storage in relation to soil aggregation by measuring C stocks of bulk soil and different aggreagate fractions in the top 20-cm layer of center-pivot irrigated vs. dryland farming systems in semiarid southwestern Nebraska. The irrigated fields (IRR) showed increased C inputs and larger SOC stocks than the dryland cultivated fields (DRY). Fractionation of bulk soil samples into non-microaggregate-associated particulate organic matter (free POM) and microaggregate-associated POM, silt, and clay fractions indicated that the larger bulk SOC stock under IRR was explained solely by an increase in microaggregate-associated C storage Wet sieving of bulk soil showed that microaggregation was remarkably low under DRY and did not increase under IRR, suggesting that the protection of microaggregates inside macroaggregates was no prerequisite for C sequestration under IRR. The results of this study confirm the potential of irrigation to increase soil C stocks through preferential sequestration of C inside microaggregates, but question our understanding of the mechanisms underlying this preferential sequestration. Abbreviations: cPOM, coarse particulate organic matter (>250 µm); DRY, dryland cultivated treatment; iPOM, intramicroaggregate particulate organic matter; IRR, center-pivot irrigated treatment; mClay, microaggregate-associated clay fraction; micro-C, microaggregate-associated C; mSilt, microaggregateassociated silt fraction; NV, native vegetation; POM, particulate organic matter; SOC, soil organic carbon; SOM, soil organic matter; TOC, total organic carbon.
Keith Paustian Dep. of Soil and Crop Sciences and Natural Resource Ecology Lab. Colorado State Univ. Fort Collins, CO 80523
I
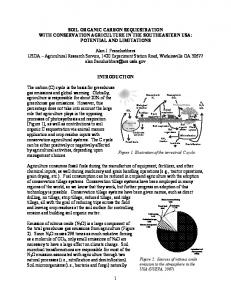
ncreasing the amount of C sequestered in cropland through improved agricultural management has become an important part of the strategy to mitigate CO2 emissions to the atmosphere (Lal et al., 1998; Intergovernmental Panel on Climate Change, 2001). Examples of management practices that enhance soil C stocks are reduced tillage and increasing cropping intensity Soil Sci. Soc. Am. J. 71:1020–1028 doi:10.2136/sssaj2006.0215 Received 8 June 2006. *Corresponding author (
[email protected]). © Soil Science Society of America 677 S. Segoe Rd. Madison WI 53711 USA All rights reserved. No part of this periodical may be reproduced or transmitted in any form or by any means, electronic or mechanical, including photocopying, recording, or any information storage and retrieval system, without permission in writing from the publisher. Permission for printing and for reprinting the material contained herein has been obtained by the publisher.
1020
(Paustian et al., 2000), but also irrigation is believed to be a potential beneficial management for increasing soil C stocks (Follett, 2001). Carbon sequestration rates through irrigation have been estimated to reach as high as 50 to 150 kg ha−1 yr−1 (Lal et al., 1998). These estimates, however, are based solely on increased C inputs due to enhanced biomass production on irrigation. Yet, irrigation can affect the soil C balance in several other ways as well. For example, irrigation can greatly stimulate microbial activity in regions suffering from drought. In a study of Churchman and Tate (1986), irrigation led to a decrease of C stocks in soils under pasture, suggesting that its effect on microbial activity and SOM decomposition was potentially more dominant than its effect on C input. Besides increasing C input and microbial activity, irrigation can also affect soil structure. Many studies have reported a negative impact of irrigation on physical properties such as bulk density, porosity, and hydraulic conductivity (Moreno et al., 1986; Elnaim et al., 1987; Poznyak, 1990; Al-Nabulsi, 2001), SSSAJ: Volume 71: Number 3 • May–June 2007
as well as severe seal and crust formation due to the impact of water drops (Shainberg et al., 1997). In irrigated arid regions, irrigation water is often highly sodic and could induce a high exchangeable sodium proportion on the soil complex, which increases dispersion of clay particles, leading to degradation of soil structure (Amezketa, 1999) and decreased macroaggregate resistance to drop impact (Levy and Torrento, 1995). Finally, the different soil moisture regime resulting from irrigation can also affect soil structure by reducing the occurrence of dry–wet cycles. Although dry–wet cycles in aggregated soils have been shown to have detrimental effects on aggregation (e.g., Utomo and Dexter, 1982), the overall impact of dry–wet cycles on soil structure depends on several soil factors (Six et al., 2004) and appears to be only short term (Denef et al., 2001). By its effect on soil structure, irrigation can influence the C balance of the soil. It is well known that there exists a feedback mechanism between aggregation and SOM dynamics (for an extensive review on this topic, see Six et al., 2004). Increased SOM input (e.g., as a result of irrigation) can lead to increased aggregate formation (De Gryze et al., 2005; Kong et al., 2005), which in turn enhances C sequestration by physical protection of SOM inside aggregates. Disruption of aggregates by irrigation water, however, could have the opposite effect. Recent studies on aggregate–SOM relationships in agricultural systems have indicated the importance of the macroaggregate-occluded microaggregate fraction for stabilizing C under more sustainable agricultural management systems like notillage (Six et al., 2000; Denef et al., 2004) or on increased residue return to the soil (Kong et al., 2005). These studies suggested that the macroaggregate-occluded microaggregate-associated C fraction may be a highly accurate and general diagnostic fraction for changes in total SOC in response to changes in tillage and, potentially, other management practices. Examination of the C stabilization capacity of this fraction under irrigation management can help elucidate mechanisms of C sequestration in irrigated systems. The aim of this work was (i) to compare SOC storage and aggregation in center-pivot irrigated and dryland farming systems in the western Nebraskan Great Plains, (ii) to investigate if a link between C input, SOC storage, and aggregation can be found in these agricultural systems, and (iii) to determine which physical fractions are responsible for any observed SOC differences between irrigated and dryland managed systems. We hypothesized that: (i) SOC and macroaggregation levels are higher under center-pivot irrigated than dryland cultivated management; and (ii) the difference in total SOC stocks between irrigated and dryland treatments is reflected in a difference in macroaggregate-occluded microaggregate-associated C.
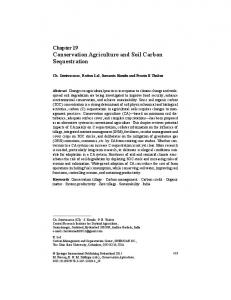
with drop sprinklers was established at both farms. On each field, this system consisted of an irrigated circular area (pivot) of about 50 ha (approximately 800-m diameter, see Fig. 1). Since the fields were squares with sides of the same length as the pivot diameter, the four corners of each field (each about 3.5 ha; Fig. 1) did not receive irrigation water and stayed under the dryland WF system. For the irrigated pivots, the dominant cropping system was continuous corn (Zea mays L.), which occasionally changed into a WF rotation. Since 2000, all fields have been managed under conservation (chisel) tillage with a crop rotation of corn (extra disking tillage), winter wheat, and soybean [Glycine max (L.) Merr.] for the irrigated pivots, and a WF–corn rotation for the dryland corners. Within the pivots, a first irrigation event generally takes place in May to incorporate herbicides into the soil (approximately 19 mm). The true irrigation season usually starts at the end of June and continues until the end of August. During these months, up to 60 mm wk−1 can be applied in dry periods. Most farmers in this area initiate an irrigation event when soil moisture is depleted to 50% of the available water capacity, to keep the root zone below field capacity in case rainfall is received. Crop yield data were provided by the farmers for the last 4 yr. From these yield data, average annual total (below- + aboveground) residue C inputs per treatment were estimated (S. Williams, Natural Resource Ecology Lab., personal communication, 2005), which can be found in Table 1. The differentiation of each field in 1970 into irrigated- and dryland-managed parts formed the basis for our irrigated vs. dryland treatment comparison. The pivot zones of each field are referred to as the IRR treatment, while the dryland corner zones are referred to as the DRY treatment. A native grassland area adjacent to one of the fields and about half the size of the fields (NV treatment) was included as a reference; before cultivation, all sites were under similar native grassland vegetation. Relative locations of all fields and treatments can be seen in Fig. 1.
Sampling Design To address the spatial variability inevitably linked with the large size of the fields, a specific sampling design was used (Fig. 1, enlarged field). On each field, the pivot zone was divided into four quadrants,
MATERIALS AND METHODS Site and Treatment Description Sampling was done in May and November 2004 on two farms near Imperial, southwestern Nebraska (40°31′ N, 101°38′ W, 1029 m above sea level). The mean annual temperature is 11°C. Annual precipitation averages 570 mm. The sampling sites have a flat topography and cover three soil series: Alliance (fine-silty, mixed, superactive, mesic Aridic Argiustoll), Goshen (fine-silty, mixed, superactive, mesic Pachic Argiustoll), and Rosebud (fine-loamy, mixed, superactive, mesic Calcidic Argiustoll). The four fields that were sampled had been under a dryland winter wheat (Triticum aestivum L.)–summer fallow (WF) rotation from 1940 until around 1970, when a similar center-pivot irrigation system SSSAJ: Volume 71: Number 3 • May–June 2007
Fig. 1. Map of sampled fields with scheme of the soil sampling design. The locations of the four sampled fields are shown as squares, showing the irrigated pivot area (white circles) and randomly selected dryland corners (black areas) inside each field. One field is enlarged to show the sampling design of the pivot area. Each pivot was divided into four quadrants; the inner half of the pivot was excluded to avoid boundary effects. Three samples were randomly taken inside each quadrant and inside each selected corner (dots). In the native vegetation area (rectangle with diagonal lines), six random sample locations were chosen.
1021
Table 1. Annual residue C input to the soil for three management treatments: native vegetation (NV), center-pivot irrigation (IRR), and dryland cultivation (DRY). Inputs were estimated based on 4-yr records of crop yields, using crop yield–residue conversion formulas (S. Williams, personal communication, 2005). DM = dry matter. Treatment
Annual C input kg C
NV
ha−1
3000
Formula used for estimations† DM yield and aboveground biomass in kg DM ha−1 average value for study region corn aboveground: 0.4 × 0.6(1.06 × yield DM + 503)
IRR
4588
corn belowground: 0.4 × aboveground biomass × 0.23 × 0.72 × 1.24 soybean aboveground: 0.4(1.08 × yield DM + 1182) soybean belowground: 0.4 × aboveground biomass × 0.26 × 0.75 × 1.24 corn aboveground: 0.4(1.06 × yield DM + 503)
DRY
1863
corn belowground: 0.4 × aboveground biomass × 0.23 × 0.72 × 1.24 wheat aboveground: 0.4(1.61 × yield DM + 389) wheat belowground: 0.4 × aboveground biomass × 0.19 × 0.69 × 1.24
† Formulas for aboveground and belowground C input are in the form: aboveground C input (kg C ha−1 yr−1) = CCF × RRF(YCF1 × yield DM + YCF2); belowground C input (kg C ha−1 yr−1) = CCF × aboveground biomass × BCF × DCF × ECF, where CCF = conversion factor (kg dry matter to kg C); RRF = factor accounting for residue removal in the case of irrigated corn; YCF1, YCF2, and BCF = empirical conversion factors based on literature, DCF = factor to limit calculations to the 0–20-cm layer; and ECF = factor to take into account contributions of root exudates and dead roots.
and two of the field’s four dryland corners were randomly selected. In each quadrant and selected corner, three sample locations were randomly selected; the inner half of the pivot area was avoided to exclude boundary effects. For the native grassland area, six random locations were selected. At each sample location, three soil cores (5.5-cm diameter) were taken approximately 1 m apart using a hydraulic Giddings probe. Each core was divided into two depths: 0 to 5 and 5 to 20 cm. The soil from the three cores was combined per depth, bagged, and transported to the laboratory with minimal compaction. Once in the laboratory, fieldmoist samples were passed through an 8-mm sieve by gently breaking up the soil clods along their natural planes of failure, and subsequently air dried. Organic material >8 mm was removed during sieving. For
each sample, bulk density was calculated based on gravimetric water content and sampling core volume, particle size distributions were determined, and total organic C content measured. Since sampled locations were homogeneous with respect to texture and the spatial variability of C contents was low within each pivot or corner (data not shown), the three air-dried soil samples from each quadrant or corner were mixed per depth to reduce the extensive fractionation work. For IRR, 16 composited samples were obtained per depth (four fields × four quadrants), while DRY had eight samples per depth (four fields × two corners). Similarly, the native grassland samples were mixed pairwise in a random manner, resulting in three (pseudo)replicates per depth for NV. All published results are from the composited samples.
Aggregate Separation Aggregate size distribution was determined by a wet sieving technique, adopted from Elliott (1986). Briefly, a 100-g air-dried soil sample was submerged in deionized water for 5 min and subsequently sieved on a 250-µm sieve by manually moving the sieve 50 times up and down in the water in 2 min. The fraction that remained on the sieve (macroaggregate fraction, >250 µm) was backwashed into an aluminum pan, oven dried overnight at 60°C, and weighed the next day. The soil suspension that passed the sieve was poured onto a 53µm sieve and sieving was repeated. Both the fraction remaining on the sieve (microaggregate fraction, 53–250 µm) as well as the material 250 µm; LF = light-fraction particulate organic matter not occluded inside microaggregates; Free POM = sum of cPOM and LF, i.e., non-microaggregate-associated particulate organic matter; iPOM = intramicroaggregate POM; mSilt and mClay = microaggregate-associated silt and clay fractions, respectively). 1022
Microaggregate Isolation and Fractionation of Associated Organic Matter Due to the lack of significant amounts of macroaggregates in the cultivated treatments, macroaggregate-occluded microaggregates could not be isolated for C analyses. Instead, C distribution was only investigated among fractions 250 µm), microaggregate-sized fraction (53–250 µm), silt-sized fraction (2–53 µm), and clay-sized fraction ( IRR > DRY for both depths (Table 2). For the whole 0- to 20-cm layer, IRR had a significantly higher TOC stock than DRY, but the TOC stock under IRR stayed well below the NV TOC stock. Total N stocks followed the same trends as those found for TOC stocks (Table 2). Estimations of residue C input with yield-conversion formulas based on 4-yr averaged crop yields showed that residue C input for IRR was almost 2.5 times as high as for DRY, and 1.5 times as high as for NV (Table 1).
SSSAJ: Volume 71: Number 3 • May–June 2007
Aggregation At both depths, macroaggregation was very low (around 10% of the soil weight) in both IRR and DRY compared with NV (up to 60%) (Fig. 3). In the 0- to 5-cm layer, IRR had a significant but small positive effect on macroaggregation. The amount of microaggregates in the surface layer obtained by wet sieving was greatest under IRR and decreased as follows: IRR > DRY > NV. Concomitant with the larger amounts of macro- and microaggregates in IRR vs. DRY in the 0- to 5-cm layer, the IRR > DRY (Fig. 4b) and were
Fig. 3. Aggregate size distribution as determined by wet sieving for (a) the 0- to 5-cm and (b) the 5- to 20-cm layers of soils under three management treatments (NV = native vegetation; IRR = center-pivot irrigated; DRY = dryland cultivated). Error bars represent standard errors. Values followed by different lowercase letters statistically differ between IRR and DRY and within depth. 1024
higher in the 0- top 5-cm than the 5- to 20-cm layer for all treatments. On a total-soil basis (g C m−2), both IRR and DRY had comparable amounts of C in the free POM fraction at both depths (Fig. 5). This amount was less than half of that in the free POM fraction of NV. For the micro-C fraction, however, a significantly higher C stock was observed for IRR than DRY, with the difference between IRR and NV being less pronounced. No significant differences were found among all treatments for the C stocks of the silt and clay fractions (silt and clay in Fig. 5).
Fig. 4. (a) Amount of total microaggregates obtained by microaggregate isolation and (b) microaggregate-associated organic C (OC) concentration isolated from bulk soil samples from the 0to 5- and 5- to 20-cm soil layers under three management treatments (NV = native vegetation; IRR = center-pivot irrigated; DRY = dryland cultivated). Error bars represent standard errors. Values followed by different lowercase letters statistically differ between IRR and DRY and within depth. SSSAJ: Volume 71: Number 3 • May–June 2007
Intramicroaggregate Carbon Distribution
DISCUSSION
Since the greatest difference in C stocks between IRR and DRY was found in the micro-C fraction (Fig. 5), it was decided to look at the distribution of C among different microaggregate-associated fractions. The distribution of micro-C among these fractions is shown in Fig. 6. In all treatments and depths, mClay C stock contributed the most to the total micro-C stock. For the 0- to 5-cm layer, a significant increase in mClay C was observed under IRR compared with DRY, but this difference was absent at deeper depth. The iPOM C stocks were significantly higher under IRR than under DRY at both depths. For the mSilt C, the same trends were found as for iPOM C, although the difference in the 0- to 5-cm layer was not significant.
Carbon Stocks and Aggregation
Modeled Soil Moisture Content Figure 7 shows the evolution of soil moisture content in the 0- to 5- and 5- to 20-cm layers during the corn growing season, as modeled with BUDGET (Raes, 2002). Under dryland conditions and at the 0- to 5-cm depth, large variations in soil moisture occurred in relatively small time intervals (Fig. 7a). Under irrigated conditions, these variations strongly decreased (Fig. 7b), and soil moisture was almost always above field capacity. Although less pronounced, the same trends were visible in the 5- to 20-cm layer.
Fig. 5. Organic C (OC) stocks of non-microaggregate-associated particulate organic matter (free POM), microaggregate-associated C (Micro-C), and silt and clay fractions for (a) the 0- to 5-cm and (b) 5- to 20-cm layers of soils under three management treatments (NV = native vegetation; IRR = center-pivot irrigated; DRY = dryland cultivated). Error bars represent standard errors. Values followed by different lowercase letters statistically differ between IRR and DRY and within depth.
SSSAJ: Volume 71: Number 3 • May–June 2007
Our first aim was to compare C stocks and aggregation between irrigated and dryland managed treatments. Carbon storage under irrigation was clearly higher than under dryland management, since C stocks in the top 20 cm of the soil were almost 25% higher under IRR than under DRY (3301 g m−2 for IRR vs. 2664 g m−2 for DRY). This higher C storage could be linked to a greater C input under irrigation, since estimated crop residue C inputs under IRR were 2.5 times as high as those under DRY; however, calculations of turnover times of bulk soil C based on C input estimates and measured C stocks—assuming steady state of the system—showed that the turnover time of C under IRR was only 50% of that under NV and DRY. This indicates a faster cycling of C through the soil under IRR than DRY, most likely because irrigation favors microbial activity by offsetting moisture limits on decomposition, which are typical for these dry areas. These results show that the C sequestration potential of irrigation cannot be evaluated in terms of a C input effect alone (e.g., Lal et al., 1998). Changes in soil C dynamics caused by irrigation have to be included as well.
Fig. 6. Organic C (OC) stocks of intramicroaggregate fractions (iPOM = intramicroaggregate POM; mSilt = microaggregate-associated silt; mClay = microaggregate-associated clay) for (a) the 0- to 5-cm and (b) 5- to 20-cm soil layers under three management treatments (NV = native vegetation; IRR = center-pivot irrigated; DRY = dryland cultivated). Error bars represent standard errors. Values followed by different lowercase letters statistically differ between IRR and DRY and within depth. 1025
Since C data from right before the start of irrigation were not available, it was not possible to calculate an accurate C sequestration rate for the irrigated fields. Before the installment of the center-pivot irrigation system, however, the IRR and DRY fields had the same cropping and management history, consisting of 30 yr of dryland agriculture. Therefore, if we assume that the soil C content was at an equilibrium state at the start of irrigation and did not change under DRY since then, we can estimate the C sequestration rate under irrigation based on the measured 2004 soil C contents of IRR and DRY fields. Under this assumption, an average C accumulation rate of 19 g m−2 yr−1 (637 g C m−2 over 33 yr) was calculated for the 0- to 20-cm layer under irrigation. This estimate is slightly higher than the range estimated by Lal et al. (1998), which was 5 to 15 g C m−2 yr−1. The percentage of soil present as macroaggregates was much lower in DRY than in NV. Cultivation is known to result in a decrease of macroaggregation due to physical disturbance from tillage operations (Tisdall and Oades, 1982). Furthermore, a reduced C input and increased microbial decomposition—due to increased aeration—of SOM on dryland cultivation of native grassland soils can further explain the diminished macroaggregation in dryland
Fig. 7. Modeled soil moisture regime in the 0- to 5- and 5- to 20cm soil layers during the growing season (May–October) of corn (a) under dryland and (b) under irrigated treatments. The BUDGET software package for modeling the soil water balance (Raes, 2002) was used. Irrigation events were simulated during July and August by applying 19 mm of water whenever soil moisture content dropped below 50% of the readily available water content. This scheme agrees with the irrigation scheme used by the farmers at the site. Saturation = 46%, field capacity = 31%, and permanent wilting point = 15% (default BUDGET parameters for a loam soil).
1026
cultivated soils relative to native soils (Elliott, 1986). In contrast to what we hypothesized, irrigation caused only a minor increase in macroaggregation compared with DRY, and remained unexpectedly low. There were several reasons why we predicted an increase in macroaggregation under irrigation. First, increased residue-C additions have been found to induce increases in macroaggregates (De Gryze et al., 2005). Second, stimulation of microbial activity can lead to increased macroaggregate formation due to the production of aggregate binding agents (Tisdall and Oades, 1982). Thus by increasing residue C inputs and by making the soil moisture regime more favorable for microbial activity, IRR was expected to show more macroaggregates than DRY. Interestingly, much higher macroaggregate levels were found in the NV treatment, indicating the potential of this particular soil type in this specific climatic environment (similar for all treatments) to form large amounts of stable macroaggregates. We therefore postulate that other factors than climate and inherent soil properties were responsible for the low macroaggregate levels under IRR. One factor could be the time of sampling, since we did not sample the fields throughout the year. It might be possible that average macroaggregation during the year was higher than the value found at the time of sampling. Half of the fields were sampled right after tillage (April–May 2004), however, while the other half was sampled right after harvest (November 2004), with no significant effect of sampling time found on macroaggregation (data not shown). Thus, even after a full growing and irrigation season, macroaggregation had not increased under IRR relative to DRY, although more samplings throughout the year are necessary to verify this assumption. The low amount of macroaggregates under IRR suggests that the hypothesized positive effect of irrigation on aggregation could not counteract the negative effect of physical disturbance by tillage practices (similar for IRR and DRY). In addition, root growth, stimulation of microbial activity, and reduced dry–wet cycles during the irrigated crop growing season (see Fig. 7) did not promote aggregation. This could have been due to an increase in exchangeable sodium percentage (ESP) under IRR. Levy and Torrento (1995) tested the influence of exchangeable Na on the resistance of macroaggregates to drop impact. They found that macroaggregate stability decreased 25% when ESP increased from 0.3 to 1.3%. We observed a similar increase in ESP in IRR compared with DRY (from 0.49 to 0.99% and from 0.45 to 1.41% in the 0–5- and 5–20-cm layers, respectively). A final factor possibly contributing to the lack of macroaggregation in IRR could be a negative effect of the high moisture content on fungal growth. Fungal hyphae are seen as major contributors to macroaggregate formation (Tisdall and Oades, 1982). Since fungi have been reported to suffer more rapidly from O2 depletion than bacteria (Frey et al., 1999), the high moisture content under irrigation could have favored bacterial growth over fungal growth.
Microaggregates: Preferential Carbon Sequestration Sites under Irrigation Our second aim was to identify the physical fraction(s) responsible for increased C storage under irrigation. Although several studies have demonstrated the importance of the macroaggregateoccluded microaggregate fraction for long-term C stabilization under improved agricultural management (e.g., Denef et al., 2004; Kong et al., 2005), this fraction did not seem to play a major role in C sequestration under irrigation since only 10% of the soil mass SSSAJ: Volume 71: Number 3 • May–June 2007
was found in the macroaggregate fraction. Therefore, the role of “total” microaggregates as preferential C sequestration sites under IRR management was investigated. Comparison of the C distribution among free and microaggregate-associated C fractions showed that 88% of the difference in total C between IRR and DRY was accounted for by the difference in micro-C. Free POM, on the other hand, accounted for only 10% of the total C difference between these two treatments, while silt and clay fractions were not affected by irrigation at all. These results indicate that increased C storage under irrigation occurs through preferential C stabilization inside microaggregates. The increase in micro-C was due to not only an increased amount of microaggregates (Fig. 4a) but also an increase in their C concentration (Fig. 4b) (the former only in the 0–5-cm layer). The distribution of C inside microaggregates (Fig. 6) shows that this increase was the result of both increased iPOM C and increased mSilt and mClay C (the latter two depending on the depth). Comparison of NV with DRY showed a different trend than comparison of IRR with DRY. Free POM and micro-C each accounted for about half of the total C difference between NV and DRY, with silt and clay fractions again showing no difference between treatments. This major decline of free-POM C when soils under native vegetation are brought into dryland cultivation has been reported by several other researchers as well (Six et al., 1998; Cambardella and Elliott, 1992; Tisdall and Oades, 1982). The lower C storage in the micro-C fraction under DRY, however, suggests that microaggregates can be more vulnerable to disturbance through cultivation than sometimes assumed (Tisdall and Oades, 1982). This again stresses the importance of microaggregates in determining the effects of land-use management on C storage.
management combined with no-tillage could form an even better C sequestration management option than irrigation alone, due to the possible additional protection and stabilization of SOM in macroaggregate-occluded microaggregates. It appeared impossible to confirm with our study that occlusion into macroaggregates was the mechanism by which C sequestration in microaggregates occurred under irrigation. Therefore, another explanation is needed to explain the mechanism behind C sequestration under irrigation. Although it is not possible to elucidate such a mechanism with the present work, we do believe key issues involved are (i) a high substrate availability due to increased residue inputs and (ii) a more favorable moisture regime for microbial activity under irrigation. Since free POM mainly consists of plant residues (Christensen, 2001), this fraction should be the first to increase with increased residue inputs. Although residue C inputs under IRR were 2.5 times as high as under DRY, there was no accumulation of free POM under IRR compared with DRY. This indicates that the higher moisture content under IRR promotes residue degradation by microbes to a much larger extent than under DRY. The rather vigorous formation of microbial exudates would then lead to an increased formation of microaggregates from silt and clay particles bonded together with microbes and small POM particles, giving them an increased C content and stability compared with microaggregates under dryland management. This is supported by the distribution of C inside microaggregates (showing an increase in both iPOM C and mSilt or mClay C under IRR). Additionally, we postulate that the high moisture content under IRR contributed to the stabilization of micro-C by increasing the extent of anaerobic zones inside the aggregates (Elliott and Coleman, 1988). More research is needed to verify if moisture content and residue C input indeed determine the potential of C sequestration under irrigation.
Link between Aggregation and Carbon Dynamics under Irrigation
CONCLUSIONS
The results of our study agree with studies dealing with identifying the importance of the microaggregate fraction as a preferential C stabilization site in alternative management systems (Six et al., 2000; Del Galdo et al., 2003; Denef et al., 2004; Kong et al., 2005). The microaggregate fraction investigated in these studies was always occluded in the macroaggregate fraction, however. Our findings are surprising, therefore, since they contradict and question the necessity of a protective environment provided by macroaggregates for preferential C sequestration by microaggregates, as postulated by Six et al. (2000). The macroaggregate-occluded microaggregate fraction can apparently only play a role in C stabilization (i) in soils that have the inherent capacity to form macroaggregates and (ii) under management systems that improve macroaggregate levels (e.g., Kong et al., 2005) or slow down macroaggregate turnover (e.g., Six et al., 2000). In our study, the increased C inputs under irrigation were not able to improve macroaggregate levels, possibly due to intensive tillage. In a center-pivot farming system in Otis, CO, similar to ours but under no-tillage, a significant increase in macroaggregation was observed under irrigation compared with dryland management (Denef, unpublished data, 2006). This supports the idea of disruption by tillage having a greater impact on aggregate levels than increased residue inputs under irrigation. Possibly, irrigation SSSAJ: Volume 71: Number 3 • May–June 2007
The results of this study showed that C storage under center-pivot irrigation was 25% higher than under dryland cultivation in an agricultural system in southwestern Nebraska. This greater C storage was mostly attributed to higher C sequestration inside microaggregates, but without the need for a protective environment of water-stable macroaggregates. Therefore, we postulate that the macroaggregate-occluded microaggregate fraction is only important for C sequestration in those management systems that can improve macroaggregate levels or slow down macroaggregate turnover, which was not the case for our study. Instead, we formulated a concept that attributed the increased C stabilization in free microaggregates under irrigation to a pronounced increase in microbial activity due to high moisture content and increased residue inputs, resulting in formation of stable microaggregates consisting of physically protected iPOM encapsulated in a matrix of silt and clay particles bound by chemically protected microbial exudates. This study confirms that irrigation management is a promising management option for enhancing soil C sequestration in (semi)arid agricultural areas such as southwestern Nebraska. Yet more studies on other irrigation systems under different management practices and across different climatic regions are needed to come to a more accurate image of the overall effects of irrigation on soil C stocks. Furthermore, the surprising results on the link between aggregation and C dynamics under irrigation stress the 1027
need for further integrated process-level research on this topic, since a better understanding of the mechanisms governing the C balance under irrigation is a prerequisite for a general evaluation of irrigation management as a best management practice for soil C sequestration in agricultural soils of (semi)arid regions. ACKNOWLEDGMENTS Thanks to Amy Swan and Gabe Olchin for field sampling, Gary Lee (USDA-NRCS) for the selection of the different sites and farms at Imperial, John Kimble for help with experimental design and field sampling, the many work studies for the soil sample preparations, Steven De Gryze for statistical assistance, and Cathy Stewart for laboratory and data assistance. REFERENCES Al-Nabulsi, Y.A. 2001. Saline drainage water, irrigation frequency and crop species effects on some physical properties of soils. J. Agron. Crop Sci. 186:15–20. Amezketa, E. 1999. Soil aggregate stability: A review. J. Sustain. Agric. 14:83–151. Cambardella, C.A., and E.T. Elliott. 1992. Particulate soil organic-matter changes across a grassland cultivation sequence. Soil Sci. Soc. Am. J. 56:777–783. Christensen, B.T. 2001. Physical fractionation of soil and structural and functional complexity in organic matter turnover. Eur. J. Soil Sci. 52:345–353. Churchman, G.J., and K.R. Tate. 1986. Effect of slaughterhouse effluent and water irrigation upon aggregation in seasonally dry New Zealand soil under pasture. Aust. J. Soil Res. 24:505–516. De Gryze, S., J. Six, C. Brits, and R. Merckx. 2005. A quantification of shortterm macroaggregate dynamics: Influences of wheat residue input and texture. Soil Biol. Biochem. 37:55–66. Del Galdo, I., J. Six, A. Peressotti, and M.F. Cotrufo. 2003. Assessing the impact of land-use change on soil C sequestration in agricultural soils by means of organic matter fractionation and stable C isotopes. Global Change Biol. 9:1204–1213. Denef, K., J. Six, R. Merckx, and K. Paustian. 2004. Carbon sequestration at the microaggregate level within no-tillage versus conventional tillage soils with different clay mineralogy. Soil Sci. Soc. Am. J. 68:1935–1944. Denef, K., J. Six, K. Paustian, and R. Merckx. 2001. Importance of macroaggregate dynamics in controlling soil carbon stabilization: Shortterm effects of physical disturbance induced by dry–wet cycles. Soil Biol. Biochem. 33:2145–2153. Elliott, E.T. 1986. Aggregate structure and carbon, nitrogen and phosphorus in native and cultivated soils. Soil Sci. Soc. Am. J. 50:627–633. Elliott, E.T., and D.C. Coleman. 1988. Let the soil work for us. Ecol. Bull. 39:23–32. Elnaim, E., M.S. Omran, T.M. Waly, and B.E. Nashar. 1987. Effects of prolonged sewage irrigation on some physical properties of sandy soil. Biol. Wastes 22:269–274.
1028
Follett, R. 2001. Soil management concepts and soil carbon sequestration in cropland soils. Soil Tillage Res. 61:77–92. Frey, S.D., E.T. Elliott, and K. Paustian. 1999. Bacterial and fungal abundance and biomass in conventional and no-tillage agroecosystems along two climatic gradients. Soil Biol. Biochem. 31:573–585. Harris, D., W.R. Horwath, and C. van Kessel. 2001. Acid fumigation of soils to remove carbonates prior to total organic carbon or carbon-13 isotopic analysis. Soil Sci. Soc. Am. J. 65:1853–1856. Intergovernmental Panel on Climate Change. 2001. Climate change: Mitigation. Cambridge Univ. Press, Cambridge, UK. Kong, A.Y.Y., J. Six, D.C. Bryant, R.F. Denison, and C. van Kessel. 2005. The relationship between carbon input, aggregation, and soil organic carbon stabilization in sustainable cropping systems. Soil Sci. Soc. Am. J. 69:1078–1085. Lal, R., J. Kimble, R. Follett, and C. Cole. 1998. The potential of US cropland to sequester C and mitigate the greenhouse effect. Ann Arbor Sci. Publ., Chelsea, MI. Levy, G., and J. Torrento. 1995. Clay dispersion and macroaggregate stability as affected by exchangeable potassium and sodium. Soil Sci. 160:352–358. Moreno, F., J. Martin-Aranda, K. Konstankiewicz, and F. Gomez-Rojas. 1986. Changes in soil physical and mechanical properties due to transformation from dry farming (olives) to irrigation (annual crops). Soil Tillage Res. 7:75–84. Paustian, K., J. Six, E.T. Elliott, and H.W. Hunt. 2000. Management options for reducing CO2 emissions from agricultural soils. Biogeochemistry 48:147–163. Poznyak, S.P. 1990. Physical properties of irrigated Chernozems of the southern Ukraine. Pochvovedeniye 2:48–55. Raes, D. 2002. BUDGET: A soil water and salt balance model. Reference manual. Dep. of Land Manage., Katholieke Univ. Leuven, Leuven, Belgium. SAS Institute. 2003. SAS/STAT user’s guide. SAS Inst., Cary, NC. Shainberg, I., G.J. Levy, J. Levin, and D. Goldstein. 1997. Aggregate size and seal properties. Soil Sci. 162:470–478. Sherrod, L.A., G. Dunn, G.A. Peterson, and R.L. Kolberg. 2002. Inorganic carbon analysis by modified pressure-calcimeter method. Soil Sci. Soc. Am. J. 66:299–305. Six, J., H. Bossuyt, S. Degryze, and K. Denef. 2004. A history of research on the link between (micro)aggregates, soil biota, and soil organic matter dynamics. Soil Tillage Res. 79:7–31. Six, J., E.T. Elliott, and K. Paustian. 2000. Soil macroaggregate turnover and microaggregate formation: A mechanism for C sequestration under notillage agriculture. Soil Biol. Biochem. 32:2099–2103. Six, J., E.T. Elliott, K. Paustian, and J.W. Doran. 1998. Aggregation and soil organic matter accumulation in cultivated and native grassland soils. Soil Sci. Soc. Am. J. 62:1367–1377. Tisdall, J., and J. Oades. 1982. Organic matter and water-stable aggregates in soils. J. Soil Sci. 31:291–298. Utomo, W.H., and A.R. Dexter. 1982. Changes in soil aggregate water stability induced by wetting and drying cycles in non-saturated soil. J. Soil Sci. 33:623–637.
SSSAJ: Volume 71: Number 3 • May–June 2007