Mar 14, 2015 - Non-cardiovascular chest CT features have limited predic- tive value ..... Moreover, we favoured not to use expert cardiothoracic radiologists as in .... Kim SS, Seo JB, Lee HY, Nevrekar DV, Forssen AV et al (2013). Chronic ...
Eur Radiol (2015) 25:1646–1654 DOI 10.1007/s00330-014-3495-0
COMPUTED TOMOGRAPHY
Cardiovascular disease prediction: do pulmonary disease-related chest CT features have added value? Pushpa M. Jairam & Pim A. de Jong & Willem P. Th. M. Mali & Ivana Isgum & Yolanda van der Graaf & on behalf of the PROVIDI study-group
Received: 23 April 2014 / Revised: 16 September 2014 / Accepted: 10 November 2014 / Published online: 14 March 2015 # The Author(s) 2015. This article is published with open access at Springerlink.com
Abstract Objective Certain pulmonary diseases are associated with cardiovascular disease (CVD). Therefore we investigated the incremental predictive value of pulmonary, mediastinal and pleural features over cardiovascular imaging findings. Methods A total of 10,410 patients underwent diagnostic chest CT for non-cardiovascular indications. Using a casecohort approach, we visually graded CTs from the cases and from an approximately 10 % random sample of the baseline cohort (n=1,203) for cardiovascular, pulmonary, mediastinal and pleural findings. The incremental value of pulmonary disease-related CT findings above cardiovascular imaging findings in cardiovascular event risk prediction was quantified by comparing discrimination and reclassification. Results During a mean follow-up of 3.7 years (max. 7.0 years), 1,148 CVD events (cases) were identified. Addition of pulmonary, mediastinal and pleural features to a cardiovascular imaging findings-based prediction model led to marginal improvement of discrimination (increase in c-index from 0.72 (95 % CI 0.71–0.74) to 0.74 (95 % CI 0.72–0.75)) and reclassification measures (net reclassification index 6.5 % (p2 focal or 1 extending >2 slices
Fully calcified coronary artery extending multiple slices
Descending aorta calcifications Number and size of calcifications
None
≤3 focal
4–5 focal or 1 extending ≥3 slices
>5 focal or >1 extending ≥3 slices
None
1 leaflet
2 leaflets
0
1
2
≥3
0
1
2
≥3
0
1
2
≥3
0
12
10
Mitral valve calcifications Number of affected valve leaflet(s) Airway thickening Number of affected lobes (range 0–5) Consolidation Number of affected lobes (range 0–5) Ground glass Number of affected lobes (range 0–5) Pleural effusion Sum of left and right fluid layers thickness on axial images, cm Lymph node Short axis diameter of the largest lymph node, mm LAD left anterior descending
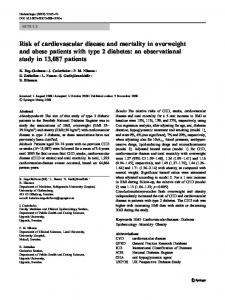
Fig. 2 Examples of pulmonary, mediastinal and pleural CT imaging characteristics. a Airway thickening (white arrow) and ground glass in the left lower lobe (black arrows). b Consolidation in the right under lobe (black arrow). c Short axis diameter measurement of the largest mediastinal lymph node. d Pleural effusion measurement of left-sided fluid layer on axial image
1650
Results During a median follow-up of 3.7 years (range 3.2–7.0 years), 1,148 CVD events occurred among the 10,410 subjects of the baseline cohort. Table 2 presents the baseline characteristics and chest CT imaging findings for the subcohort and CVD cases. As expected, the cases were slightly older, more often male and had more numerous and more severe cardiovascular calcifications as well as pulmonary, mediastinal and pleural abnormalities compared to the subcohort. These differences were all statistically significant (p10 mm
CVD cases n=1,148 68 (59–75) 723 (63) 505 (44) 80 (7) 103 (9) 241 (21) 80 (7) 126 (11) 298 (26) 321 (28) 207 (18)
325 (27) 180 (15) 72 (6)
333 (29) 253 (22) 195 (17)
84 (7) 12 (1) 125 (115–134)
149 (13) 34 (3) 130 (121–141)
120 (10) 132 (11) 108 (9)
138 (12) 161 (14) 138 (12)
144 (12) 84 (7) 96 (8)
172 (15) 149 (13) 138 (12)
180 (15) 108 (9)
184 (16) 126 (11)
48 (4)
57 (5)
60 (5) 72 (6) 48 (4)
57 (5) 115 (10) 92 (8)
457 (38) 252 (21)
551 (48) 287 (25)
Values are mean±standard deviation, median (interquartile range) or n (%) LAD left anterior descending
increased from 0.72 (95 % CI 0.71–0.74) to 0.74 (95 % CI 0.72–0.75). Reclassification as measured by the net
Eur Radiol (2015) 25:1646–1654
1651
Table 3 Hazard ratios (95 % CI) for cardiovascular events (n=1,148) during a median follow-up period time of 3.7 years according to the pulmonary disease-related CT findings on routine chest CT Sex- and age-adjusted HR (95 % CI) Airway thickening (%) Absent Reference Mild 1.3 (1.3–1.5) Moderate 1.3 (1.1–1.5) Severe 1.4 (1.1–1.7) Consolidation (%) Absent Reference Mild 1.1 (0.9–1.3) Moderate 1.5 (1.2–1.8) Severe 1.5 (1.1–1.9) Ground glass (%) Absent Reference Mild 1.4 (1.2–1.7) Moderate 1.9 (1.4–2.6) Severe 2.2 (1.6–3.0) Pleural effusion (%) Absent Reference Mild 1.3 (1.0–1.7) Moderate 2.7 (1.8–4.0) Severe 2.3 (1.5–3.5) Lymph node diameter (mm) 10 1.9 (1.6–2.2)
Multivariablea adjusted HR (95 % CI)
Reference 1.0 (0.8–1.3) 1.2 (1.0–1.4) 1.1 (0.9–1.3) Reference 0.9 (0.7–1.1) 1.2 (1.0–1.5) 1.3 (1.0–1.7) Reference 1.6 (1.3–1.8) 2.0 (1.7–2.4) 2.0 (1.6–2.4) Reference 1.0 (0.8–1.3) 1.7 (1.4–2.2) 1.7 (1.3–2.2) Reference 1.5 (1.3–1.8) 1.5 (1.3–1.8)
a Multivariable adjusted = adjustment for predictors of the cardiovascular CT features model: age, gender, CT indication, left anterior descending coronary artery calcification, mitral valve calcification, descending aortic calcification and the cardiac diameter
reclassification improvement (NRI) was 6.5 % (P